

1. INTRODUCTION
Cholera is an acute diarrhoeal illness caused by eating or drinking food or water that is contaminated with cholera bacterium (Vibrio cholerae) [1]. Water and/or foods that have been contaminated by feces from a cholera infected person are the main reservoirs of cholera bacterium. Cholera is most likely to occur in communities with unclean water, poor sanitation, and inadequate hygiene [2]. The symptoms of cholera could be severe, mild or no symptom at all. About 10% of individuals infected with cholera develop severe symptoms like watery diarrhoea and vomiting [2]. For these individuals, instant loss of body fluids leading to dehydration can result in death within hours without treatment [2].
Cholera remains a threat to public health worldwide. Statistics reveal that approximately 1.3 to 4 million people globally get cholera annually and 21,000 to 143,000 people die worldwide due to the infection [2], [1]. Children are the most vulnerable to the disease. Cholera is curable and preventable as it can be simply and successfully treated with oral rehydration solution (ORS) for immediate replacement of the fluid lost through diarrhoea [2]. With immediate rehydration, less than 1% of cholera infected persons die. The disease can be completely eliminated where access to clean water, sanitation and good hygiene practices are ensured and sustained for the whole population [2].
A cholera outbreak was confirmed in January 2021 in Nigeria and by January 2022, a total of 111,062 cases including 3,604 deaths (i.e., Case Fatality Ratio (CFR) 3.2%) as reported by the Nigeria Centre for Disease Control (NCDC) [3]. Children of age 5 - 14 years are affected most by the disease [3]. Of the 36 states in Nigeria, 33 states have the disease with four states accounting for 53% of all cumulative cholera cases: Bauchi (19,558 cases), Jigawa (15,141 cases) Kano (12,116 cases), and Zamfara (11,931 cases). From the onset of the outbreak, various control intervention strategies were implemented by the Nigerian Government [3]. These control intervention strategies include [3]:
1) Case Management & Treatment - Workshop and training of Health Care Workers on cholera case management and treatment. Laboratory Scientists trained on sample collection and analysis. Technical support and response commodities provided to affected communities.
∗Corresponding author
Received June 19th, 2023, Revised August 10th, 2023, Accepted for publication September 12th, 2023. Copyright ©2023 Published by Indonesian Biomathematical Society, e-ISSN: 2549-2896, DOI:10.5614/cbms.2023.6.2.8
- 2) Sanitation Provision of clean water, hygiene promotion, water purification, and household disinfectants. sensitization on dangers of open defecation on high-risk communities. Hygiene kits distributed to affected communities.
- 3) Vaccination Oral Cholera vaccination (OCV) campaigns conducted in high-risk communities.
- 4) Awareness campaigns Awareness campaigns, especially in affected communities.
With the above-mentioned control intervention strategies by the Nigerian Government, immediate elimination of the cholera outbreak was expected. Unfortunately, this did not happen as the outbreak lasted for about one year. A major reason for the prolonged outbreak despite the control interventions was because of the challenges that affected the effective implementations of these controls. Some of the challenges that affected effective implementation included [3]:
- 1) Difficulty in accessing some communities due to security concerns.
- 2) The extent of the use of open defecation in affected communities.
- 3) complete lack of clean drinking water in some rural communities.
- 4) Inadequate vaccines to cover all the affected communities.
- 5) Inadequate health facility infrastructure and cholera commodities for cholera case management.
- 6) Inadequately trained personnel for cholera case management.
Based on these points, the dynamics of this 2021 cholera outbreak is analysed here with a mathematical model that includes both the control intervention strategies as well as the implementation challenges. Results of these analyses can be used for an improved understanding of the dynamics of the 2021 Nigeria cholera outbreak and hopefully methods to reduce further outbreaks.
Mathematical models have been used successfully in analysing the dynamics and control of infectious diseases such as Cholera [4], [5], [6], [7]. In particular, [8] used a mathematical model to determine the optimal vaccination times during cholera outbreaks. The effects of seasonality on the 2010–2011 cholera outbreak in Haiti were analysed also using a mathematical model [9]. In another example the dynamics of cholera transmission was analysed in situation with limited resources [10]. Epidemiological data together with a mathematical model was used to study how river networks affect the spread of cholera epidemics by [11]. Optimal intervention strategies for cholera epidemics have been extensively studied using mathematical models [12], [13], [14]. The basic reproductive number, a measure for estimating the potential of the disease to spread, and vaccination coverage for the 2010–2011 cholera outbreak in Haiti were calculated using a mathematical model [15]. Also, the role of fluctuations of a water reservoir in long-term cholera dynamics was investigated with a model [16]. Other studies that considered a mathematical model in the analyses of cholera disease dynamics can be found in [17], [18], [19]. The immense contributions to understanding the dynamics and control of cholera epidemics by these studies are significant. However, to the best of our knowledge, none of these studies have considered the control intervention strategies as well as the challenges that affect their effective implementation. The present study is aimed to fill this gap in the literature. The results should improve our understanding of the dynamics of the 2021 cholera outbreak in Nigeria, and consequently aid researchers and policy makers in better managing cholera outbreaks in endemic areas where it is found.
2. MODEL FORMULATION
A mathematical model for based on the 2021 Nigerian cholera outbreak that takes into consideration all the major factors that influence its transmission dynamics and control is formulated. To make the model as realistic as possible, the following assumptions are made. Control measures (i.e., vaccination, treatment, sanitation, awareness campaign, and preventive measures) that are considered by the Nigerian government in fighting the cholera outbreak are incorporated in the model. Challenges such as insecurity that affected the effective implementations of these control measures were also captured in the model. One of the major effects of this insecurity is limited access to basic amenities by the victims. So, we assume in the model that a proportion of individuals have limited access to basic amenities due to insecurity. This includes individuals that have been displaced due to Nigerian conflict and violence. For example, there were about 1.9 million people displaced from their homes in North-Eastern Nigeria by conflict and violence in 2019 [20]. About 60% of these people were children, with 25% under the age of five [20]. Furthermore, one of the states in North-Eastern Nigeria (i.e., Bauchi (19,558 cases)) recorded the highest number of reported cholera cases
during the 2021 outbreak [3]. This suggests that insecurity had an influence on the 2021 cholera outbreak in Nigeria.
Since cholera is transmitted between humans and pathogens in contaminated water sources, two populations are considered in the model formulation. The total human population at time t, denoted by N(t), is partitioned into sub-populations of persons that are: susceptible (S(t)), vaccinated (V(t)), infected (I(t)), treated (T(t)), recovered (R(t)) and those with limited access to basic amenities due to insecurity (Q(t)) (i.e., N(t) = S(t) + Q(t) + V(t) + I(t) + T(t) + R(t)). To be clear, both the (S) and (Q) sub-populations are susceptible but the former have access to basic amenities and are more secure. The asymptomatic infections class is not included in this model formulation since cholera has a very small incubation period (i.e, between 2 hours and 5 days). The cholera pathogen in the water source at time t is denoted by B(t).
The dynamics of cholera across each of the sub-populations are captured in the model development as follows. The transmission of cholera can occur directly through eating food or drinking water that is contaminated with cholera [2], [1]. Susceptible individuals, vaccinated individuals, and individuals that have limited access to basic amenities due to insecurity may proceed to the infected class upon contracting the disease. Infected individuals are moved to the treatment class at a treatment rate for case management and proper treatment. Treated individuals proceed at a recovery rate to the recovered/temporally immune class upon recovery. Infected individuals can contaminate the water source or food by shedding cholera pathogens into it. Sanitation decreases the concentration of pathogens in food and water sources. Preventive measures such as awareness campaigns, and sanitation can lead to a reduction in transmission rate and are represented in the model as reduction parameter. Apart from insecurity which has been considered in the model formulation, other challenges that affect the effective implementation of the control measures such as open defecation, inadequate vaccine, lack of portable drinking water, inadequate health facilities, and trained personnel are captured in the model as follows. For instance, inadequate vaccine is considered by reducing the vaccination rate. Similarly, open defecation and lack of potable drinking water are considered by reducing the sanitation rate. Inadequate health facilities and trained personnel considered by reducing the treatment rate. Based on these assumptions, the following model for the dynamics and control of cholera is given by:
\[\frac{dS}{dt} = \Lambda(1-\rho) - \frac{(1-c)\beta SB}{B+K} - (\phi_1 + \mu)S,\] \[\frac{dQ}{dt} = \Lambda\rho - \frac{(1-c)(1+\eta)\beta QB}{B+K} - (\phi_2 + \mu + \delta_1)Q,\] \[\frac{dV}{dt} = \phi_1 S + \phi_2 Q - \frac{(1-c)(1-\varepsilon)\beta VB}{B+K} - \mu V\] \[\frac{dI}{dt} = \frac{(1-c)\beta SB}{B+K} + \frac{(1-c)(1+\eta)\beta QB}{B+K} + \frac{(1-c)(1-\varepsilon)\beta VB}{B+K} - (\sigma + \gamma_1 + \mu + \delta_2)I,\] \[\frac{dT}{dt} = \sigma I - (\gamma_2 + \mu + \delta_3)T,\] \[\frac{dR}{dt} = \gamma_1 I + \gamma_2 T - \mu R,\] \[\frac{dB}{dt} = \nu I - (\xi + \omega)B.\] (1)
The meaning of variables and parameters of Model (1) can be found in Tables 1 and 2 respectively.
Table 1: Variables for Model (1).
| Variables | Meaning |
|---|---|
| N(t) | Total human population at time \(t\) |
| S(t) | Population of susceptible humans at time t |
| Q(t) | S(t) with limited access to basic amenities (BA) due to insecurity |
| V(t) | Population of vaccinated humans at time t |
| I(t) | Population of infected human at time \(t\) |
| T(t) | Populations of treated individuals at time t |
| R(t) | Recovered/immune human at time t |
| B(t) | Concentration of pathogens in water source at time \(t\) |
Table 2: Parameters for Model (1).
| Variables | Meaning | Unit |
|---|---|---|
| \(\Lambda\) | Recruitment rate of humans through birth or immigration | Persons day-1 |
| \(\beta\) | Transmission rate | \(\mathrm{Day}^{-1}\) |
| K | Concentration of Vibrio cholerae in water or food that | |
| yield 50% chance of acquiring cholera disease | Cells \(L^{-1}\) | |
| \(\rho\) | Fraction of \(\Lambda\) with limited access to BA due to insecurity | Dimensionless |
| \(\mu\) | Natural mortality rate of humans | \(\mathrm{Day}^{-1}\) |
| \(\sigma\) | Rate of treatment of infected individuals | \(\mathrm{Day}^{-1}\) |
| \(\delta_1\) | Limited access to BA induced death rate of \(Q(t)\) | \(\mathrm{Day}^{-1}\) |
| \(\delta_2\) | Disease induced death rate of \(I(t)\) | \(\mathrm{Day}^{-1}\) |
| \(\delta_3\) | Disease induced death rate of \(T(t)\) | \(\mathrm{Day}^{-1}\) |
| \(\gamma_1\) | Natural recovery rate of \(I(t)\) | \(\mathrm{Day}^{-1}\) |
| \(\gamma_2\) | Expected recovery rate of \(T(t)\) | \(\mathrm{Day}^{-1}\) |
| \(\tau\) | Measure of decrease in vaccination rate due to insecurity | Dimensionless |
| \(\eta\) | Measure of increase in transmission rate due to insecurity | Dimensionless |
| \(\varepsilon\) | Efficacy of vaccine | Dimensionless |
| c | Measure of reduction in \(\beta\) using control measures | Dimensionless |
| \(\phi_1\) | Vaccination rate of \(S(t)\) | \(\mathrm{Day}^{-1}\) |
| \(\phi_2\) | Vaccination rate of \(Q(t)\) | \(\mathrm{Day}^{-1}\) |
| \(\nu\) | Shedding rate of pathogen into water source | \(\mathrm{Day}^{-1}\) |
| ξ | Decay rate of pathogen in water source | \(\mathrm{Day}^{-1}\) |
| \(\omega\) | Decrease in pathogen in water source due to treatment | Day-1 |
3. MODEL ANALYSIS
The dynamics of Model (1) are investigated analytically using dynamical system analyses supported by numerical simulations using data from the 2021 cholera outbreak in Nigeria and other data from the literature. Some important mathematical epidemiological features of model (1) are presented in this section to help with understanding the dynamics of the system. The following notations are sued to simplify the analyses: \(d_1 = \phi_1 + \mu\), \(d_2 = \phi_2 + \mu + \delta_1\), \(d_3 = \sigma + \gamma_1 + \mu + \delta_2\), \(d_4 = \gamma_2 + \mu + \delta_3\), and \(d_5 = \xi + \omega\).
3.1. Stability analysis
The disease-free equilibrium (DFE) of Model (1) is calculated as
\[(S^0, Q^0, V^0, I^0, T^0, R^0, B^0) = \left(\frac{\Lambda(1-\rho)}{d_1}, \frac{\Lambda\rho}{d_2}, V^0, 0, 0, 0, 0\right), \tag{2}\]
where \(V^{0} = \frac{\phi_{1}S^{0} + \phi_{2}Q^{0}}{\mu}\).
The basic reproduction number \((\mathcal{R}_0)\), an important epidemiological quantity used in estimating the ability of a new pathogen to spread, of Model (1) is calculated using the next-generation matrix method [21] and is given by
\[\mathcal{R}_0 = \mathcal{R}_0^S + \mathcal{R}_0^Q + \mathcal{R}_0^V, \tag{3}\] where
\[\mathcal{R}_{0}^{S} = \frac{(1-c)\nu\beta S^{0}}{(\sigma + \gamma_{1} + \mu + \delta_{2})(\xi + \omega)K},\] \[\mathcal{R}_{0}^{Q} = \frac{(1-c)(1+\eta)\nu\beta Q^{0}}{(\sigma + \gamma_{1} + \mu + \delta_{2})(\xi + \omega)K},\] \[\mathcal{R}_{0}^{V} = \frac{(1-c)(1-\varepsilon)\nu\beta V^{0}}{(\sigma + \gamma_{1} + \mu + \delta_{2})(\xi + \omega)K}.\]
The quantities \(\mathcal{R}_0^S\), \(\mathcal{R}_0^Q\), and \(\mathcal{R}_0^V\) represent contributions to the basic reproduction number from the S, Q and V respectively. Epidemiologically, if \(\mathcal{R}_0 < 1\) suggests that the disease may die out and if \(\mathcal{R}_0 > 1\) that the disease will persist [5], [21]. Thus, implementing control measures that keep \(\mathcal{R}_0\) below unity is the target for epidemiologist to improve the chances of achieving disease eradication [5], [21], [22], [4].
Theorem 3.1. The DFE of Model (1) is locally stable if \(\mathcal{R}_0 < 1\).
The proof of Theorem 3.1 can be found in the Appendix section. Mathematically, Theorem 3.1 suggests that the cholera disease could be eliminated using current control measures despite the challenges that affected the effective implementation of the control measures, if the initial population sizes of infected humans are within some neighbourhood of the DFE (2) and provided that the basic reproduction number is kept below unity.
3.2. Existence of cholera disease endemic equilibrium
Theorem 3.2. The cholera disease model (1) has at least one endemic equilibrium (EE) whenever \(\mathcal{R}_0 > 1\).
The proof of Theorem 3.2 is established in the Appendix section. The EE for Model (1) denoted by
\[E^* = (S^*, Q^*, V^*, I^*, T^*, R^*, B^*), \tag{4}\] is the steady-state solution of Model (1) in the presence of the disease. The existence of an endemic equilibrium for Model (1) shows that the assumptions used, which are reasonable, cholera can be endemic when \(\mathcal{R}_0 > 1\).
Existence and direction of bifurcation about \(\mathcal{R}_0 = 1\) for Model (1) can give some insight on the conditions under which cholera can be endemic or not in a system.
3.3. Bifurcation analysis
The quantity \(\mathcal{R}_0\) can be regarded as a point of bifurcation because at that point the equilibrium changes from a stable DFE to a stable EE. Thus, the bifurcation at \(\mathcal{R}_0 = 1\) is forward and is summarized in the Theorem below.
Theorem 3.3. Cholera disease model (1) undergoes a forward bifurcation at \(\mathcal{R}_0 = 1\).
The proof of Theorem 3.3 is presented is the Appendix section. Epidemiologically, as (1) undergoes a forward bifurcation at \(\mathcal{R}_0 = 1\), this implies that reducing the basic reproduction number below unity is sufficient for eradication of a cholera outbreak. This result agrees with our earlier theoretical findings on eradication of the cholera outbreak. However, to determine the impact of control measures on the 2021 cholera outbreak in Nigeria numerical simulations are required. Parameters for these simulation are based on the data of that outbreak. Simulations are also used to investigate the impact of challenges that affect the effective implementation of the control measures.
4. NUMERICAL SIMULATION
In this section, data on reported cholera cases in Nigeria together with Model (1) are used to explore the effects of the control intervention strategies as well the challenges that affected their effective implementation.
4.1. Model fitting and parameter estimation
Model (1) is fit to data for Nigerian cholera cases reported from January 2021 to January 2022, extracted from the NCDC Situation Report [3] (Figure 1). Parameters values for the control measures are fit to these data and the model (1) with the other parameters obtained from existing literature (Table 3). Model fitting was carried out using the built-in MATLAB least-squares fitting routine fmincon in the optimization tool box. The fmincon routine is a nonlinear optimization method that finds a constrained minimum for a scalar function of several variables using an initial estimate.
In fitting model (1) to the data, the following assumptions and modifications are made. The reported cases of cholera comprise the following: infected individuals I(t), and treated individuals T(t). The transmission rates \(\beta\), is multiplied by a seasonality factor \((\varphi_0 + \varphi_1 \sin(\frac{\pi t}{12} + \varphi_2))\), to account for the seasonal pattern observed in this and other cholera data, where \(\varphi_1\), \(0 \le \varphi_1 \le 1\) is the amplitude of the seasonal variation, \(\varphi_2\), is the season phase with constant value and \(\varphi_0\), \(0 < \varphi_0 \le 1\) is the vertical shift [3], [23], [9], [24]. The value of these parameters \((\varphi_0, \varphi_1, \varphi_2)\) for the seasonality factor are determined such that non-negativity is preserved in the model dynamics. The model is fit using the parameter values presented in Table 3. Most of the parameter units in Table 3 are per day, but these are converted to units per month for the numerical simulations. Since our interest is on the impact of control measures and implementation challenges, parameters representing the various control measures and implementation challenges are estimated using the model fitting and are given in Table 4.
Parameter Unit Value Source Persons day<sup>-1</sup> 10000 Λ [25] \(Day^{-1}\)β 0.075[19] \(\bar{\rm Day}^{-1}\)\(5.48 \times 10^{-5}\)[26] \(\mu\)KCells \(L^{-1}\)\(10^{9}\)[27] <sup>-1</sup>day<sup>-1</sup>person<sup>-</sup> \(\nu\)Cells \(L^{-}\)10 [27], [28] \(\mathrm{Day}^{-1}\)ξ [8], [29] Dimensionless [30] ε \(Day^{-1}\)0.2 [8], [29] \(\gamma_1\)\(\mathrm{Day}^{-1}\)0.015 \(\delta_2\)[31], [19] \(\mathrm{Day}^{-1}\)\(\delta_3\)0.0001 [32]
Table 3: Parameters for Model (1).
Table 4: Fitted parameters for Model (1).
| Parameter | Unit | value |
|---|---|---|
| \(\rho\) | Dimensionless | 0.0000005188 |
| \(\stackrel{\cdot}{c}\) | Dimensionless | 0.2424 |
| \(\phi_1\) | \(Month^{-1}\) | 0.0776 |
| \(\eta\) | Dimensionless | 0.999998 |
| \(\phi_2\) | \(Month^{-1}\) | 0.000000089899 |
| \(\delta_1\) | \(Month^{-1}\) | 0.07716 |
| \(\sigma\) | \(Month^{-1}\) | 0.19461 |
| \(\gamma_2\) | \(Month^{-1}\) | 0.38104 |
| \(\omega\) | \(Month^{-1}\) | 8.99999 |
The resulting fit in Figure 1 is reasonable for the 2021 cholera outbreak in Nigeria. Hence, the model is used to study the dynamics of the 2021 outbreak further. Specifically, the model is used to estimate the impact of the control measures and the challenges that affected the effective implementation of these control measures.
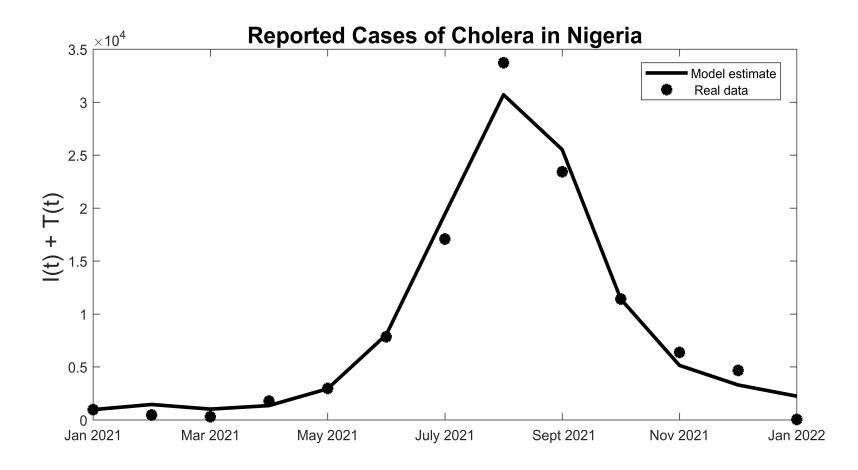
Figure 1: Model fit of the reported cases of cholera in Nigeria from January 2021 to January 2022, where bold lines represent the model fit and stars mark the reported cases.
Using these parameter values, the basic reproduction number R0 for this Cholera outbreak is calculated to be R0 = 0.2281. Thus, despite the challenges that affected the effective implementation of the control measures, Nigerian cholera can be controlled provided the basic reproduction number remains below unity.
4.2. Sensitivity analyses
To analysing optimal methods in minimizing possible re-occurrence of a cholera epidemic as in Nigeria, it is crucial to understand the significance of the various factors responsible for the cholera transmission. Disease transmissions have been shown to be directly associated with the basic reproduction number R0 [33]. Thus, sensitivity analysis is used to determine which parameters have a significant effect on the basic reproduction number (R0).
The Latin Hypercube Sampling Method (LHSM) is used for the sensitivity analysis. From LHSM, the partial rank correlation coefficients (PRCCs) of R0 are calculated (Table 5). The magnitude and sign of the PRCC determine the effect of each parameter on the R0. For example, a parameter with a positive PRCC value decreases R0 when decreased whereas a parameter with a negative PRCC value decreases R0 when increased. Parameters with PRCC values greater than 0.5 or less than -0.5 are considered to be the most sensitive to R0 [34].
From Figure 2, the most sensitive parameters with the highest influence on the basic reproduction number R0 is the vaccine efficacy ε. This shows that vaccination is one of the most important control measures for possible eradication of that cholera outbreak in Nigeria. Unfortunately, effective implementation of vaccination was affected by inadequate vaccines to cover all communities affected by the 2021 cholera outbreak [3]. Therefore, provision of adequate vaccines with high efficacy that cover all communities affected by cholera is strongly recommended.
Other parameters with a sensitive influence on the basic reproduction number R0, in descending order of the PRCC value, are the shedding rate ν, the transmission rate β, the concentration of Vibrio cholerae in the water or food K, the recruitment rate Λ, the natural death rate µ and the natural recovery rate γ1. Thus, these parameters must be considered for better management of cholera outbreaks in Nigeria. The remaining parameters do not significantly influence R0 (ω, c, ξ, δ2, ρ, δ1, ϕ1, δ3, γ2, σ, ϕ2, and η).
| Parameter | Sensitivity indices of R0 |
|---|---|
| Λ | 0.5945 |
| β | 0.6209 |
| µ | -0.5883 |
| K | -0.6186 |
| ν | 0.6315 |
| ξ | -0.0772 |
| ε | -0.9253 |
| γ1 | -0.5674 |
| δ2 | -0.0931 |
| δ3 | -0.0058 |
| ρ | 0.0379 |
| c | -0.0559 |
| ϕ1 | -0.0378 |
| η | -0.0262 |
| ϕ2 | -0.0312 |
| δ1 | -0.0316 |
| σ | -0.0114 |
| γ2 | -0.0647 |
| ω | -0.2220 |
Table 5: The PRCC values for the sensitivity indices of R0.
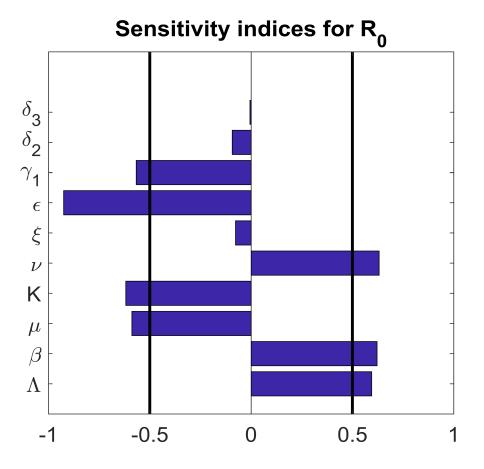
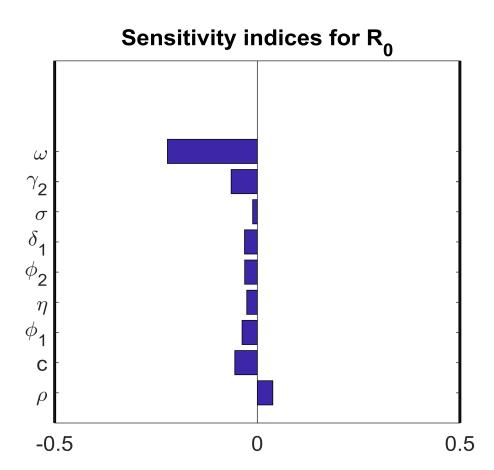
Figure 2: Tornado plot showing the sensitivity indices for R0.
4.3. Effects of control measures on the cholera outbreak
Several control intervention strategies were implemented by the Nigeria government in fighting the 2021 cholera outbreak [3]. Despite the challenges such as insecurity in some affected communities, the number of reported new cases of cholera were minimized after a period of one year using the various control measures.
By definition, an epidemic is a disease outbreak that spreads quickly and affects many individuals. The global pandemic of coronavirus disease first reported in December 2019 created a global awareness of the concept of 'flattening the curve' in which the aim is to spread out the rate of infection so as to not overwhelm health care systems. Here simulations are used to consider to what extent control parameters could flatten the Nigerian cholera curve.
Cholera vaccination is one of the approved method of fighting cholera epidemics [35]. When applied to the susceptible population simulations show that this control, ϕ1 and ϕ2 in the model, can be very effective in reducing cholera with curve completely flattened (Figure 3).
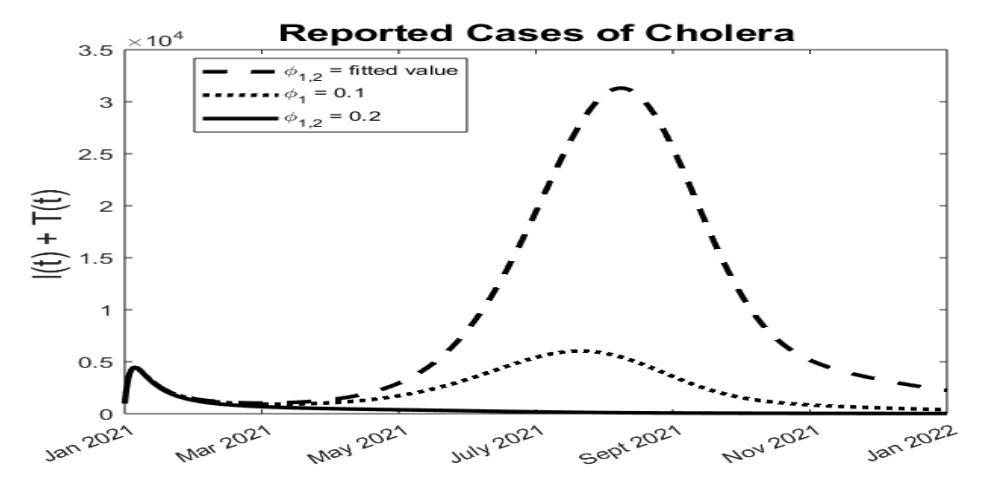
Figure 3: Plot showing the dynamics of the cholera outbreak when increasing vaccination (ϕ1 and ϕ2) for the population with access to basic amenities.
Hydration is the primary treatment for cholera and antibiotics are used for severely ill patients [36]. These medical treatments of individuals infected with cholera are also approved methods of controlling cholera [35]. The Government of Nigeria, through the NCDC and Ministry of Health, established a Case Management & Treatment programme for the 2021 cholera outbreak. Control measures such as these are captured in our model as treatment rate (σ). Effective treatment reduces the cholera cases significantly but the curve is not completely flattened (Figure 4).
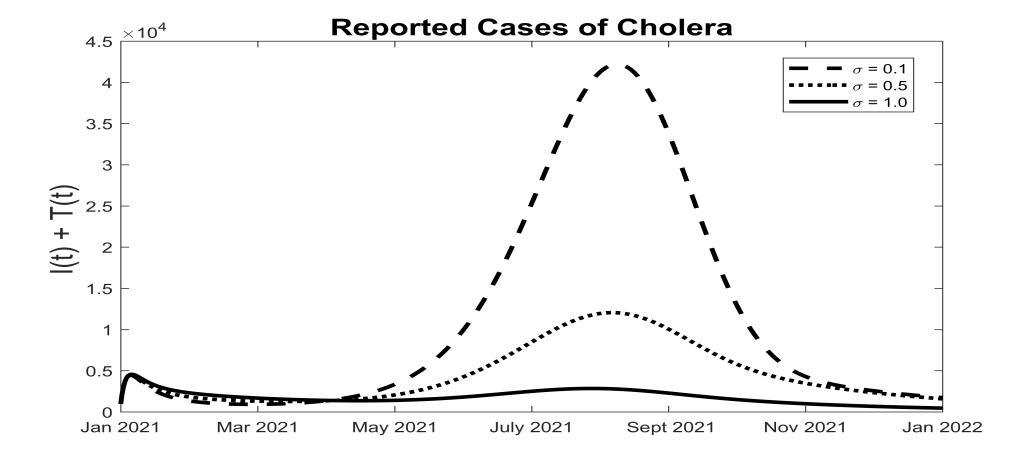
Figure 4: Plot showing the effects of clinical treatment (σ) on the dynamics of the cholera outbreak.
Interventions for improved water purity are also recommended as a long-term solutions to cholera [35]. According to WHO, total eradication of cholera globally depends on universal access to safe drinking water and adequate sanitation [35]. The government of Nigeria introduced a water treatment programme, especially in the communities affected by cholera. This control is represented by ω in our model. The simulations show that the effective treatment of water can also reduce cholera but again not completely (Figure 5).
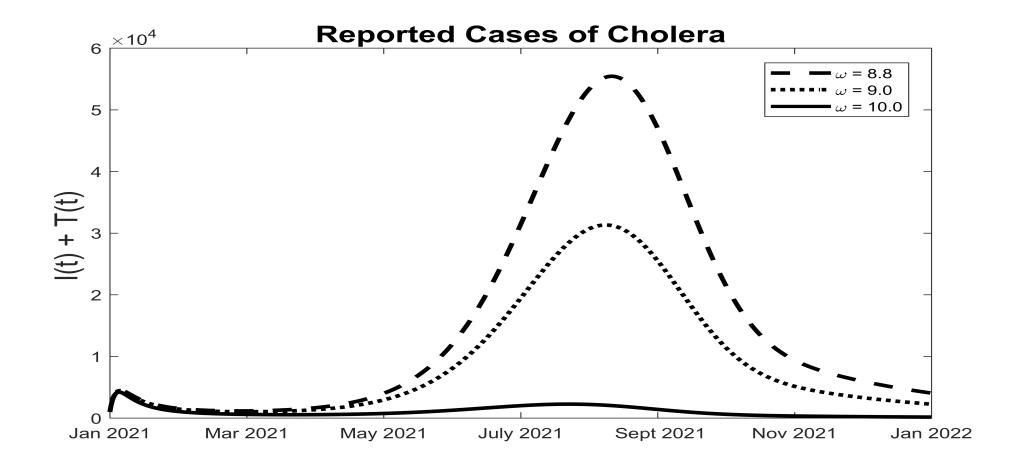
Figure 5: Plot showing the effects of water treatment (ω) on the dynamics of the cholera outbreak.
Reduction in cholera transmission using approved epidemiological methods [35] such as Cholera Awareness Campaigns and Sanitation Programmes were implemented by the Nigerian government through their Ministry of Health [3]. Control measures such as these are captured in Model (1) as a reduction in contact rates by a factor c. Effective implementation of these control measures can also reduce cholera but again not completely (Figure 6).
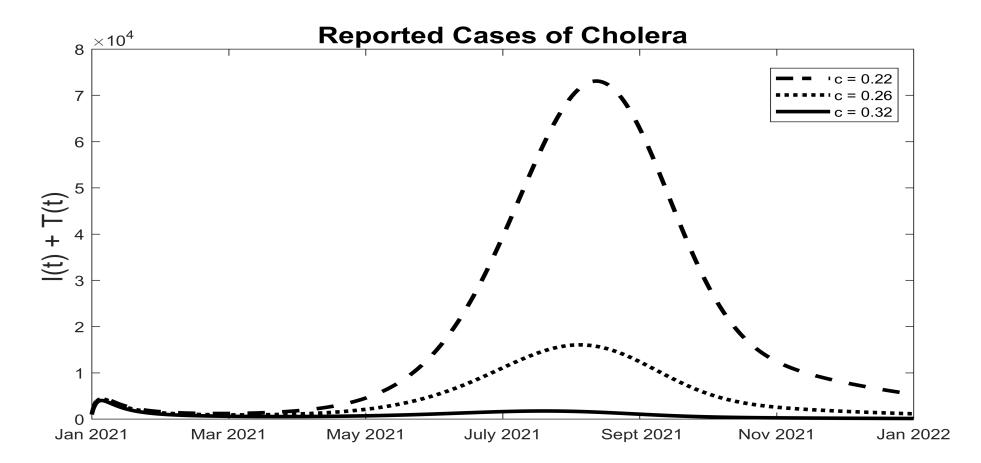
Figure 6: Plot showing the effects of campaigns such as improving sanitation (c) on the dynamics of the cholera outbreak.
4.4. Challenges that affected the 2021 cholera outbreak in Nigeria
Implementation of control intervention strategies by the Nigeria government to stop the 2021 cholera outbreak was affected by several challenges [3]. For example, many individuals displaced due to security issues created a challenge to the effective implementation of control measures [20]. Increasing cholera transmission due to insecurity is captured in our model as η. Increased insecurity clearly adds to the problem resulting in a more accentuated curve (Figure 7) .
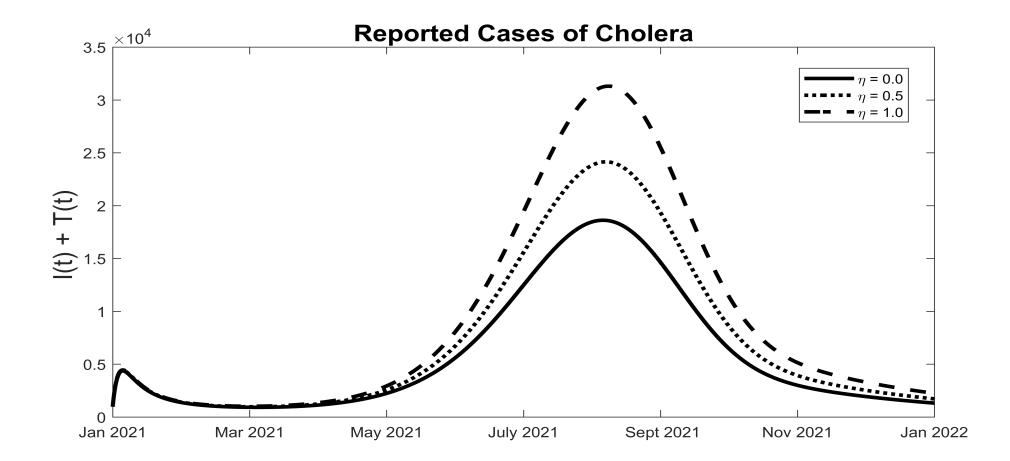
Figure 7: Plot showing the effects of increasing insecurity (η) on the dynamics of cholera outbreak in Nigeria.
5. CONCLUSION AND DISCUSSION
Cholera is an acute diarrhoeal illness currently affecting humanity globally especially in areas where there is limited access to clean water and adequate sanitation. An outbreak of cholera was reported in Nigeria in January 2021 and by January 2022 many cases and deaths had been recorded from 33 states out of 36 states in Nigeria [3]. Bauchi, a state in North-East Nigeria, recorded the highest number of cases. In this state many individuals, especially children, are displaced due to violence and conflicts [20], [3]. The immediate intervention of the Nigerian government by implementing several control strategies to stop cholera outbreaks did not yield the expected results. A possible explanation for this could be the challenges that affect the effective implementation of control measures, such as insecurity.
This study considered a mathematical model to analyse the dynamics of the 2021 Nigerian cholera outbreak. Using parameters from published literature and control parameters that are fitted to the data, the model is shown to fit the Nigerian data well. Since the model gives a reasonable fitting, the basic epidemiological features of the model were determined and analysed. For instance, the model is shown to have a unique disease-free equilibrium and at least one endemic equilibrium. The basic reproduction number R0 of the model was determined using the next-generation matrix method. It is shown that the disease-free equilibrium is asymptotically stable when R0 < 1. This suggests that the cholera disease could be eliminated using current control measures despite the challenges that affected the effective implementation of these controls if the initial population of infected humans are within some neighbourhood of the disease free equilibrium (2) and provided that the basic reproduction number is kept below unity. The Centre Manifold Theorem was used to determine the conditions for bifurcation about R0 = 1. Specifically, the model was shown to undergo forward bifurcation, about R0 = 1. Based on this, keeping the basic reproduction number below unity is sufficient for the eradication of cholera using the specified control measures, notwithstanding the current challenges that affect the effective implementation of these control measures.
Sensitivity analysis is used to determine the parameters that have the highest influence on the cholera transmission. The most sensitive parameter with the highest influence on disease transmission is vaccine efficacy ε. Numerical simulations show that effective implementation of vaccination can result in faster eradication and cholera curve can be flattened with this control. Thus, vaccination is one of the most important control measures for possible eradication of cholera outbreaks in Nigeria. However, a major hindrance to this control measure is inadequate vaccines to cover all the communities affected with cholera in Nigeria [3].
Other important parameters with high influence on the cholera disease transmission in descending order of magnitude of PRCC value are shedding rate ν, followed by recruitment rate Λ, the concentration of Vibrio cholerae in water or food that yield 50% chance of acquiring cholera disease K, transmission rate β, the natural recovery rate of infected individuals γ1 and natural death rate µ.
Apart from vaccination, numerical simulations are used to consider the possible influence of other controls.
For example, effective treatment can reduce the number of cases in a cholera outbreak. Thus, prompt and effective treatment of infected individuals is recommended. WHO recommends clean water for the long-term solution to cholera [1]. The simulation show that cleaner water reduces infections. Therefore, improving water purity is also recommended. Awareness and sanitation campaigns are also shown to be able to prevent cholera cases. However, the simulations point to vaccination as the only control that could flatten the curve completely.
Challenges that affected the effective implementations of the control strategies of the 2021 cholera outbreak in Nigeria are also considered numerically. It is shown that more individuals are exposed to cholera infections if there is inadequate security of life and property. Therefore, to reduce the effects of cholera, security issues are also important and should be addressed.
Overall, simulations using a model fitted to data from a Nigerian cholera outbreak show that the most effective control is vaccination. Clinical treatment, water purification, sanitation and awareness, and improving personal security can each reduce numbers of cases. A combination of all these controls should help considerably. All these controls are difficult to implement in Nigeria because of the size of the country, civil disturbances and economic constraints. Regardless, it is shown that improving these controls can limit the disease.
ACKNOWLEDGEMENT
O.C.C. & K.J.D acknowledge the financial support from the National Research Foundation of South Africa (Grant Number 131604).