

1. INTRODUCTION
The use of network models to describe the spread of disease caused by contact behavior among individuals in a population has been used for recent years and widely used [1], [2]. We call the model a contact network for accommodating social contacts that play a role in disease spread [3]. This social contact will affect how a disease spreads in a population. For example, some diseases are transmitted through direct physical contact with infected individuals such as HIV, Ebola, and Smallpox [4]. Some of those are even contagious just because of the proximity of two individuals within a certain distance, such as influenza, measles, and COVID-19. Thus, in building a network model to describe disease transmission caused by contact between individuals, we need to determine the type of contact that is relevant such that it is easy for us to describe the mechanism of disease spread in a population [5].
Despite modelling the epidemic spreading by using contact network for accommodating many features of social behaviour is still mathematically and computationally challenging [6], in general, network models can capture many human interactions in a population regarding disease spread. The network models provides a range of flexibility for assigning individuals various attributes and defining links with a range of properties [7]. For example, every individual in a population can be connected by traditional links, personal contact, or physical proximity. The links among individuals can be attached by frequency or intensity of social contacts, distance between two connected individuals, or transmission probability. Using all those attributes and properties depending on the disease and context not only makes network models more realistic but also makes it possible to incorporate measures and control procedures to find more effective mitigation strategies [5], [8].
Back to COVID-19, when it was first identified in Wuhan, China in December 2019, COVID-19 has spread since then and become one of the most life-threatening diseases globally [9]. Transmission of this disease is generally caused by close, prolonged, and frequent contact between two individuals, whether by shaking hands, conversational distance, coughing or sneezing at close range and by air in poorly ventilated indoors [10], [11]. These factors make the disease spread quickly and easily, and in turn, make the epidemic size grow exponentially [12]. The inevitable proximity in social contact is the main cause of many respiratory
*Corresponding author
Received April 15th, 2024, Revised June 13th, 2024, Accepted for publication June 26th, 2024. Copyright ©2024 Published by Indonesian Biomathematical Society, e-ISSN: 2549-2896, DOI:10.5614/cbms.2024.7.1.6
infections spreading rapidly in a population [13], including COVID-19, influenza, common colds, and many others [14].
As an effective measure and protection, vaccination has a long history of success in preventing and controlling the spread of major infectious diseases [15], [16]. Vaccine enhances our immune system to build natural protection and reduce the mortality and the morbidity of many infectious diseases [17]. Vaccinated individuals have even fewer clinical symptoms, reduced susceptibility and infectivity [18]. Through vaccination, we can attain herd immunity, also known as 'population immunity', without any need to directly expose each individual in the population to the pathogen [19]. Herd immunity is a condition where the population is immune from an infectious disease by vaccinating a substantial proportion of the population. Thus, vaccinated individuals are protected, and unvaccinated individuals are kept safe and protected from the disease.
There are many types of vaccine regimens in vaccination programs depending on the severe of the disease, its availability and distribution, and clinical responses of the patients to the vaccine. Vaccination with a single dose may have more advantages such as reducing more cases and deaths than the two-dose vaccine, and also reducing logistical complexity [20]. However, vaccination with two doses may improve the magnitude and durability of immunity and protective efficacy [21]. In addition, most COVID-19 vaccines require two doses to reach the optimal vaccination results [22].
The success of vaccination strategies can depend strongly on the contact behavior among individuals in a population [23]. The contact behavior determines the network structures that can be a key to predicting the disease spread and the final epidemic size, and in turn, becomes important to evaluate vaccination strategies choose the best ones. Some realistic vaccination strategies such as mass preventive vaccination, ring post-outbreak vaccination, and acquaintance preventive vaccination, can be effective when applied to contact networks with various connectivity [24]. The social structure underlying contact network also increases the vaccination effectiveness of COVID-19 by allocating the COVID-19 vaccines to individuals' connectivity [25]. It relates to prioritizing mass vaccination strategy to the individuals with high contact intensity in the population to effectively control the COVID-19 epidemic [26].
In this paper, we first generate a synthesized human interaction network with a given average degree and random frequency of contacts. The network has been introduced in [27] to imitate the social contact behavior among individuals in a population sized N=10,000. Then, we develop a discrete SIR model that captures the microscopic process of disease spreading [28] and includes two vaccine doses considering vaccination distribution, its coverage, and the time to start it.
The study in this paper has some limitations and relies heavily on computation. The network model in this study is not a real representation of a bigger population. The simulations performed are proposed to be a consideration when the decision-making of optimal vaccination strategies are needed to prevent and mitigate the epidemic ahead.
2. MODEL FORMULATION
Despite many networks following scale-free networks, we choose the simplest examples of random networks with a fixed number of nodes and edges that are used to mimic some features of social behavior in the context of disease spread due to physical proximity [1]. Given size of population N and average degree \(\bar{k}\) of each individual, we can generate the so-called synthesized human interaction network by taking N nodes and placing \(L = \bar{k}N/2\) edges among them at random. We then attach each edge with a natural number which is randomly chosen from set \(W = \{1, 2, \dots, \omega\}\). These numbers are the contact intensity of connected individuals in a unit of time and \(\omega\) is the maximum intensity that two connected individuals can attain. Now, we have a weighted adjacency matrix \(\mathbf{A} = (a_{ij})\) with \(a_{ij} \in W \cup \{0\}\) to represent the network. It is assumed undirected to make each individual can transmit or receive the disease. If \(a_{ij} = 0\), then there is no connection or link between node i and node j and in turn, there is no transmission between them. We denote \(N_i\) as a set containing all neighbors of node i.
Let T be the length of the epidemic. We set one day as a unit time and we write time discretization as \(t=0,1,2,\ldots,T\). Since we want to develop a discrete SIR model at microscopic level, we denote \(X_t^i\) as a state of node i at time t. It can be susceptible \((X_t^i=S_t^i)\), infected \((X_t^i=I_t^i)\), or recovered \((X_t^i=R_t^i)\) as shown in Table 1. The state \(X_t^i\in\{0,1\}\) and
\[S_t^i + I_t^i + R_t^i = 1 \ \ \text{for all nodes} \ i \ \text{and for all time} \ t. \tag{1}\]
At the initial time t=0, we choose randomly one individual to get infected. We also choose randomly for every time one susceptible or unvaccinated recovery individual gets infected by an external factor during the epidemic, which means that a new infection can emerge without viral transmission from other individuals in the population. The infected individuals will transmit the infection with probability \(\beta\) which is defined as the average rate of infection in one contact. We denote \(\xi\) as a Bernoulli random variable with probability \(\beta\) to indicate the success of transmission from infected individuals. We write \(\xi \sim \text{Bernoulli}(\beta)\) for short. Now, we write a function that describes all transmission process from all neighbors to node i at time t.
\[\phi_t^i = 1 - \prod_{j \in N_i} \prod_{k=1}^{a_{ij}} \left( 1 - \xi I_{t-1}^j \right). \tag{2}\]
When node i get infected from one infected individual of its neighbors, the term \(\prod_{j \in N_i} \prod_{k=1}^{a_{ij}} \left(1 - \xi I_{t-1}^j\right)\) will be 0 and \(\phi_t^i = 1\). In contrast, when there is no infected individual in all neighbors, then the term \(\prod_{j \in N_i} \prod_{k=1}^{a_{ij}} \left(1 - \xi I_{t-1}^j\right)\) will be 1 and \(\phi_t^i = 0\). Note that the term \(\prod_{j \in N_i} \prod_{k=1}^{a_{ij}} \left(1 - \xi I_{t-1}^j\right)\) will be 0 with a high probability when \(N_i\), \(a_{ij}\), and \(\beta\) are also high.
Table 1: The description of states.
| State | Description |
|---|---|
| \(S_t^i\) | state at time t when a node i is susceptible \((S_t^i = 1)\) or not \((S_t^i = 0)\) |
| \(I_t^i\) | state at time t when a node i is infected \((I_t^i = 1)\) or not \((I_t^i = 0)\) |
| \(R_t^i\) | state at time t when node i is recovered \((R_t^i = 1)\) or not \((R_t^i = 0)\) |
Instead of using an infection rate to move an individual from susceptible to an infected state or using a recovery rate to move an individual from infected to a recovered state as we often used in the common compartmental models, we use a unit step function to move an individual from one state to another. We define a unit step function as follows.
\[u(t,\alpha) = \begin{cases} 0 & t < \alpha, \\ 1 & t \ge \alpha. \end{cases}\] (3)
In our model, to move an infected node i to recovery state, we use unit step function \(u\left(t,\bar{t}^i+\tau\right)\), where \(\bar{t}^i\) is the time when a node i gets infected and \(\tau\) is the average length of the infectious period. In this paper, we assume that a recovered node does not gain permanent immunity from the infection as long as vaccination is not completed and it will move to susceptible state after a certain time, say \(t_{im}\), by function \(u\left(t,\bar{t}^i+\tau+t_{im}\right)\). The process of state transition for each node in the network is governed by the following system of equations.
\[S_{t+1}^{i} = S_{t}^{i} \left( 1 - \phi_{t}^{i} \right) + u \left( t, \bar{t}^{i} + \tau + t_{im} \right) R_{t}^{i}, \tag{4}\]
\[I_{t+1}^{i} = I_{t}^{i} \left( 1 - u \left( t, \bar{t}^{i} + \tau \right) \right) + \phi_{t}^{i} S_{t}^{i}, \tag{5}\]
\[R_{t+1}^{i} = R_{t}^{i} \left( 1 - u \left( t, \overline{t}^{i} + \tau + t_{im} \right) \right) + u \left( t, \overline{t}^{i} + \tau \right) I_{t}^{i}. \tag{6}\]
Based on (4)-(6), the total number of nodes for each state at time t follows these equations.
\[S_t = \sum_{i=1}^{N} S_t^i, \ I_t = \sum_{i=1}^{N} I_t^i, \ R_t = \sum_{i=1}^{N} R_t^i.\] (7)
Now, to incorporate the vaccination process with two doses into the model we developed above, we denote \(\epsilon^i\) as vaccination coefficient of node i and denote \(\eta\) as vaccine efficacy. We set \(\epsilon^i=1-\eta\) when a node i has received vaccine dose 1, \(\epsilon^i=0.5(1-\eta)\) when a node i has received vaccine dose 2, and \(\epsilon^i=1\) if a
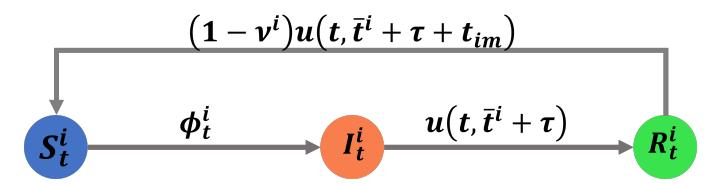
Figure 1: The process of state transition for a node i in the network at time t when the vaccination is incorporated.
node i does not received any vaccine dose. Since there is no vaccine is 100\% effective [29], we can set \(\epsilon^i\)small enough but not zero when a node i has received vaccine dose 2 which means a node i is still possible to transmit the disease even it received the vaccine dose 2 and gain permanent immunity.
Let \(t_v\) be the time vaccine dose 1 is administered and \(\delta_v\) be the gap time between dose 1 and dose 2. We assume that vaccine doses give impact on transmission and we write \(\xi \sim\) Bernoulli \((\epsilon^i \epsilon^j \beta)\). We also assume that each individual will gain permanent immunity after completing two vaccine doses as long as he or she is in susceptible state and denote \(\nu^i\) as an indicator of node i to gain permanent immunity. In other words, the susceptible individuals who completed the vaccination will move directly from the susceptible state into recovery [30]. We set \(\nu^i \sim \text{Bernoulli}(\eta)\) when a node i has received vaccine dose 1 and \(\nu^i = 1\) when a node i has completed all vaccine doses. Now, we show the process of state transition for each node in the network in Figure 1 and adjust (4)-(6) by rewriting the equations as follows.
\[S_{t+1}^{i} = S_{t}^{i} \left( 1 - \phi_{t}^{i} \right) + \left( 1 - \nu^{i} \right) u \left( t, \bar{t}^{i} + \tau + t_{im} \right) R_{t}^{i},\] \[I_{t+1}^{i} = I_{t}^{i} \left( 1 - u \left( t, \bar{t}^{i} + \tau \right) \right) + \phi_{t}^{i} S_{t}^{i},\] \[(8)\]
\[I_{t+1}^{i} = I_{t}^{i} \left( 1 - u \left( t, \overline{t}^{i} + \tau \right) \right) + \phi_{t}^{i} S_{t}^{i}, \tag{9}\]
\[R_{t+1}^{i} = R_{t}^{i} \left( 1 - \left( 1 - \nu^{i} \right) u \left( t, \bar{t}^{i} + \tau + t_{im} \right) \right) + u \left( t, \bar{t}^{i} + \tau \right) I_{t}^{i}.\] \[(10)\]
Herein, we have two ways to distribute the vaccine: by random and by targeting hubs. We define hubs as those nodes that have high degree [8]. We then let \(\rho\) as a portion of the vaccinated target when the vaccination distribution is implemented by random. If the vaccine is administered by targeting hubs, vaccination will cover all of them.
3. RESULTS
In this section, we will show some theoretic simulation results by performing microscopic process with 100 samples. We set fixed parameter values for all types of vaccination scenarios: \(N=10,000, \bar{k}=8,\)\(\underline{\omega} = 5, T = 500, N_0 = 1, \beta_0 = 0.00001, \beta = 0.01, \tau = 15, t_{im} = 100, \eta = 0.85\), and \(\delta_v = 90\). Assuming k=8 and \(\omega=5\) means that we try to mimic a real contact network without implementing any containment or non-pharmacological interventions. The network structure we obtain from this assumption is shown in Figure 2. In these simulations, we want to show that the vaccination distribution, the portion of vaccinated individuals, and the time to start the vaccination play a role in mitigating and curbing the epidemic. We set fixed vaccine efficacy \(\eta\) and gap time between vaccine dose 1 and dose 2, \(\delta_v\), to minimize the wide range of vaccination strategy possibilities. Thus, we choose two main types of vaccination scenarios as follows.
- 1) Vaccination by choosing individuals randomly.
- 2) Vaccination by targeting hubs.
In vaccination by choosing individuals randomly, we choose a certain portion of the population to receive vaccine dose 1 at the early time of the epidemic process. In this scenario, we want to examine whether vaccination coverage without considering the connectivity will impact to curb the epidemic effectively. Meanwhile, in vaccination by targeting hubs, we administer the vaccination to hubs. Hubs are the individuals who have degree 14 or more [8]. Hubs play an important role in spreading the disease fast and wide. In this scenario, we want to confirm that targeting hubs as vaccination coverage will curb the epidemic more effective.
We divide each type of vaccination into four cases based on the portion of vaccinated individuals (\(\rho\)) and the time when vaccination starts \((t_v)\). We set \(\rho = 0.5\) and \(\rho = 0.75\) to represent the limited coverage of vaccination. We also set \(t_v = 15\) and \(t_v = 30\) to represent the vaccination lateness.
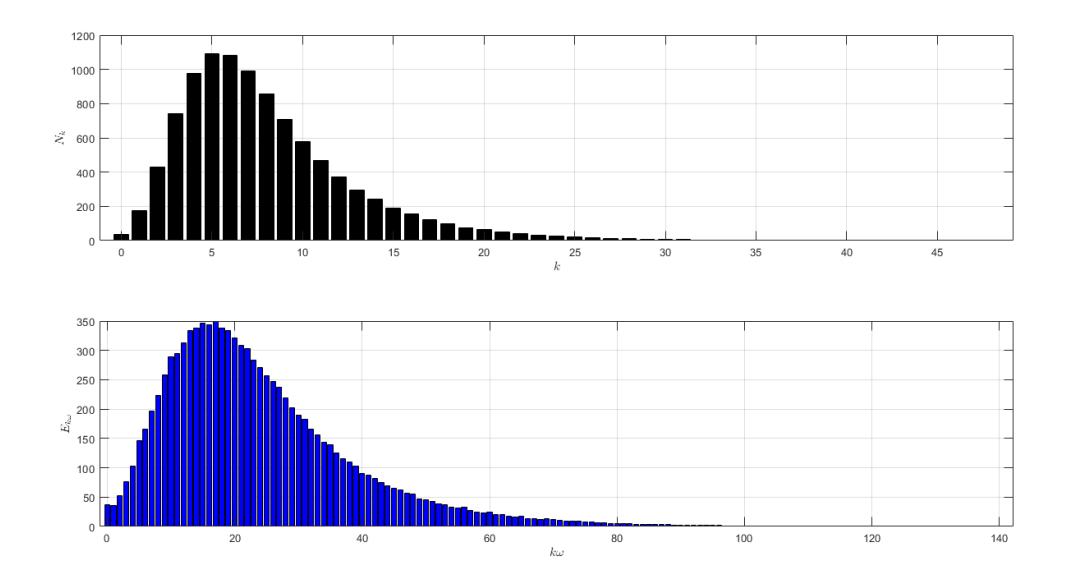
Figure 2: The network structure with k¯ = 8 and ω = 5. The black histogram shows the degree distribution of the network. It shows that the network has a lot of hubs and fewer isolated nodes. Hubs are the nodes who have degree 14 and more. The isolated nodes are the nodes with degree 0. In this network, we have in average 1200 hubs and 35 isolated nodes. The larger portion is dominated by the nodes who have degree 4 − 10. The blue histogram shows the distribution of contact intensity. It is the distribution of all contact an individual can do for each time.
3.1. Vaccination by choosing individuals randomly
For the first case of vaccination scenario 1, we set ρ = 0.5 and tv = 15. We choose randomly 5, 000 individuals to receive the vaccine dose 1, which is administered 15 days after the epidemic starts. At time t = 15, the total susceptible individuals are 9, 967. Figure 3 and 4 show the comparison between the epidemic process without vaccination and the one with the vaccination. After δv = 90 days, vaccine dose 2 is administered to those individuals who received vaccine dose 1 and are still susceptible. There are 3, 738 such individuals. Figure 3 (above) shows us that the multiple waves of epidemics are caused by the emergence of new infections due to external factors and the recovered unvaccinated individuals can go back to the susceptible state. Figure 4 (above) shows us the significant impact of vaccination in curbing the epidemic. The vaccination also delays the spike in daily cases. Table 2 displays the detailed results of this case. The individuals who get infection more than once are those who do not receive the vaccine.
Table 2: The number of infected individuals for case 1 of vaccination scenario 1.
| Infection frequency | No Vaccine | Vaccine |
|---|---|---|
| 1 | 560 | 2,387 |
| 2 | 1,721 | 1,442 |
| 3 | 7,267 | 924 |
| 4 | 251 | 1 |
For the second case of vaccination scenario 1, we set ρ = 0.5 and tv = 30. We still choose randomly 5, 000 individuals to receive the vaccine dose 1, but it is administered 30 days after the epidemic starts. In this case, vaccine dose 1 is administered slightly later than in previous case. We can see that at time t = 30, the total susceptible individuals are 8, 943. This lateness also gives an increase to the total number of infected
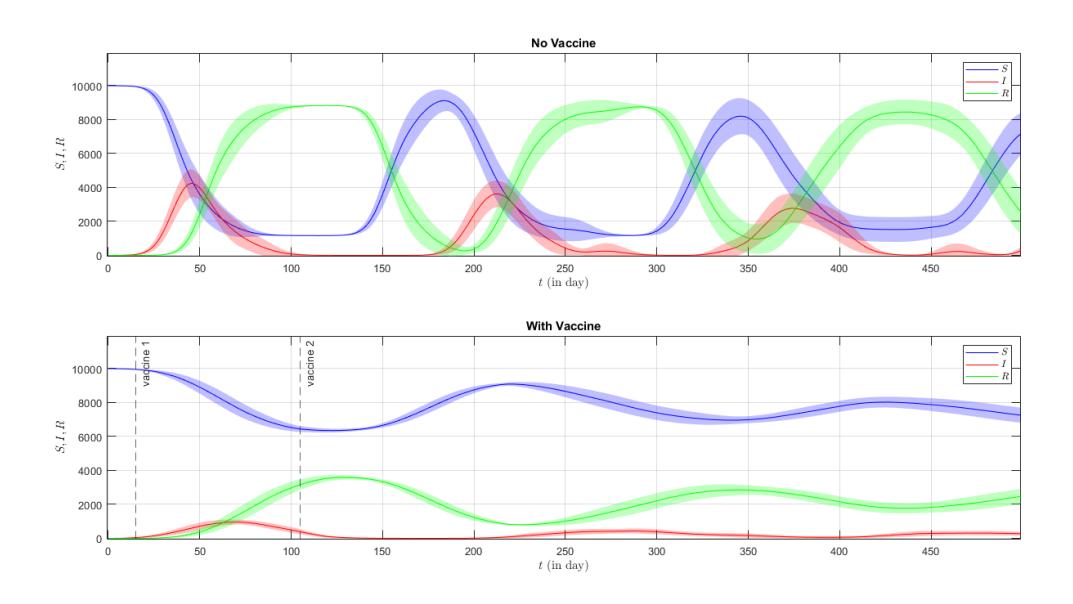
Figure 3: The time evolution of all states with 90% confidence interval for the epidemic process without vaccination (above) and the one with the vaccination (below).
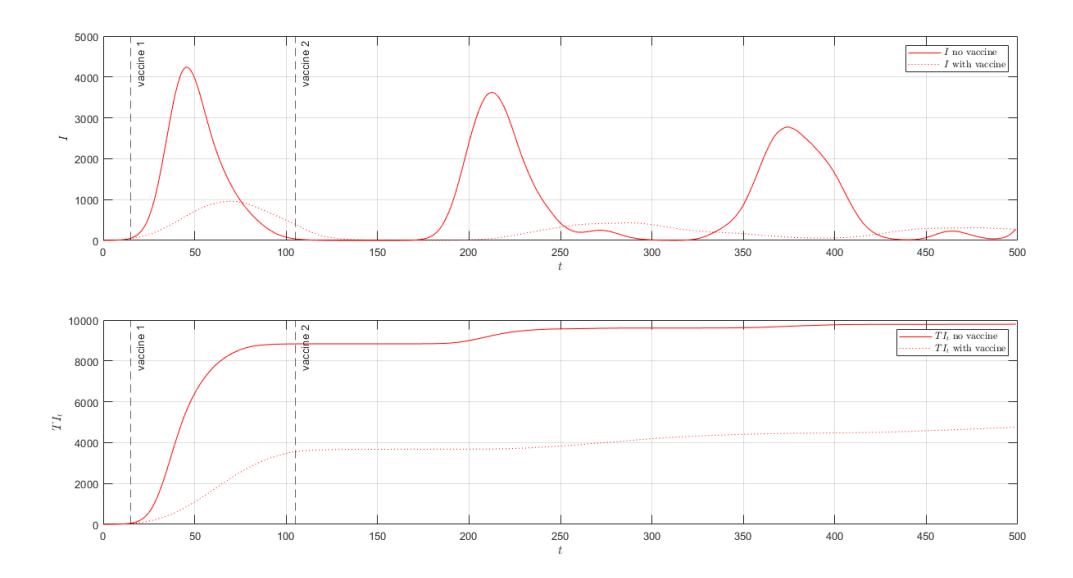
Figure 4: The average of 100 infection plots (above) and the total number of infections (below) for both epidemic processes. There are 9, 798 infected individuals in total when no vaccine is administered and there are 4, 752 infected individuals in total when two vaccine doses are completely administered.
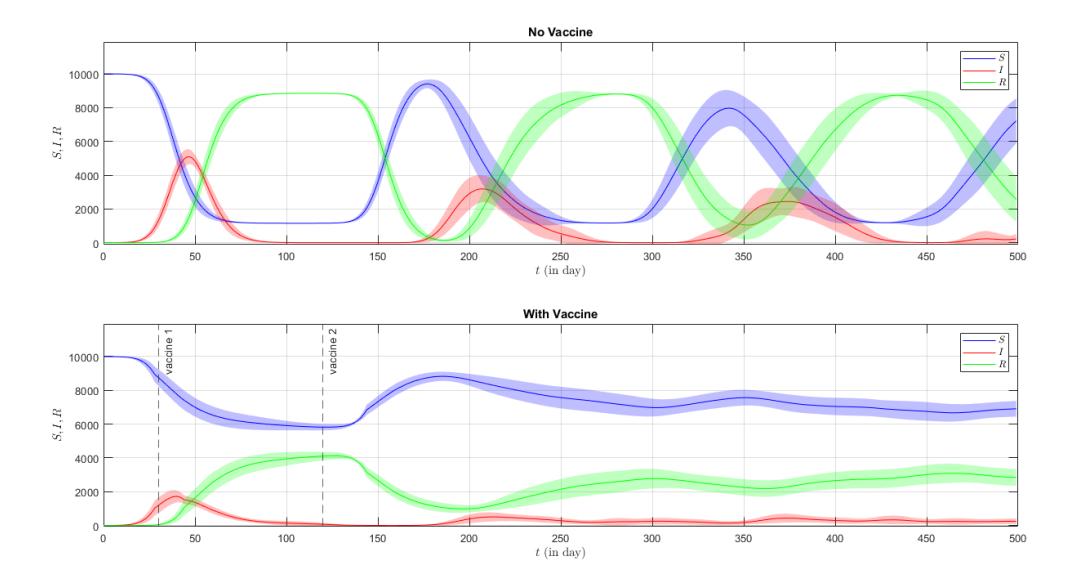
Figure 5: The time evolution of all states with 90% confidence interval for the epidemic process without vaccination (above) and the one with the vaccination (below).
individuals. After δv = 90 days, the remaining vaccinated individuals and still susceptible are 3, 703. The dynamic of this case is shown in Figure 5 and 6. Figure 6 (above) shows that vaccination with a slight delay prolongs the incidence of daily cases even though it is quite significant in suppressing the epidemic. The detailed results is shown in Table 3. We can see that the number of individuals who get infections three times in this case is much more than in the previous case.
Table 3: The number of infected individuals for case 2 of vaccination scenario 1.
| Infection frequency | No Vaccine | Vaccine |
|---|---|---|
| 1 | 546 | 2,247 |
| 2 | 1,712 | 1,369 |
| 3 | 7,125 | 1,646 |
| 4 | 424 | 2 |
Now, we consider the third case of the vaccination scenario 1 when we set ρ = 0.75 and tv = 15. In this case, we choose randomly 7, 500 individuals to receive the vaccine dose 1 at time t = 15. There are more individuals who will be vaccinated in this case. At the time, the susceptible individuals are 9, 970. After δv = 90 days, vaccine dose 2 are administered to those vaccinated and still susceptible individuals. There are 7, 351 such individuals. Figure 7 and 8 shows us the comparison between the dynamics of the epidemic process without vaccination and the one with vaccination. We can see in Figure 8 (above) that vaccination has successfully suppressed the epidemic for a long time with a small number of total infections as shown in Figure 8 (below). We can see the detailed results in Table 4.
In the last case of vaccination scenario 1, we still set ρ = 0.75 but the vaccine dose 1 is administered at tv = 30, which means slightly later than in previous case. In this case, we choose randomly 7, 500 individuals to receive the vaccine dose 1 at time t = 30. At the time, the susceptible individuals are 9, 224. After δv = 90 days, vaccine dose 2 are administered to those vaccinated and still susceptible individuals. There are 6, 907 such individuals. This number is less than the one in the third case. Figure 9 and 10 shows us the comparison
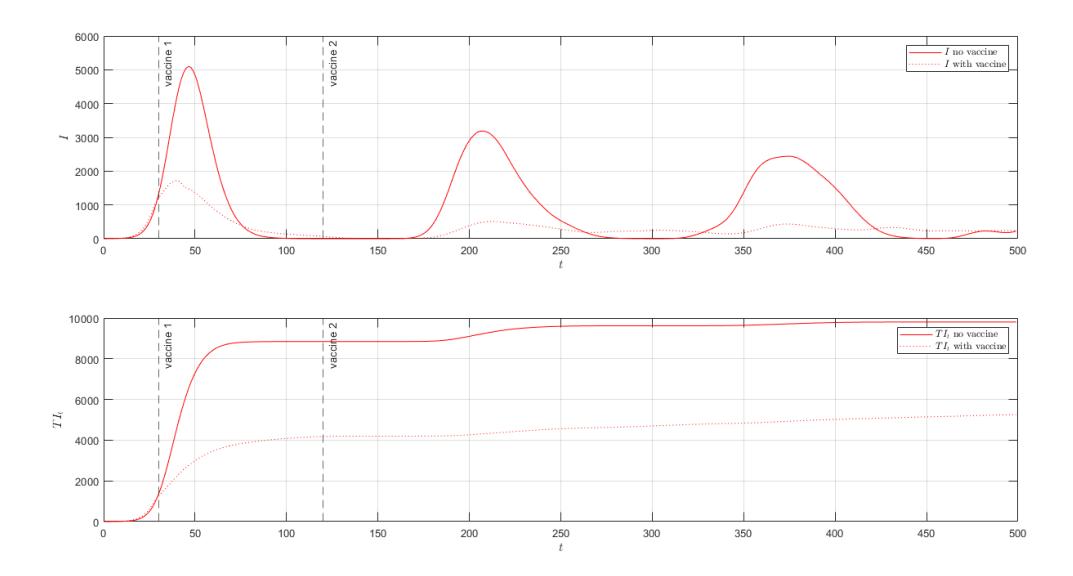
Figure 6: The average of 100 infection plots (above) and the total number of infections (below) for both epidemic processes. There are 9, 806 infected individuals in total when no vaccine is administered and there are 5, 262 infected individuals in total when two vaccine doses are completely administered.
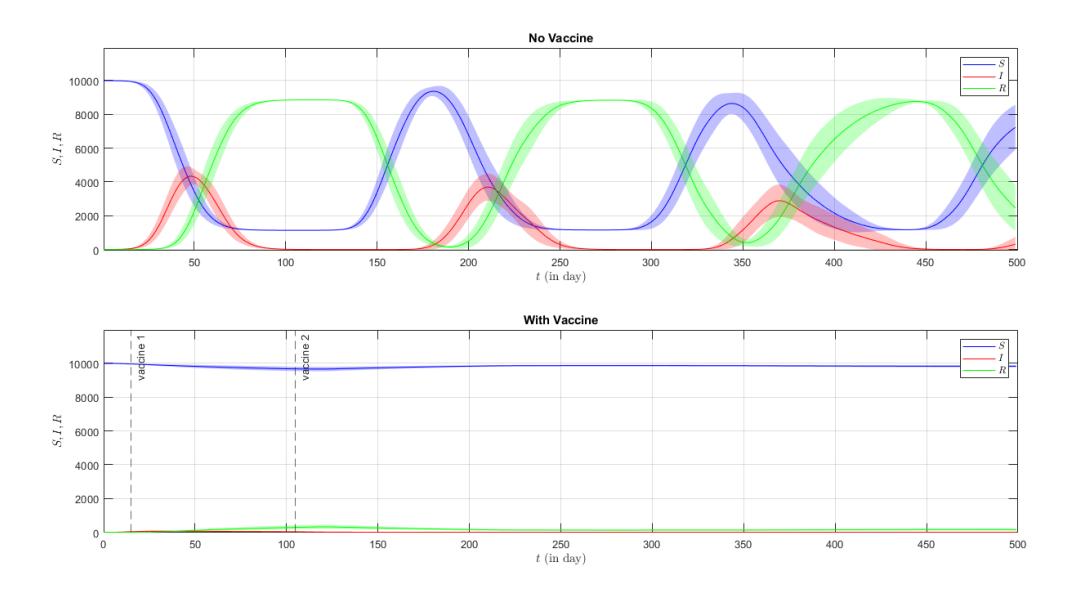
Figure 7: The time evolution of all states with 90% confidence interval for the epidemic process without vaccination (above) and the one with the vaccination (below).
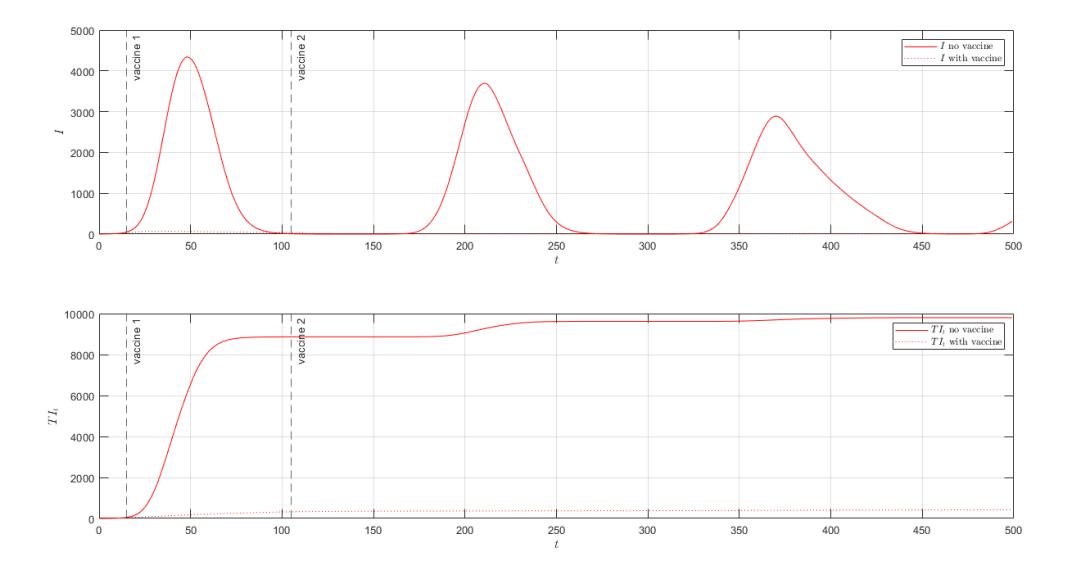
Figure 8: The average of 100 infection plots (above) and the total number of infections (below) for both epidemic processes. There are 9, 801 infected individuals in total when no vaccine is administered and there are 424 infected individuals in total when two vaccine doses are completely administered.
Table 4: The number of infected individuals for case 3 of vaccination scenario 1.
| Infection frequency | No Vaccine | Vaccine |
|---|---|---|
| 1 | 549 | 399 |
| 2 | 1,703 | 26 |
| 3 | 7,258 | 1 |
| 4 | 293 | 0 |
between the dynamics of the epidemic process without vaccination and the one with vaccination. We can see in Figure 10 (above) that even though the vaccination has successfully suppressed the epidemic for the time ahead, at the early time of vaccination, there is still a spike in daily cases. The total number of infected individuals also increases than the previous case as shown in Figure 10 (below). We can see the detailed results in Table 5. More individuals get infections more than once. It shows us that delaying vaccination has significant impacts in increasing the number of infections.
Table 5: The number of infected individuals for case 4 of vaccination scenario 1.
| Infection frequency | No Vaccine | Vaccine |
|---|---|---|
| 1 | 553 | 1,178 |
| 2 | 1,708 | 492 |
| 3 | 7,191 | 268 |
| 4 | 352 | 1 |
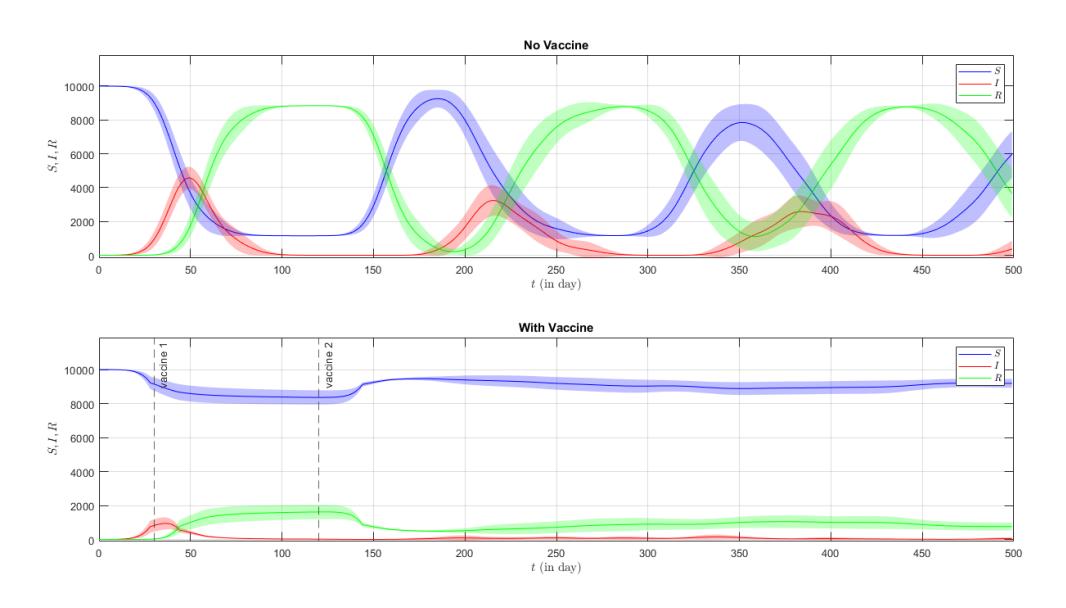
Figure 9: The time evolution of all states with 90% confidence interval for the epidemic process without vaccination (above) and the one with the vaccination (below).
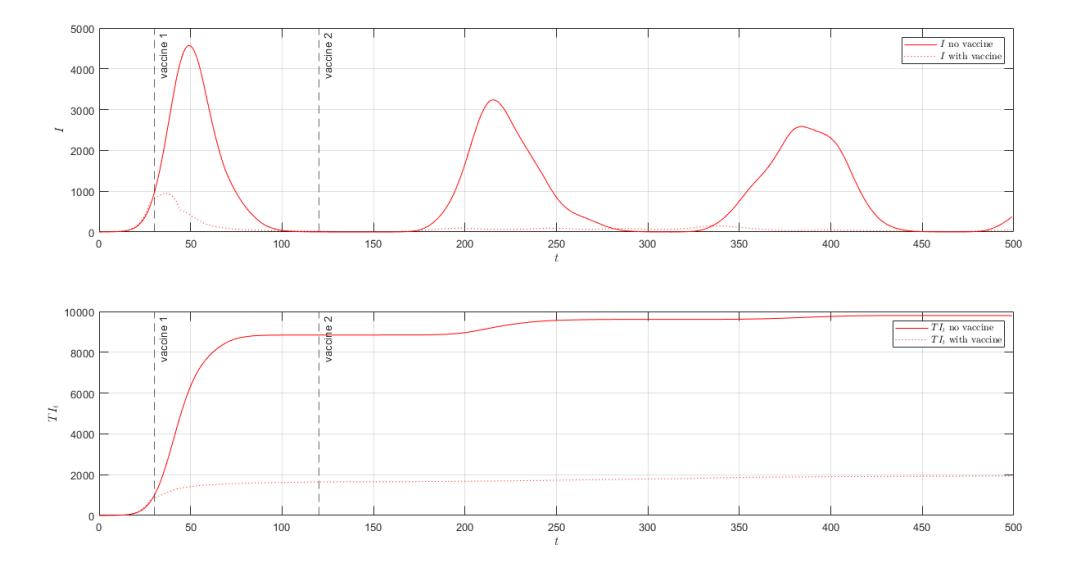
Figure 10: The average of 100 infection plots (above) and the total number of infections (below) for both epidemic processes. There are 9, 801 infected individuals in total when no vaccine is administered and there are 1, 938 infected individuals in total when two vaccine doses are completely administered.
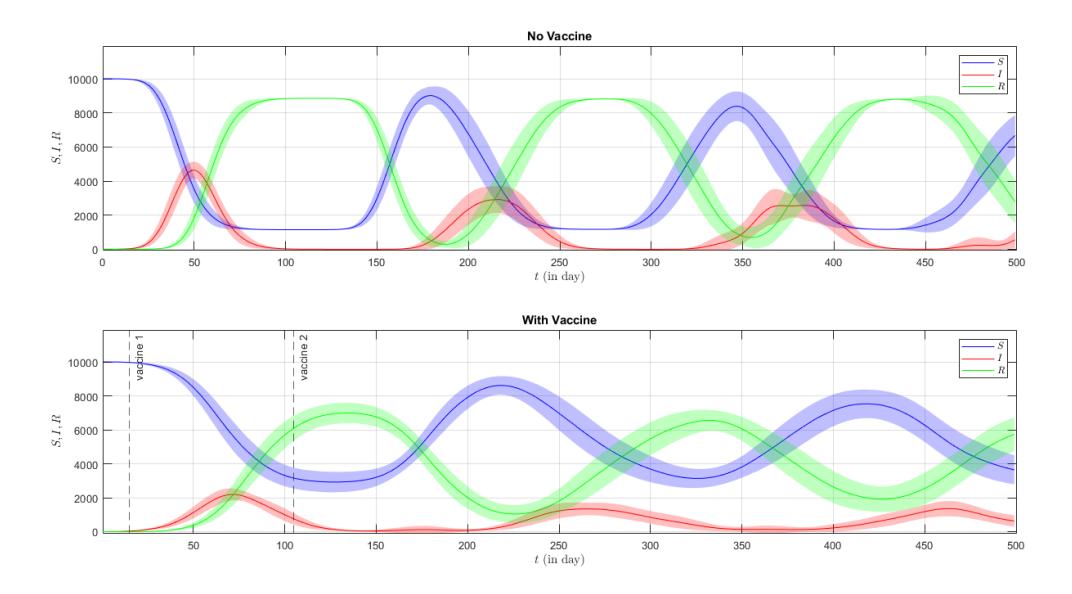
Figure 11: The time evolution of all states with 90% confidence interval for the epidemic process without vaccination (above) and the one with the vaccination (below).
3.2. Vaccination by targeting hubs
Now, we turn to the first case of vaccination scenario 2. There are about 1, 200 hubs at the initial time. When vaccine dose 1 is administered at time t = 15, the number of hubs at the time is 1, 194. After δv = 90 days, vaccine dose 2 are administered to those vaccinated hubs and still susceptible. The number of remaining hubs at the time is 704. The comparison between the epidemic process without vaccination and the with vaccination is shown in Figure 11 and 12. We can see that there is no big difference in results between the epidemic with vaccination and the one without vaccination. Instead of suppressing the epidemic, the vaccination strategy in this case just prolongs the emergence of daily cases as shown in Figure 11. In addition, the vaccination just delays the outbreak with the peaks being much lower than the epidemic without vaccination as shown in Figure 12 (above). It is also shown qualitatively in Figure 12 (below) that there is no big difference in the total number of infected individuals between the epidemic process without vaccination and the one with vaccination. The detailed results are shown in Table 6.
Table 6: The number of infected individuals for case 1 of vaccination scenario 2.
| Infection frequency | No Vaccine | Vaccine |
|---|---|---|
| 1 | 537 | 2,011 |
| 2 | 1,668 | 3,004 |
| 3 | 6,865 | 4,064 |
| 4 | 740 | 2 |
In the second case of the vaccination scenario 2, we start to administer the vaccine dose 1 to all hubs in the network at time t = 30. There are 956 hubs at the time. After δv = 90 days, vaccine dose 2 are administered to those vaccinated hubs and who are still susceptible. The number of remaining hubs at the time is 483. This number is much smaller than the associated one in the previous case. It shows us qualitatively that this vaccination strategy does not impact the pandemic. The comparison between the epidemic process without vaccination and the with vaccination is shown in Figure 13 and 14. It is almost similar to the results we
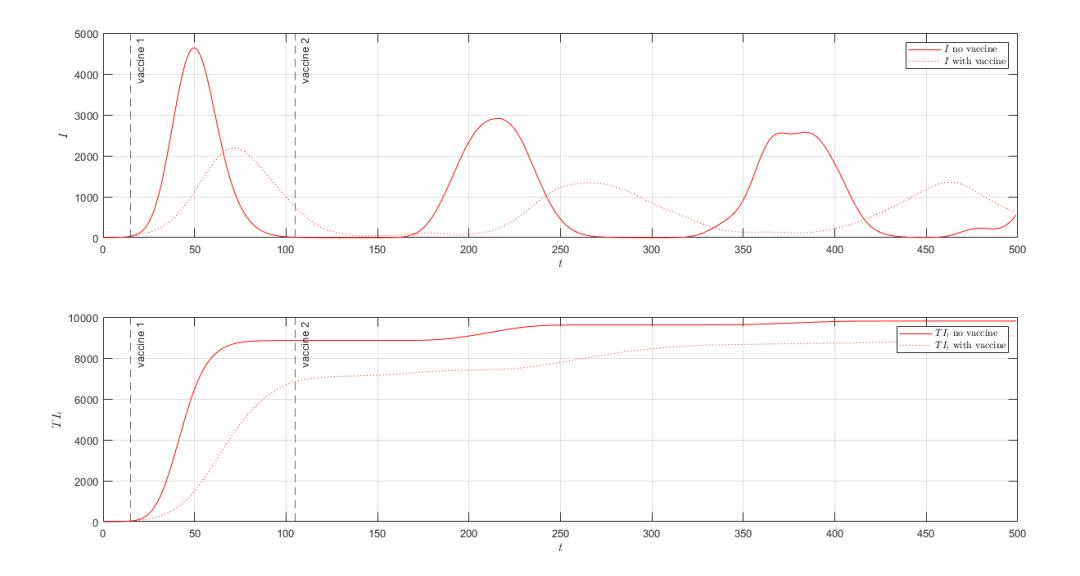
Figure 12: The average of 100 infection plots (above) and the total number of infections (below) for both epidemic processes. There are 9, 808 infected individuals in total when no vaccine is administered and there are 9, 079 infected individuals in total when two vaccine doses are completely administered.
obtained in the previous case in that there is no big difference between the epidemic with vaccination and the one without vaccination. Figure 13 shows us that the dynamics are almost similar. The vaccination just decreases slightly the peaks of daily cases and flattens the graphs to make it last longer as shown in Figure 14 (above). The vaccination also delays the outbreak with the peaks being much lower. Figure 14 (below) shows that the total number of infected individuals in the epidemic process without vaccination is almost equal to the one with the vaccination. The detailed results are shown in Table 7.
Table 7: The number of infected individuals for case 2 of vaccination scenario 2.
| Infection frequency | No Vaccine | Vaccine |
|---|---|---|
| 1 | 536 | 1,653 |
| 2 | 1,656 | 2,475 |
| 3 | 6,787 | 5,197 |
| 4 | 830 | 22 |
Two former cases show us that characterizing the hubs is an important step in implementing the vaccination scenario 2. Choosing individuals who have a degree 14 or more affects the vaccination coverage. There are only a small number of individuals who can be vaccinated with such a characterization of hubs. As a result, too many individuals who become agents to spread the disease to the entire population and make the vaccination strategy useless. Now, we adjust our characterization of hubs to be a node that has a degree 10 or more, and draw two cases again. We will show that the vaccination scenario 2 with the right characterization of hubs will provide a better vaccination strategy in suppressing the epidemic. Now, for the third case of the vaccination scenario 2, there are about 2, 917 hubs at the initial time. When we start to administer the vaccine dose 1 at time t = 15, the remaining hubs are 2, 899. After δv = 90 days, vaccine dose 2 are administered to those vaccinated hubs and who are still susceptible. The number of such hubs at this time is 2, 776. We can say that this vaccination strategy is the most effective so far due to the total number of infected individuals,
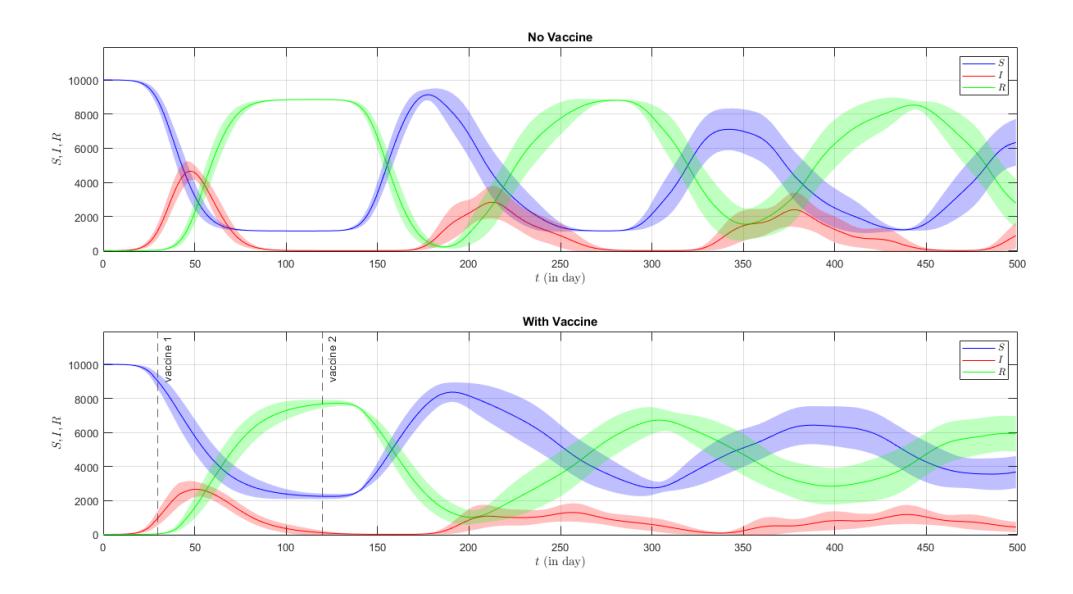
Figure 13: The time evolution of all states with 90% confidence interval for the epidemic process without vaccination (above) and the one with the vaccination (below).
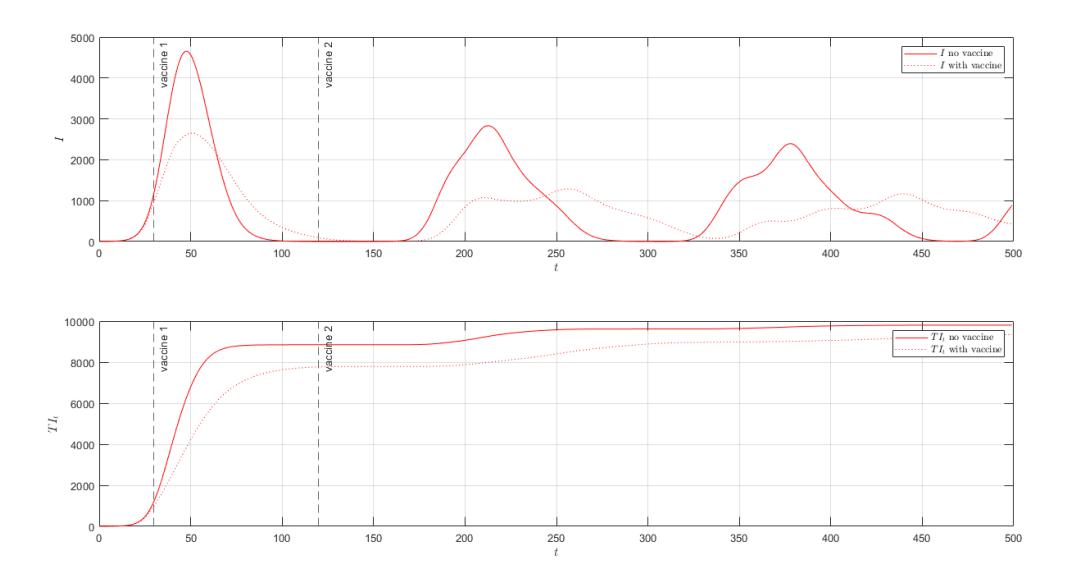
Figure 14: The average of 100 infection plots (above) and the total number of infections (below) for both epidemic processes. There are 9, 808 infected individuals in total when no vaccine is administered and there are 9, 348 infected individuals in total when two vaccine doses are completely administered.
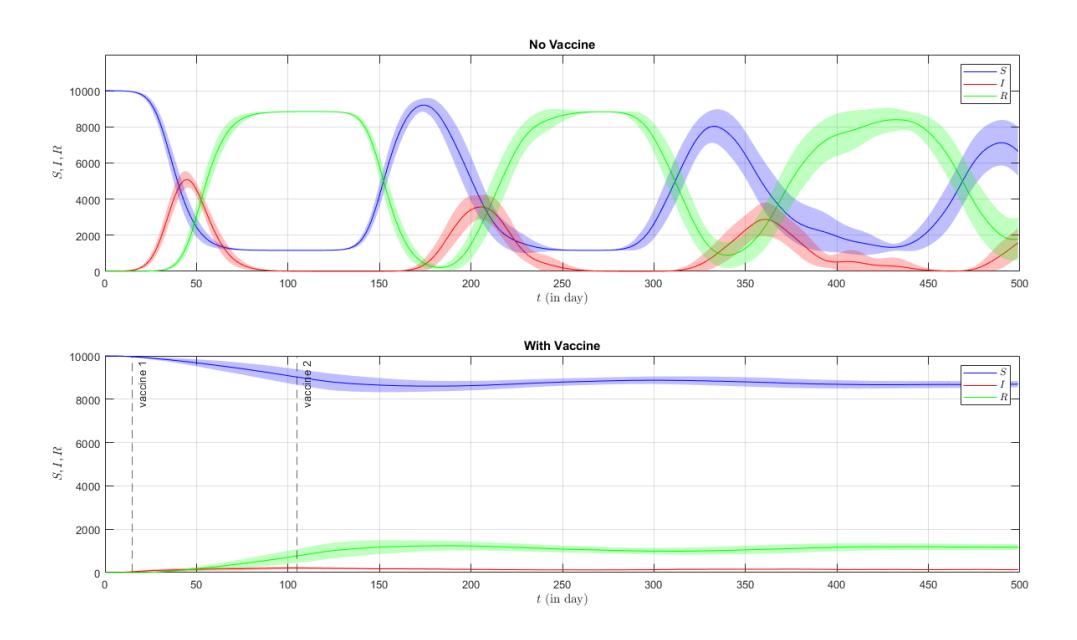
Figure 15: The time evolution of all states with 90% confidence interval for the epidemic process without vaccination (above) and the one with the vaccination (below).
in this case, is the smallest one. The comparison between the epidemic process without vaccination and the with vaccination is shown in Figure 15 and 16. Administering the vaccine to those hubs with a degree 10 and more, will cover more individuals with high connectivity to get vaccinated. Compared to the epidemic process without vaccination, the one with this kind of vaccination can effectively curb the epidemic as shown in Figure 16 (above). Despite the total of infected individuals in this case increasing, the increase is very slow as shown in Figure 16 (below). The detailed results are shown in Table 8.
Table 8: The number of infected individuals for case 3 of vaccination scenario 2.
| Infection frequency | No Vaccine | Vaccine |
|---|---|---|
| 1 | 518 | 2,786 |
| 2 | 1,549 | 792 |
| 3 | 6,021 | 80 |
| 4 | 1,722 | 1 |
In the fourth case of the vaccination scenario 2, we want to see the impact of the delay of administering the vaccine. At the initial time, there are about 2, 920 hubs. When we start to administer the vaccine dose 1 at time t = 30, the remaining hubs are 2, 446. It is smaller than previous case. After δv = 90 days, vaccine dose 2 are administered to those vaccinated hubs and who are still susceptible. The number of such hubs at this time is 1, 868. Now, we can see that this vaccination strategy is not effective enough to curb the epidemic as shown in Figure 17 and 18. Compared to the two first cases of vaccination scenario 1, this kind of vaccination results in the total number of infected individuals higher. The detailed results are shown in Table 9.
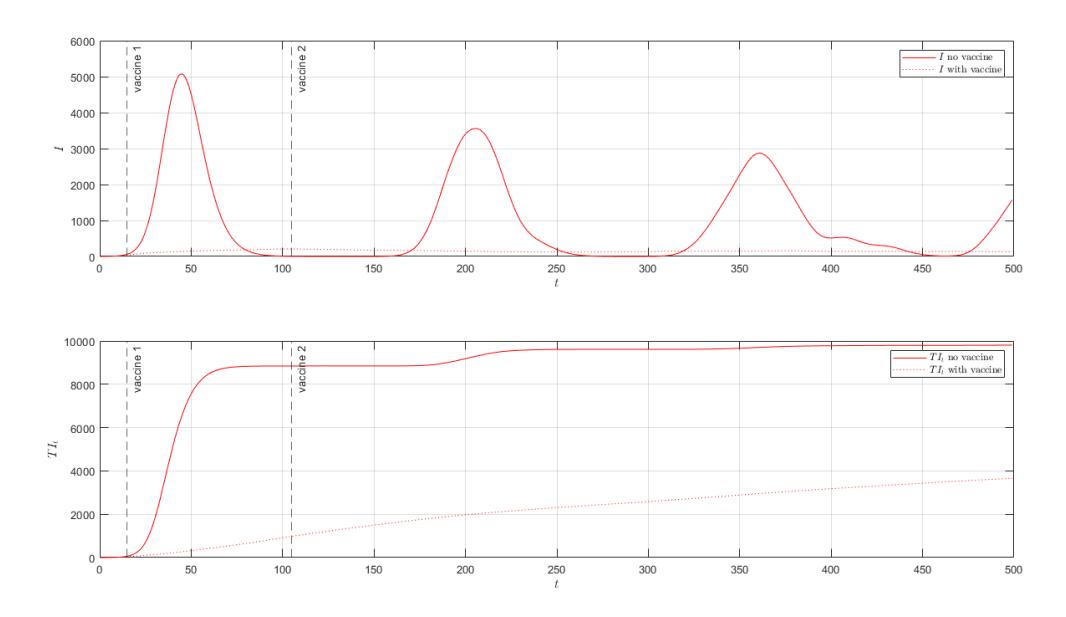
Figure 16: The average of 100 infection plots (above) and the total number of infections (below) for both epidemic processes. There are 9, 810 infected individuals in total when no vaccine is administered and there are 3, 660 infected individuals in total when two vaccine doses are completely administered.
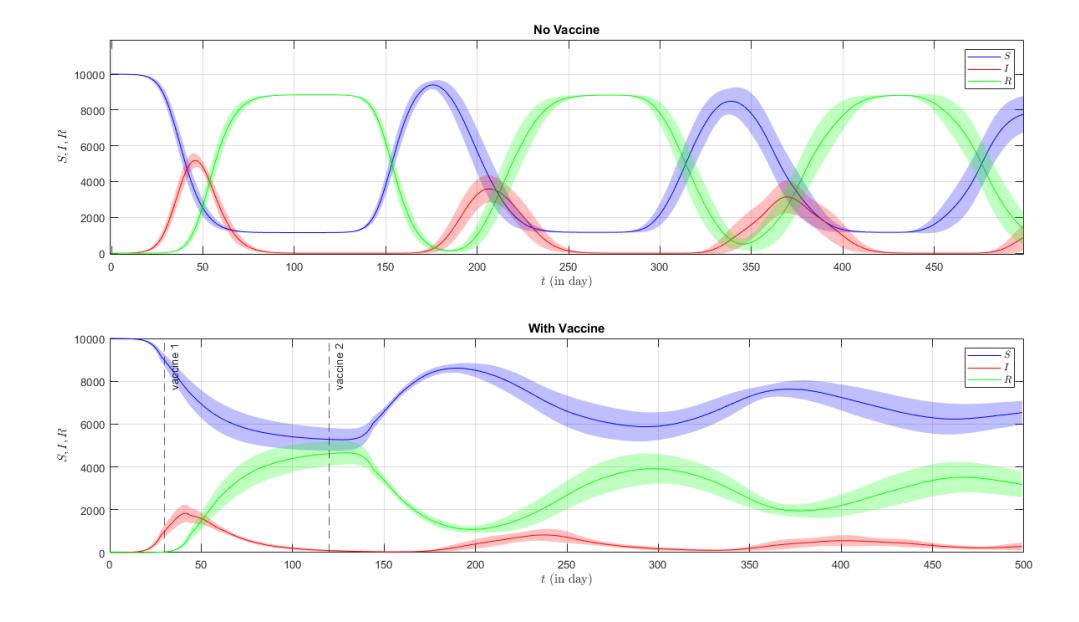
Figure 17: The time evolution of all states with 90% confidence interval for the epidemic process without vaccination (above) and the one with the vaccination (below).
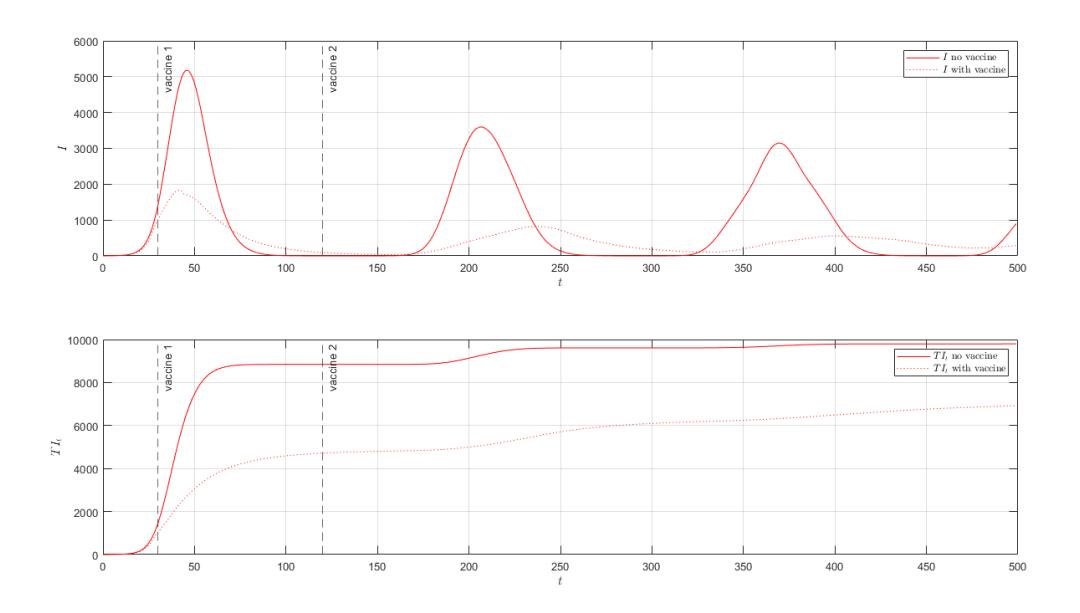
Figure 18: The average of 100 infection plots (above) and the total number of infections (below) for both epidemic processes. There are 9, 801 infected individuals in total when no vaccine is administered and there are 6, 926 infected individuals in total when two vaccine doses are completely administered.
Table 9: The number of infected individuals for case 3 of vaccination scenario 2.
| Infection frequency | No Vaccine | Vaccine |
|---|---|---|
| 1 | 540 | 3,018 |
| 2 | 1,660 | 2,175 |
| 3 | 6,747 | 1,675 |
| 4 | 854 | 58 |
4. CONCLUSION AND DISCUSSION
As mentioned earlier, the effectiveness of vaccination strategies heavily relies on the contact dynamics among individuals within a population, which directly influences the spread of diseases. Targeting vaccination towards individuals with high connectivity and interaction intensity not only proves to be the most efficient strategy in controlling epidemics but also requires vaccinating fewer individuals. This approach can be particularly valuable for countries with limited vaccine access. However, a key challenge with this strategy lies in determining the optimal timing for vaccine administration concerning the onset of the epidemic. Delaying vaccination increases the risk of disease spread instead of containing it.
Our research demonstrates that the most effective vaccination strategy, which focuses on re-characterized hubs, covers fewer individuals and results in the smallest total number of infected individuals. Nonetheless, this strategy is only effective when implemented early in the epidemic.
This paper primarily focuses on implementing vaccination strategies in a population without any containment measures. However, integrating the most effective vaccination strategy identified here with containment measures such as self-quarantine, mask usage, or physical distancing can significantly enhance our ability to mitigate and control epidemics, as explored in previous studies [31]. By utilizing the developed model, we can assess how various containment measures influence epidemic control by adjusting parameters like average degree and interaction intensity range. Moreover, optimizing strategies involving factors such as the gap time between doses and vaccine efficacy falls beyond the scope of this paper.
In conclusion, our model yields comprehensive computational results and stands as one of the most realistic epidemiological models by incorporating various interventions.
ACKNOWLEDGEMENT
This work was supported by Riset PFR Dikti under Grant Number 255/IT1.B07.1/SPP-LPPM/VI/2024.