

1. INTRODUCTION
Dengue fever is a viral infection spread mainly by the bites of Aedes mosquitoes infected with the dengue virus (DENV) [1]. The emergence and widespread prevalence of dengue fever (DF) impose a significant strain on healthcare systems and economies, particularly in tropical areas where the disease is endemic [2]. Dengue cases have surged globally in recent decades, reaching its highest reported number of cases in 2019 [3]. The resurgence of dengue can be attributed to various factors, including population growth in urban areas, insufficient education about dengue vectors, increased air travel, and ineffective mosquito control measures[4].
Vector control continues to be the leading method employed for alleviating the spread of dengue as efficient dengue vaccines are currently lacking [5]. The World Health Organization (WHO) advocates for integrated dengue control strategies such as targeted residual spraying, controlling mosquito larvae, and personal protective measures [3]. However, with reported resistance to all four classes of insecticides in Aedes arbovirus vectors, non-insecticide-dependent methods are gaining significance [6], [7]. Consequently, vector control management needs to adopt an integrated approach that combines environmental management with personal protective measures to achieve sustainable results with minimal environmental impact. Active community engagement in waste management, particularly in eliminating potential vector breeding sites like
*Corresponding author
Received January 15th, 2025, Revised May 31st, 2025, Accepted for publication June 26th, 2025. Copyright ©2025 Published by Indonesian Biomathematical Society, e-ISSN: 2549-2896, DOI:10.5614/cbms.2025.8.1.7
outdoor solid waste, remains a crucial factor in achieving effective and sustainable dengue prevention and control [8]. Empowering community residents through activities focused on reducing larval and pupal sources can significantly contribute to alleviating the burden of dengue fever [9].
Human behavior is a critical factor in the spread of infectious diseases [10], and understanding its influence is vital for enhancing control efforts [11], [12]. Recent studies highlight the significance of integrating human behavioral changes into mathematical models of infectious disease transmission [13], [14]. Adaptive behaviors in response to perceived or actual risks of infection can lead to significant reductions in disease incidence and prevalence [15]. In dengue outbreaks, positive human behavioral changes often focus on adopting selfprotective and vector control measures [16]. Self-protective measures involve preventing mosquito bites by using mosquito repellents, window screens, bed nets, and wearing long-sleeved clothing [3]. Conversely, vector control includes eliminating mosquito breeding sites, chemical spray, and treated bed net.
The dynamics of dengue transmission are complex, involving interactions between human and Aedes mosquito populations [17], [18], [19]. Mathematical models are essential tools for understanding and quantifying the effects of control interventions and various factors influencing disease transmission [20]. Several models have been developed to provide insights into the spread and control of dengue and some authors emphasized the role of human behavior for the control of dengue [17], [18], [21], [22], [23], [24]. The authors in [21] proposed a mathematical model that captures the impact of community ignorance on the spread of dengue [21]. To effectively control dengue, the researchers suggested that media campaigns aimed at raising public awareness should be combined with other control measures. A dengue model was introduced in [25] to evaluate how media awareness can influence the spread of dengue in the community. They found that consistent media efforts and rapid spread of awareness could potentially eliminate the disease from the community entirely. A two-strain dengue model by [26] explores the dynamics of primary and secondary infections with two DENV serotypes, indicating that controlling mosquito populations and raising human awareness are crucial for effective dengue control. Additionally, an optimal control problem incorporating human awareness and vector control has been introduced in [16], with simulations suggesting that enhancing awareness on self-protection and mosquito control measures are necessary to prevent DENV transmission. Cost-effectiveness analysis of different strategies, such as combining media campaigns with fumigation, has also been explored in [18], identifying this combination as the most effective in preventing a significant rise in infected individuals. However, these models often do not account for human behavioral changes, which can play a crucial role in influencing disease dynamics and the effectiveness of control interventions [11], [13], [14].
In this paper, we develop a mathematical model of dengue transmission that explicitly incorporates adaptive human behavior in response to the community infection levels. These behavioral changes include the adoption of existing control measures aimed at reducing mosquito contact and population. The parameters in the model were estimated by fitting the model to the daily dengue cases in Kaohsiung City, Taiwan during the 2015 dengue outbreak. We also perform a sensitivity analysis to determine which parameters should be prioritized for effectively controlling future dengue outbreaks.
2. MODEL FORMULATION
The dengue transmission model to be developed in this study is based on subdividing the total human population at time t, represented by Nh(t), into compartments based on the Susceptible-Infected-Recovered framework and the level of adherence to dengue control measures. Specifically, the population is divided into the compartments of non-adherent and adherent susceptible (Sh1(t) and Sh2(t)), non-adherent and adherent infected (Ih1(t) and Ih2(t)), and non-adherent and adherent recovered (Rh1 and Rh2(t)) individuals, so that
\[N_h(t) = N_{h1}(t) + N_{h2}(t), (1)\] where
\[N_{h1}(t) = S_{h1}(t) + I_{h1}(t) + R_{h1}(t)\] (2)
and
\[N_{h2}(t) = S_{h2}(t) + I_{h2}(t) + R_{h2}(t)\] (3)
are the total populations of non-adherent and adherent individuals, respectively. Adherent individuals are those who strictly implement self-protective and vector control measures for dengue, while non-adherent individuals do not. Similarly, the total mosquito population at time t, denoted by \(N_v(t)\), is split into susceptible \((S_v(t))\) and infected \((I_v(t))\) mosquitoes, so that
\[N_v(t) = S_v(t) + I_v(t). \tag{4}\]
The equations for the model are given below (see Table 1 and Table 2 for descriptions of state variables and parameters, respectively.)
\[\frac{dS_{h1}}{dt} = (1 - \rho_h)\Pi_h - \alpha S_{h1} - \lambda_h S_{h1} - \mu_h S_{h1}, \frac{dS_{h2}}{dt} = \rho_h \Pi_h + \alpha S_{h1} - (1 - \varepsilon)\lambda_h S_{h2} - \mu_h S_{h2}, \frac{dI_{h1}}{dt} = \lambda_h S_{h1} - \alpha I_{h1} - \gamma_1 I_{h1} - \mu_h I_{h1}, \frac{dI_{h2}}{dt} = (1 - \varepsilon)\lambda_h S_{h2} + \alpha I_{h1} - \gamma_2 I_{h2} - \mu_h I_{h2}, \frac{dR_{h1}}{dt} = \gamma_1 I_{h1} - \alpha R_{h1} - \mu_h R_{h1}, \frac{dR_{h2}}{dt} = \gamma_2 I_{h2} + \alpha R_{h1} - \mu_h R_{h2}, \frac{dS_v}{dt} = \Pi_v - \lambda_v S_v - (\mu_v + \delta_v) S_v, \frac{dI_v}{dt} = \lambda_v S_v - (\mu_v + \delta_v) I_v.\] (5)
This system is constrained by these initial conditions
\[S_{h1}(0) = S_{h10} \ge 0, S_{h2}(0) = S_{h20} \ge 0, I_{h1}(0) = I_{h10} \ge 0,\] \[I_{h2}(0) = I_{h20} \ge 0, R_{h1}(0) = R_{h10} \ge 0, R_{h2}(0) = R_{h20} \ge 0,\] \[S_{v}(0) = S_{v0} \ge 0, I_{v}(0) = I_{v0} \ge 0.\] (6)
In the model (5), we define \(\Pi_h\) as the rate at which individuals are recruited into the population through birth or immigration, assuming that all newly recruited individuals are initially susceptible. Furthermore, we assume that a proportion, \(\rho_h\), of these newly recruited individuals naturally adhere to the adoption of self-protective and vector control measures for dengue. All individuals in the epidemiological compartments experience natural mortality at a rate of \(\mu_h\).
Non-adherent individuals are assumed to undergo a positive behavioral shift towards adhering to mitigation measures for dengue at a rate \(\alpha(t)\), influenced by the community infection levels. This behavior component of the model (5) is inspired by the approach and formulation in [13]. The rate \(\alpha(t)\) is determined by three factors: the maximum behavioral change among non-adherent individuals due to community infection levels \((\tilde{\alpha})\), the probability of influencing non-adherent individuals based on community infection levels \((\tau_h)\) and the relative infection levels in the community. The relative infection level is modeled using a Holling Type-II saturation incidence function \(\left(\frac{I_{h1}(t)+I_{h2}(t)}{K+I_{h1}(t)+I_{h2}(t)}\right)\), where K>0 represents the half saturation constant of infected cases. This behavioral change is expressed as:
\[\alpha(t) = \tilde{\alpha}\tau_h \left( \frac{I_{h1}(t) + I_{h2}(t)}{K + I_{h1}(t) + I_{h2}(t)} \right). \tag{7}\]
On contrary, it is assumed that adherent individuals will maintain their behavior regardless of the number of susceptible and recovered population.
When a dengue-infected mosquito bites susceptible non-adherent individuals, it is likely to transmit dengue at a rate \(\lambda_h\), expressed as
\[\lambda_h = \frac{\beta b_{vh} I_v}{N_h},\tag{8}\] where β and bvh are the average daily biting rate of female mosquitoes and the transmission probability of humans acquiring dengue from the bites of infectious adult female mosquitoes, respectively. On the other hand, adherent individuals acquire infection at a reduced rate (1 − ε)λh, where ε is the efficacy of selfprotective measures in reducing contact with mosquitoes. Infected adherent and non-adherent individuals are assumed to recover at rates γ1 and γ2, respectively.
For the mosquito population, we let Πv as the recruitment rate of mosquitoes and assume that all recruited mosquitoes are susceptible. When a susceptible mosquito bites infected non-adherent and adherent individuals, it is likely to acquire dengue at rates, λv1 and λv2 respectively. These rates are given by:
\[\lambda_{v1} = \frac{\beta b_{hv} I_{h1}}{N_h},\] \[\lambda_{v2} = \frac{(1 - \varepsilon)\beta b_{hv} I_{h2}}{N_h},\] \[\lambda_{v} = \lambda_{v1} + \lambda_{v2}.\] (9)
Here, bhv represents the probability of mosquitoes acquiring dengue through the bites of infected individuals. Both susceptible and infected mosquitoes experience a natural death rate of µv and an induced death rate of δv(t) due to public health interventions implemented by adherent individuals. This induced death rate is given by:
\[\delta_v(t) = \tilde{\delta_v} \tau_v \left( \frac{N_{h2}(t)}{N_h(t)} \right), \tag{10}\] where ˜δv represents the maximum induced death rate of mosquitoes due to the actions of adherent individuals, while τv is the probability that mosquitoes will die as a result of the vector control measures implemented by adherent individuals.
The flow diagram of dengue model (5) is depicted in Figure 1, and is constructed based on the following assumptions:
- 1) Non-adherent individuals positively change behavior due to community infection levels.
- 2) Adherent individuals maintain their behavior regardless of the current disease prevalence and adopt both self-protective and vector control measures.
- 3) There is only one circulating dengue virus serotype, and individuals develop permanent immunity after recovery.
- 4) The recovery rate is identical for both infected non-adherent and adherent individuals.
- 5) All infected individuals progress the same stages of infection.
- 6) Human and vector populations are homogeneous, respectively.
Table 1: Description of the variables in the model.
| Variables | Description |
|---|---|
| Sh1 | Susceptible non-adherent human population |
| Sh2 | Susceptible adherent human population |
| Ih1 | Infectious non-adherent human population |
| Ih2 | Infectious adherent human population |
| Rh1 | Recovered non-adherent human population |
| Rh2 | Recovered adherent human population |
| Sv | Susceptible mosquito population |
| Iv | Infectious mosquito population |
| Nh | Total human population |
| Nv | Total mosquito population |
The model (5) is an extension of numerous dengue transmission models by:
- 1) Incorporating a human behavioral change function into the disease dynamics based on infection levels.
- 2) Adding an induced mosquito death rate function to the disease dynamics based on the proportion of adherent individuals in the community.
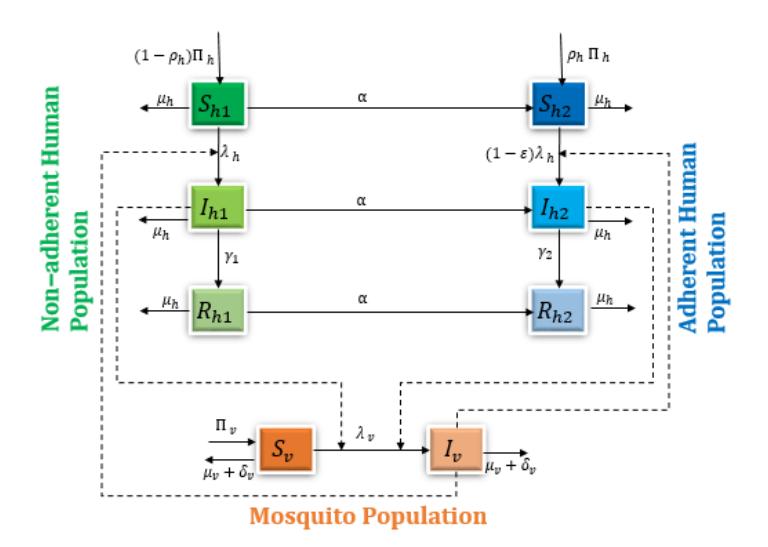
Figure 1: Schematic diagram of dengue transmission dynamics with human behavioral changes in response to community infection levels.
Table 2: Description of the parameters in the model.
| Parameters | Description | |
|---|---|---|
| Πh | Recruitment rate of susceptible human population | |
| µh | Natural death rate of humans | |
| ρh | Proportion of newly recruited adherent humans | |
| α(t) | Transition rate from non-adherent humans to adherent at time t | |
| τh | Probability of influence of non-adherent humans due to the level of infected cases | |
| α˜ | Maximum rate of behavioral change of non-adherent humans due to the level of infected cases | |
| λh(t) | Rate of force infection to humans | |
| bvh | Transmission probability of humans contracting dengue from infectious mosquitoes | |
| β | Biting rate of mosquitoes | |
| Πv | Recruitment rate of susceptible mosquito population | |
| ε | Efficacy of self-protective measures | |
| γ1 | Recovery rate of non-adherent humans | |
| γ2 | Recovery rate of adherent humans | |
| λv(t) | Rate of force infection to mosquitoes | |
| bhv | Probability of a mosquito contracting dengue from infectious humans | |
| µv | Natural death rate of mosquitoes | |
| δv(t) | Induced death rate of mosquitoes due to actions of adherent humans at time t | |
| δ˜v | Maximum induced death rate of mosquitoes due to actions of adherent humans | |
| τv | Probability that mosquitoes will die due to actions implemented by adherent humans | |
| K | Half saturation constant | |
3. MODEL ANALYSIS
In this section, we explore some important properties of the dengue model (5), including invariant regions, positivity of the solution, stability analysis of equilibrium points, and the calculation of the basic reproduction number.
3.1. Invariant region and positivity of solution
Consider the feasible region Ω = Ωh × Ωv ⊂ R 6 + × R 2 +, with
\[\Omega_h = \{ (S_{h1}, S_{h2}, I_{h1}, I_{h2}, R_{h1}, R_{h2}) \in \mathbb{R}_+^6 : N_h \le \frac{\Pi_h}{\mu_h} \}, \tag{11}\]
\[\Omega_v = \{ (S_v, I_v) \in \mathbb{R}^2_+ : N_v \le \frac{\Pi_v}{\mu_v} \}.\] (12)
We have the following results for this feasible region.
Theorem 3.1. The region \(\Omega = \Omega_h \times \Omega_v \subset \mathbb{R}^6_+ \times \mathbb{R}^2_+\) is positively invariant for the system (5) with non-negative initial conditions as given in (6).
Proof: The summation of the mosquitoes and human populations of system (5) leads to
\[\frac{dN_h}{dt} = \Pi_h - \mu_h N_h,\] \[\frac{dN_v}{dt} = \Pi_v - (\delta_v + \mu_v) N_v \le \Pi_v - \mu_v N_v.\] (13)
\[\frac{dN_v}{dt} = \Pi_v - (\delta_v + \mu_v)N_v \le \Pi_v - \mu_v N_v. \tag{14}\]
Solving equations (13) and (14) for \(N_h\) and \(N_v\) yields the system bounded by \(N_h \leq \frac{\Pi_h}{\mu_h}\) and \(N_v \leq \frac{\Pi_v}{\mu_v}\). Consequently, all feasible solutions of the system (5) enter the region
\[\Omega = \{ (S_{h1}, S_{h2}, I_{h1}, I_{h2}, R_{h1}, R_{h2}, S_v, I_v) \in \mathbb{R}_+^8 : N_h \le \frac{\Pi_h}{\mu_h}, N_v \le \frac{\Pi_v}{\mu_v} \}.\] (15)
The next result shows that all solutions of the system (5) remain non-negative for all time t > 0.
Theorem 3.2. Let the system (5) be subject to non-negative initial conditions. Then, the solution set
\[(S_{h1}(t), S_{h2}(t), I_{h1}(t), I_{h2}(t), R_{h1}(t), R_{h2}(t), S_v(t), I_v(t))\]
remains non-negative for all t > 0.
Proof: To show that the system (5) has non-negative solutions for all t > 0, we will establish only the positivity of \(S_{h1}(t)\). The positivity of the other state variables can be derived in a similar approach.
Suppose the initial conditions of the system are non-negative. Now, from (5), the following inequality holds:
\[\frac{dS_{h1}}{dt} \ge -(\lambda_h + \mu_h)S_{h1}.\tag{16}\]
Using the method of integrating factor, (16) becomes
\[\frac{d}{dt}\left(S_{h1}(t)\exp\left\{\int_0^t \lambda(u)du + \mu_h t\right\}\right) \ge 0. \tag{17}\]
Hence,
\[S_{h1}(t) \ge S_{h1}(0) \exp\left\{-\left(\int_0^t \lambda(u)du + \mu_h t\right)\right\} > 0\] (18)
for each t > 0.
Theorems 3.1 and 3.2 show that the system (5) is well posed and biologically meaningful.
3.2. Disease free equilibrium and basic reproduction number
Disease Free Equilibrium (DFE): This is the state solution where the population is free from dengue infections, which is denoted as \(E_0^*\). To determine the \(E_0^*\), we let
\[E_0^* = (S_{h10}^*, S_{h20}^*, I_{h10}^*, I_{h20}^*, R_{h10}^*, R_{h20}^*, S_{v0}^*, I_{v0}^*). \tag{19}\]
At equilibrium state, the derivatives in the system (5) are equal to zero, that is
\[\frac{dS_{h1}}{dt} = \frac{dS_{h2}}{dt} = \frac{dI_{h1}}{dt} = \frac{dI_{h2}}{dt} = \frac{dR_{h1}}{dt} = \frac{dR_{h2}}{dt} = \frac{dS_v}{dt} = \frac{dI_v}{dt} = 0.\] (20)
This condition transforms the system (5) into
\[(1 - \rho_h)\Pi_h - \alpha S_{h10}^* - \lambda_h S_{h10}^* - \mu_h S_{h10}^* = 0,\] \[\rho_h \Pi_h + \alpha S_{h10}^* - (1 - \varepsilon)\lambda_h S_{h20}^* - \mu_h S_{h20}^* = 0,\] \[\lambda_h S_{h10}^* - \alpha I_{h10}^* - \gamma_1 I_{h10}^* - \mu_h I_{h10}^* = 0,\] \[(1 - \varepsilon)\lambda_h S_{h20}^* + \alpha I_{h10}^* - \gamma_2 I_{h20}^* - \mu_h I_{h20}^* = 0,\] \[\gamma_1 I_{h10}^* - \alpha R_{h10}^* - \mu_h R_{h10}^* = 0,\] \[\gamma_2 I_{h20}^* + \alpha R_{h10}^* - \mu_h R_{h20}^* = 0,\] \[\Pi_v - \lambda_v S_{v0}^* - \delta_v S_{v0}^* - \mu_v S_{v0}^* = 0,\] \[\lambda_v S_{v0}^* - \delta_v I_{v0}^* - \mu_v I_{v0}^* = 0.\] \[(21)\]
Now, in the absence of dengue infections, we set \(I_{h10}^* = I_{h20}^* = I_{v0}^* = 0\). Solving for the state variables in (21), we obtained
\[E_0^* = (S_{h10}^*, S_{h20}^*, I_{h10}^*, I_{h20}^*, R_{h10}^*, R_{h20}^*, S_{v0}^*, I_{v0}^*)\] \[= \left(\frac{(1 - \rho_h)\Pi_h}{\mu_h}, \frac{\rho_h\Pi_h}{\mu_h}, 0, 0, 0, 0, \frac{\Pi_v}{\tilde{\delta}_v \tau_v \rho_h + \mu_v}, 0\right), \tag{22}\]
where \(N_{h0}^* = S_{h10}^* + S_{h20}^*\). The following result follows directly from (22).
Theorem 3.3. The system (5) has a disease-free equilibrium, \(E_0^*\) which always exists.
To evaluate the stability of the disease-free equilibrium \(E_0^*\), we first compute the dengue basic reproduction number, denoted as \(\mathcal{R}_0\).
Basic Reproduction Number \((\mathcal{R}_0)\): This is a threshold measure that quantifies the expected number of secondary infections generated by a single infectious individual in a fully susceptible population. In the context of this study, \(\mathcal{R}_0\) signifies the number of secondary dengue infections resulting from either the infected host \((I_{h1} \text{ and } I_{h2})\) or the infected vector \((I_v)\). We use the next generation matrix (NGM), \(\mathbf{G} = \mathbf{F}\mathbf{V}^{-1}\) as described in [27], to compute \(\mathcal{R}_0\) by evaluating the dominant eigenvalue of the matrix \(\mathbf{G}\). Here, \(\mathbf{F}\) and \(\mathbf{V}\) represent the Jacobian matrices related to the emergence of new infections \((\mathcal{F})\) and the movement of individuals \((\mathcal{V})\) between the infected compartments, respectively.
In the system (5), the infected classes are \(I_{h1}\), \(I_{h2}\), \(I_v\). Hence the following equations can be rewritten as
\[\frac{d}{dt} \begin{bmatrix} I_{h1} \\ I_{h2} \\ I_v \end{bmatrix} = \begin{bmatrix} \lambda_h S_{h1} \\ (1 - \varepsilon) \lambda_h S_{h2} \\ \lambda_v S_v \end{bmatrix} - \begin{bmatrix} (\alpha + \gamma_1 + \mu_h) I_{h1} \\ (\gamma_2 + \mu_h) I_{h2} - \alpha I_{h1} \\ (\delta_v + \mu_v) I_v \end{bmatrix} = \mathcal{F} - \mathcal{V},\] (23)
where
\[\mathcal{F} = \begin{bmatrix} \lambda_h S_{h1} \\ (1 - \varepsilon) \lambda_h S_{h2} \\ \lambda_v S_v \end{bmatrix}, \tag{24}\]
\[\mathcal{V} = \begin{bmatrix} (\alpha + \gamma_1 + \mu_h)I_{h1} \\ (\gamma_2 + \mu_h)I_{h2} - \alpha I_{h1} \\ (\delta_v + \mu_v)I_v \end{bmatrix}. \tag{25}\]
Applying the linearization technique to these matrices \(\mathcal{F}\) and \(\mathcal{V}\) evaluated at \(E_0^*\), we obtain the following Jacobian matrices of \(\mathcal{F}\) and \(\mathcal{V}\):
\[\mathbf{F} = \begin{bmatrix} 0 & 0 & \psi_{h1} \\ 0 & 0 & \psi_{h2} \\ \psi_{v1} & \psi_{v2} & 0 \end{bmatrix},\tag{26}\]
\[\mathbf{V} = \begin{bmatrix} \psi_{h3} & 0 & 0 \\ 0 & \psi_{h4} & 0 \\ 0 & 0 & \psi_{v3} \end{bmatrix}, \tag{27}\] where
\[\psi_{h1} = \beta b_{vh} (1 - \rho_h), \psi_{h2} = (1 - \varepsilon) \beta b_{vh} \rho_h, \psi_{v1} = \frac{\mu_h \beta b_{hv} \Pi_v}{\Pi_h (\tilde{\delta}_v \tau_v \rho_h + \mu_v)}, \psi_{v2} = \frac{(1 - \varepsilon) \mu_h \beta b_{hv} \Pi_v}{\Pi_h (\tilde{\delta}_v \tau_v \rho_h + \mu_v)}, \psi_{h3} = \gamma_1 + \mu_h, \psi_{h4} = \gamma_2 + \mu_h, \psi_{v3} = \tilde{\delta}_v \tau_v \rho_h + \mu_v.\] (28)
Evaluating the \(V^{-1}\), we have
\[\mathbf{V}^{-1} = \begin{bmatrix} \frac{1}{\psi_{h3}} & 0 & 0\\ 0 & \frac{1}{\psi_{h4}} & 0\\ 0 & 0 & \frac{1}{\psi_{h2}} \end{bmatrix}. \tag{29}\]
Now, evaluating the next generation matrix G, we obtained
\[\mathbf{G} = \mathbf{F} \mathbf{V}^{-1} = \begin{bmatrix} 0 & 0 & \frac{\psi_{h1}}{\psi_{v3}} \\ 0 & 0 & \frac{\psi_{h2}}{\psi_{v3}} \\ \frac{\psi_{v1}}{\psi_{h3}} & \frac{\psi_{v2}}{\psi_{h4}} & 0 \end{bmatrix}.\](30)
Next, we need to determine the largest eigenvalue, \(\lambda\), of the matrix G. Evaluating the \(\lambda\) of matrix G, we obtained three eigenvalues:
\[\lambda_{1} = 0,\] \[\lambda_{2} = -\sqrt{\frac{\psi_{v1}\psi_{h1}\psi_{h4} + \psi_{v2}\psi_{h2}\psi_{h3}}{\psi_{h3}\psi_{h4}\psi_{v3}}},\] \[\lambda_{3} = \sqrt{\frac{\psi_{v1}\psi_{h1}\psi_{h4} + \psi_{v2}\psi_{h2}\psi_{h3}}{\psi_{h3}\psi_{h4}\psi_{v3}}}.\] (31)
Choosing the dominant \(\lambda\), we have
\[\mathcal{R}_0 = \sqrt{\mathcal{R}_N + \mathcal{R}_A},\tag{32}\] where
\[\mathcal{R}_N = \frac{\psi_{v1}\psi_{h1}}{\psi_{h3}\psi_{v3}},\tag{33}\]
\[\mathcal{R}_A = \frac{\psi_{v2}\psi_{h2}}{\psi_{h4}\psi_{v3}}.\tag{34}\]
In summary, we have
\[\text{[rumus tidak dapat ditampilkan dengan baik — lihat PDF asli]}\] (35)
The basic reproduction number, \(\mathcal{R}_0\) as defined in equation (32), can be decomposed into two distinct components. The first component, \(\mathcal{R}_N\), represents the infection dynamics within the subpopulation \(N_{h1}\). Conversely, the second component, \(\mathcal{R}_A\) characterizes the infection dynamics within the subpopulation \(N_{h2}\). It is noteworthy that the basic reproduction number \(\mathcal{R}_0\) is directly influenced by key epidemiological and entomological parameters, specifically the mosquito biting rate \((\beta)\), the transmission probabilities from vector
to host \((b_{vh})\) and host to vector \((b_{hv})\), and the recruitment rate of the susceptible mosquito population \((\Pi_v)\). These parameters appear in the numerator of the expression for \(R_0\), signifying their pivotal role in amplifying transmission potential. An increase in any of these parameters leads to a proportional escalation in the reproduction number, thereby increasing the likelihood of outbreak persistence. To further quantify the impact of each parameter on \(R_0\), a detailed sensitivity analysis is presented in Subsection 3.6. This analysis elucidates the relative influence of each parameter, providing critical insights into effective targets for vector control and disease mitigation strategies.
The next result shows the stability analysis of DFE, \(E_0^*\).
Theorem 3.4. The disease-free equilibrium \(E_0^*\) of the system (5) is locally asymptotically stable if \(R_0 < 1\), otherwise it is unstable.
Proof: To investigate the local stability of the DFE at \(E_0^*\), we derive the following Jacobian Matrix of the system (5),
\[J(E_0^*) = \begin{bmatrix} -\mu_h & 0 & 0 & 0 & 0 & 0 & 0 & -\psi_{h1} \\ 0 & -\mu_h & 0 & 0 & 0 & 0 & 0 & -\psi_{h2} \\ 0 & 0 & -\psi_{h3} & 0 & 0 & 0 & 0 & \psi_{h1} \\ 0 & 0 & 0 & -\psi_{h4} & 0 & 0 & 0 & \psi_{h2} \\ 0 & 0 & \gamma_1 & 0 & -\mu_h & 0 & 0 & 0 \\ 0 & 0 & 0 & \gamma_2 & 0 & -\mu_h & 0 & 0 \\ 0 & 0 & -\psi_{v1} & -\psi_{v2} & 0 & 0 & -\psi_{v3} & 0 \\ 0 & 0 & 0 & \psi_{v1} & \psi_{v2} & 0 & 0 & 0 & -\psi_{v3} \end{bmatrix}.\] \[(36)\]
Clearly, the first two eigenvalues of the Jacobian matrix \(J(E_0^*)\), namely \(\lambda_1 = -\mu_h\) (multiplicity of 4), and \(\lambda_2 = -\psi_{v3}\) are all negative. To achieve a disease-free state, all the remaining eigenvalues must be negative. The remaining three eigenvalues can be obtained by considering this submatrix
\[J(E_0^1) = \begin{bmatrix} -\psi_{h3} & 0 & \psi_{h1} \\ 0 & -\psi_{h4} & \psi_{h2} \\ \psi_{v1} & \psi_{v2} & -\psi_{v3} \end{bmatrix}.\] (37)
From (37), the characteristic equations is given by
\[f(\lambda) = c_3 \lambda^3 + c_2 \lambda^2 + c_1 \lambda + c_0, \tag{38}\]
where
\[c_{3} = 1,\] \[c_{2} = \psi_{h3} + \psi_{h4} + \psi_{v2},\] \[c_{1} = \psi_{h3}\psi_{h4} + \psi_{h3}\psi_{v3} + \psi_{h4}\psi_{v3} - \mathcal{R}_{N}\psi_{h3}\psi_{v3} - \mathcal{R}_{A}\psi_{h4}\psi_{v3},\] \[c_{0} = \psi_{h3}\psi_{h4}\psi_{v3} - \mathcal{R}_{0}^{2}\psi_{h3}\psi_{h4}\psi_{v3}.\] (39)
Applying the Routh-Hurwitz criteria (RHC) as discussed by [28], the following conditions must be satisfied in (38): \(c_0 > 0\), \(c_1 > 0\), \(c_2 > 0\), and \(c_1 c_2 > c_0\). The coefficient \(c_2\) is always positive, while the coefficient \(c_1\) and \(c_0\) can be positive or negative. We found that if \(\mathcal{R}_0 < 1\), then both \(c_1\) and \(c_0\) are positive. From RHC, this implies that \(J(E_0^1)\) has negative real parts when \(\mathcal{R}_0 < 1\). Consequently, \(E_0^*\) is locally asymptotically stable if \(\mathcal{R}_0 < 1\).
3.3. Parameter estimation
In this subsection, we estimate the parameters of model (5) for dengue fever cases in Kaohsiung City, Taiwan, using Berkeley Madonna's Curve Fit function. This function employs the Nelder-Mead simplex algorithm to minimize the root mean square difference between data and model predictions, efficiently optimizing parameters without requiring derivatives, making it well-suited for nonlinear systems.
Taiwan experienced consecutive large dengue outbreaks during 2014-2015, primarily in Kaohsiung City [29]. A total of 19,784 cases were reported in Kaohsiung in 2015, marking a 31.5% increase from the previous year. The outbreak in Kaohsiung began in late July 2015, driven by the spread of DENV-2 [30]. Therefore, daily reports of dengue fever cases from the third week of July to December 2015, obtained from [31] as cited by [32], were used to estimate the following unknown parameters: \(\rho_h\), \(\tilde{\alpha}_{12}\tau_h\), \(b_{vh}\), \(\beta\), \(\varepsilon\), \(b_{hv}\), \(\tilde{\delta}_v\), \(\tau_v\), and K. The parameter \(\mu_h\) is calculated as the inverse of the life expectancy for 2015, which is obtained from
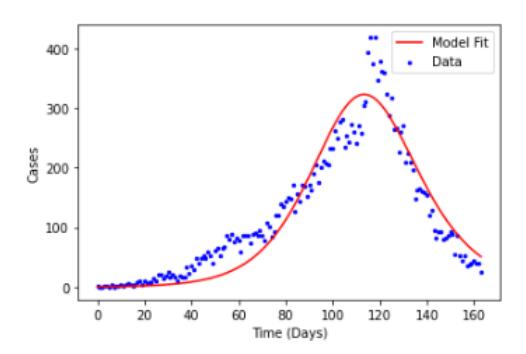
Figure 2: Model fitting with the data. Red solid line represents the Model solution and bullet points are the available data.
[33]. Meanwhile, Πh is estimated as the product of µh and the total human population (Nh) of Kaohsiung City, Taiwan, for the same year, as reported by [34]. The parameter Πv is estimated by multiplying µv with the total mosquito population (Nv), where Nv is assumed to be four times the total human population (Nh).
The model fit to the observed dengue fever data is presented in Figure 2, with the corresponding estimated parameter values listed in Table 3. Model performance was quantitatively evaluated using the Root Mean Squared Error (RMSE), which measures the average magnitude of the deviation between the observed data and model predictions. The calculated RMSE of 33.4 indicates a reasonable level of accuracy in capturing the outbreak dynamics. Given the scale and variability of the data, this error magnitude is acceptable and does not significantly affect the reliability of insights derived for decision-making purposes. Using the parameter values in Table 3, the basic reproduction number in Kaohsiung is R0 ≈ 1.42. This value suggests a relatively high potential for transmission, highlighting the importance of effective control measures to curb the spread of dengue in this region.
| Parameters | Value | Reference |
|---|---|---|
| Πh | 95 | Estimated from [34] |
| µh | 0.000034 | Estimated from [33] |
| ρh | 0.1 | Fitted |
| ατ˜ h | 0.11841 | Fitted |
| bvh | 0.39986 | Fitted |
| β | 0.501 | Fitted |
| Πv | 652596 | Assumed in view of [35] |
| ε | 0.45583 | Fitted |
| γ1 | 1/6 | [36] |
| γ2 | 1/6 | [36] |
| bhv | 0.10002 | Fitted |
| µv | 1/17 | [36] |
| δ˜vτv | 0.22116 | Fitted |
| K | 25000 | Fitted |
Table 3: Values of the parameters in the model.
3.4. Sensitivity analysis
In this section, we conduct a sensitivity analysis to evaluate how changes in the parameter values affect on the value of R0. Specifically, we compute the local sensitivity index of R0 concerning the parameter p. This index is defined as:
\[\mathcal{I}_p^{\mathcal{R}_0} = \frac{\partial \mathcal{R}_0}{\partial p} \times \frac{p}{\mathcal{R}_0}.\] (40)
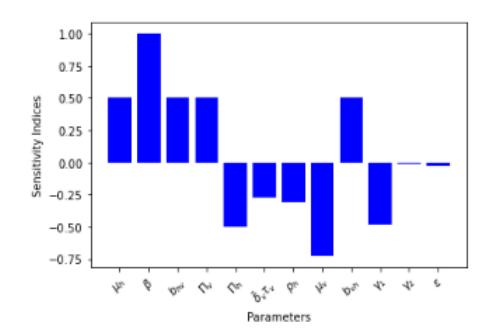
Figure 3: Sensitivity indices of R0.
When the sensitivity index exceeds zero, it implies that the output rises with an increase in the input, and conversely, it declines when the input decreases.
The results in (40) are visually depicted in Figure 3. The sensitivity analysis, based on the estimated values found in Table 3, reveals that the most sensitive parameters are β and µv, while the least sensitive is γ2. There are five parameters with positive indices, indicating that an increase in their values would raise the value of R0. These parameters include β, µh, bhv, bvh, and Πv. Conversely, the parameters µv, Πh, ˜δv, τv, γ1, γ2, ρh, and ε exhibit negative indices, suggesting that an increase in their values would lead to a reduction in R0.
Understanding the sensitivity of R0 to various parameters is crucial for developing effective dengue control strategies [20]. The analysis indicates that R0 is particularly sensitive to the biting rate (β) and the death rate of mosquitoes (µv). This high sensitivity underscores the importance of strategies aimed at reducing the mosquito-human contact rate and increasing efforts to lower the mosquito population. Measures such as the use of mosquito repellents, bed nets, and targeted insecticide spraying to reduce mosquito lifespan can significantly impact R0 and, consequently, the overall transmission dynamics of dengue. This enhanced focus on the most sensitive parameters, β and µv, provides a clear direction for public health interventions aimed at controlling and mitigating dengue outbreaks. Reducing the biting rate can be achieved through encouraging everyone to practice self-protective measures, while increasing the mosquito death rate can be accomplished through environmental management, chemical control, and biological control strategies. By prioritizing these areas, it is possible to achieve a substantial reduction in dengue transmission and improve public health outcomes.
4. NUMERICAL SIMULATION AND DISCUSSION
In this section, we perform numerical simulations of our model using the odeint function from the SciPy library, which utilized the LSODA algorithm. LSODA is an adaptive solver that dynamically switches between the non-stiff Adams method and the stiff backward differentiation formulas (BDF), enabling efficient and robust integration across both stiff and non-stiff regimes within the system. The numerical results obtained from odeint show excellent agreement with those generated by Berkeley Madonna, which uses a fixed-step fourth-order Runge-Kutta (RK4) method.
In the simulations, we explore the effects of varying parameter combinations, particularly those related to behavioral changes in response to community infection levels, on the transmission dynamics of dengue fever. We utilize the parameter values provided in Table 3 and consider different values for parameters associated with human behavioral changes. The initial conditions for the simulations are set as follows: Sh1 = 2, 634, 855, Sh2 = 138, 677, Ih1 = 1, Ih2 = 0, Rh1 = 0, Rh2 = 0, Sv = 11, 094, 129, and Iv = 3. These conditions assume that 5% of the total human population Nh consists of adherent individuals, and the total mosquito population is set to be four times larger than the total human population.
As a baseline, we first evaluate the model's numerical solution under the assumption of no positive behavioral change (when α = 0) in response to community infection levels. This baseline scenario is illustrated in Figure 4.
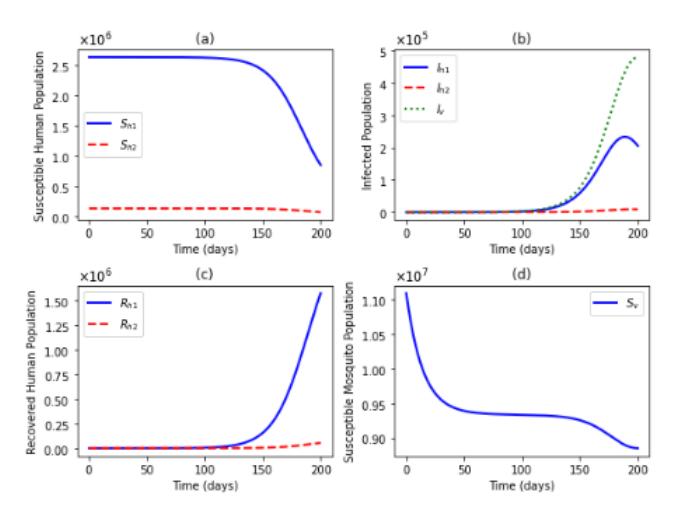
Figure 4: Numerical Solution of Model (5) in the Absence of Positive Behavioral Change (α = 0): (a) Susceptible human population, (b) Infected human and mosquito population, (c) Recovered human population, and (d) Susceptible Mosquito population
The present study is developed under the assumption that only a single dengue virus serotype is circulating in the population. Consequently, individuals who recover from infection are assumed to acquire lifelong immunity, and reinfection is not considered. Under this framework, the absence of reinfection prevents the establishment of an endemic equilibrium, as the susceptible population is progressively depleted over time. As a result, despite the basic reproduction number exceeding one (1), the infection eventually dies out due to the lack of replenishment of susceptibles. However, the model dynamics would fundamentally change if additional factors were introduced, such as continuous migration of infected individuals, external introduction of the virus, or the co-circulation of multiple dengue serotypes. In such scenarios, reinfection and partial immunity could sustain transmission, thereby enabling the existence of an endemic equilibrium. Exploring these complex dynamics represents a promising direction for future research.
4.1. Numerical solution of the model with positive behavioral changes
The numerical solution of the system (5) based on the parameter values in Table 3, as depicted in Figure 5, provides valuable insights into how positive behavioral changes influence the dynamics of dengue transmission during the 2015 dengue outbreak in Kaohsiung City, Taiwan. It is observed from Figure 5(a) and Figure 5(b) that as the infected population increases, the adherent population also increases and stabilizes when there are no infected cases. This observation aligns with the response to increasing dengue infection levels, where non-adherent individuals tend to adopt self-protective and vector control measures, as depicted in Figure 6. These measures include the utilization of mosquito repellents, bed nets, insecticides, wearing long sleeves, and active participation in community clean-up drives aimed at reducing mosquito breeding sites.
Furthermore, a decreasing trend in the susceptible mosquito population, as depicted in Figure 5(d), is associated with the concurrent increase in the adherent human population. These behavioral shifts effectively reduce contact rates and the mosquito population, consequently decreasing the overall number of infected cases over time. In contrast, the dynamics change significantly when positive behavioral changes are absent. As depicted in Figure 4, the lack of these behavioral adaptations leads to higher transmission rates and prolonged levels of infection, highlighting the essential role of proactive community measures in mitigating dengue outbreaks.
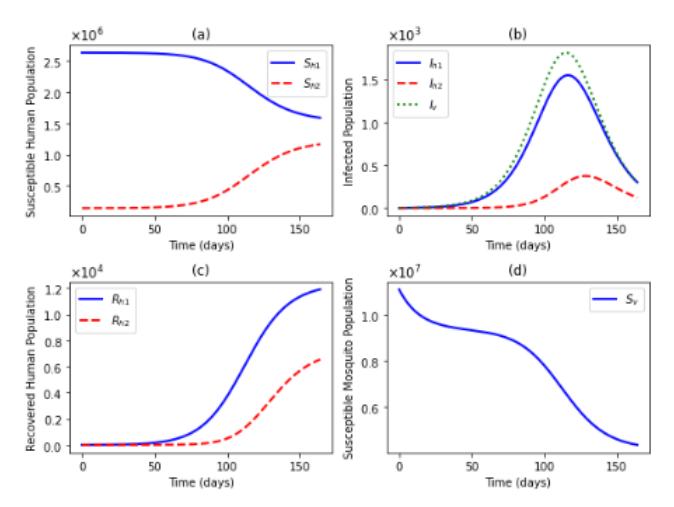
Figure 5: Numerical solution of Model (5) with positive behavioral change in response to community infection levels: (a) Susceptible human population, (b) Infected human and mosquito population, (c) Recovered human population, and (d) Susceptible mosquito population.
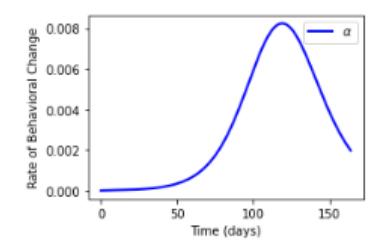
Figure 6: Effect of community infection levels on the rate of human behavioral changes.
4.2. Dengue reduction
Here, we examine the reduction of dengue cases under three distinct scenarios, each associated with positive changes in human behavior in response to infection levels: (1) adoption of self-protective measures only, (2) adoption of vector control measures only, and (3) a combination of both self-protective and vector control measures. We evaluate these scenarios against the cumulative number of infected individuals (C), represented by the solution of the following differential equation:
\[\frac{dC}{dt} = \lambda_h S_{h1} + (1 - \varepsilon)\lambda_h S_{h2}.\] (41)
Additionally, we present numerical solutions of the model with varying degrees of human behavioral changes, efficacy of self-protective measures, and effectiveness of vector control measures.
Figure 7 presents the numerical solutions of the model where the efficacy of self-protective measures (ε) and the effectiveness of vector control (˜δvτv) are 0.45583 and 0.22116, respectively, and the degree of positive behavioral changes (ατ˜ h) is set to 0.11841. The results showed that the adoption of vector control measures provides better outcomes in reducing dengue cases compared to self-protective measures. Figure 7(d) shows the numerical solution of Model (5) based on parameter values estimated from the reported daily dengue cases in Kaohsiung, Taiwan. Despite the majority of the human population being non-adherent to the adoption of self-protective and vector control measures, as depicted in Figure 5, the adoption on vector control measures by a sufficient number of adherent individuals can prevent a large number of dengue cases. Notably, Figure 7(b) reveals that adopting self-protective measures alone leads to an initial higher number of dengue cases
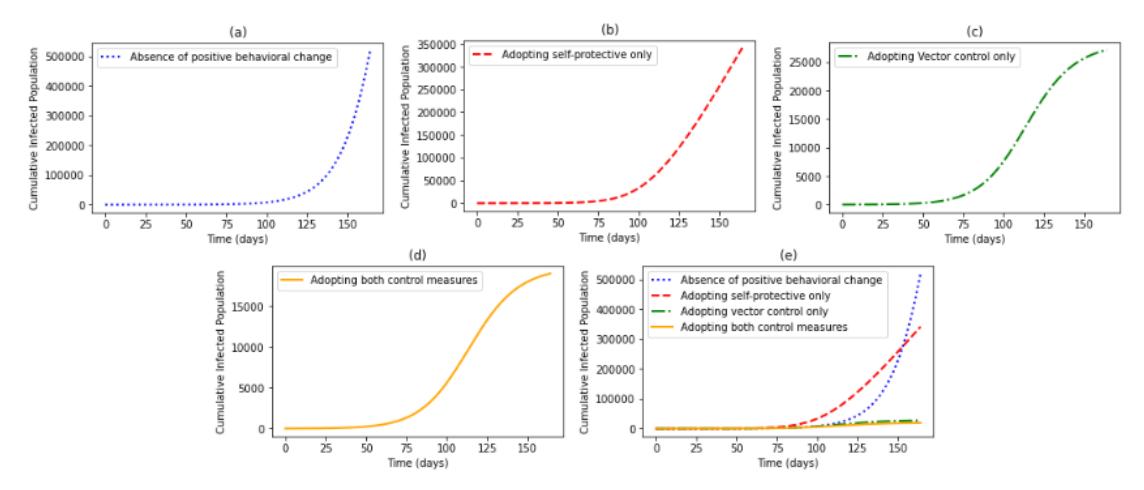
Figure 7: Numerical simulations of the model: (a) Absence of positive behavioral change, (b) With positive behavioral change adopting self-protective measures only, (c) With positive behavioral change adopting vector control measures only, (d) With positive behavioral change adopting both self-protective and vector control measures, and (e) Combined plot of dengue reduction scenarios
compared to the scenario with no positive behavioral changes depicted in Figure 7(a). This initial increase in dengue cases is primarily due to the absence of vector control measures, which play a crucial role in controlling infection rates. Despite the absence of positive behavioral changes, the vector control measures implemented by the limited number of existing adherent individuals help to slow the progression of the infection as shown in Figure 7(a). However, as shown in Figure 7(e), the small number of adherent individuals is insufficient to effectively mitigate the dengue outbreak as time progresses and eventually exceeds the number of infected cases observed with the adoption of self-protective measures alone.
Adoption of self-protective measures only, vector control measures only, and both strategies can reduce the number of dengue cases by approximately 34.3%, 94.8%, and 96.3%, respectively. These reductions are measured against the baseline cumulative number of infected cases observed in the absence of positive behavioral changes. The findings indicate that positive behavioral changes toward adopting vector control measures can substantially reduce dengue cases, provided these measures are highly effective. Intensive elimination of mosquito breeding sites, for example, has proven to be a crucial strategy in reducing dengue incidence and is the primary method for controlling dengue in Taiwan. However, achieving this level of effectiveness requires active community involvement. Educating the community about identifying and eliminating vector breeding sources is essential to enhance the efficacy of these control measures.
On the other hand, Figure 8(c) illustrates the influence of varying degrees of human behavioral changes on dengue reduction. Numerical simulations suggest that increased awareness and adherence to established self-protective and vector control measures result in a notable decrease in dengue cases. However, positive behavioral changes alone do not guarantee a significant reduction in dengue infections if the adopted selfprotective and vector control measures are insufficient. To achieve a significant reduction in dengue cases, the level of human behavioral changes must ensure that the actions taken to mitigate the disease are effective, as indicated in Figures 8(a) and 8(b). This underscores the importance of educating individuals on the effective methods of disease transmission mitigation. Additionally, addressing socio-economic challenges is crucial, as these factors impact individuals' ability to access necessary resources such as mosquito repellents, bed nets, and insecticides, which are essential for self-protective and vector control measures. It is recommended that governments provide/supplement these materials to ensure the high efficacy of the mitigation measures.
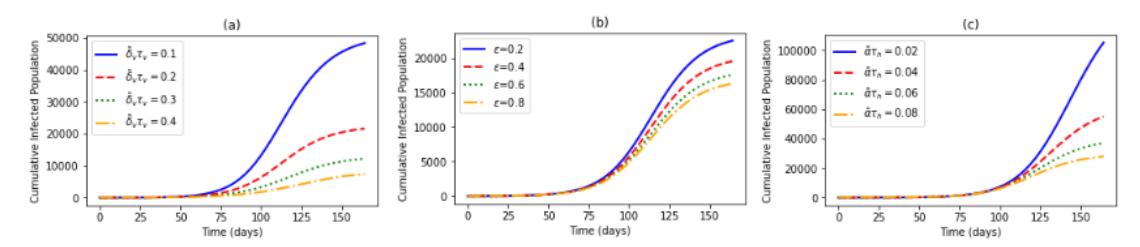
Figure 8: Numerical simulations of the model with (a) Varying effectiveness of vector control, (b) Efficacy of self-protective measures, and (c) Degrees of human behavioral changes.
5. CONCLUSIONS
In this paper, we propose and analyze a new mathematical model of dengue transmission dynamics that incorporates human behavioral changes in response to community infection levels. We estimate the model parameters using daily dengue case data from Kaohsiung City, Taiwan, for the year 2015 and perform a sensitivity analysis to identify the most influential parameters that affects the basic reproduction number, R0. The sensitivity analysis reveals that the mosquito biting rate, mosquito mortality rate, and recovery rate of infected non-adherent humans are the most influential parameters in reducing the reproduction number. This highlights the need for public health interventions that focus on reducing mosquito-human contact through increased awareness and adoption of personal protective measures, reducing mosquito populations through community-based vector control efforts, and improving access to effective treatment and consultation for infected individuals. Numerical simulations demonstrate that positive behavioral changes toward adopting self-protective and vector control measures can substantially reduce dengue cases, provided these measures are highly effective. Moreover, the simulations indicate that enhancing the degree of these behavioral changes results in a significant reduction in dengue incidence. These findings emphasize the importance of public health education campaigns that promote effective disease mitigation strategies and the necessity of providing the necessary resources to enhance the efficacy of self-protective and vector control measures.
The proposed model can be extended by incorporating multiple DENV serotypes and including the aquatic stages of mosquitoes. This extension will further improve in understanding the dynamics of dengue when adaptive human behavior as a response of community infection levels is explicitly incorporated. Another research direction will be to formulate an optimal control problem to determine the most effective combination of strategies that significantly reduces the dengue burden while minimizing government expenses. The results will provide policymakers with recommendations on cost-effective strategies for reducing dengue cases.
ACKNOWLEDGMENT
This research is funded by the DOST-Accelerated Science and Technology Human Resource Development Program, under its accredited university, the University of the Philippines Los Banos, Laguna, Philippines. ˜