

1. Introduction
Although the World Health Organization (WHO) revoked the global emergency status of the COVID-19 pandemic in May 2023, this does not imply that the disease no longer poses a threat. In the post-pandemic era, the coexistence of COVID-19 with other respiratory illnesses, such as influenza and Acute Respiratory Infections (ARIs), remains a significant concern. Several countries have documented cases of co-infections involving influenza and COVID-19 [46], as well as a resurgence in influenza and ARI cases [22], [17], [32]. Consequently, efforts to mitigate the spread of these diseases remain critically important.
During the COVID-19 pandemic, numerous countries implemented non-pharmaceutical interventions (NPIs) to mitigate the outbreak. Among these measures, mask-wearing was a prominent strategy [11]. Masks help reduce viral transmission by limiting the release of viruses from infected individuals and reducing the inhalation of viral particles by others [45]. The efficacy of mask-wearing in curbing the spread of various respiratory infectious diseases has been extensively studied. For instance, research has demonstrated its role in suppressing the transmission of COVID-19 [47], [13], influenza [9], [19], and pneumonia [26].
Other NPIs include social distancing, mobility restrictions, and lockdowns. These measures had a positive impact in controlling the pandemic and the environmental conditions, including air quality [51], [15]. The effects of social distancing and mobility restrictions on air pollution and emissions reduction have been documented worldwide [6]. For example, an overall improvement in air quality was indicated in Northwest China [51]. However, during the easing of NPIs, air pollution is reported to have rebounded, especially
*Corresponding Author
Received March \(3^{rd}\), 2025. Revised September \(6^{th}\), 2025, Accepted for publication November \(4^{th}\), 2025. Copyright ©2026 Published by Indonesian Biomathematical Society, e-ISSN: 2549-2896, DOI:10.5614/cbms.2026.9.1.1 in industrial regions [15]. The rebound of air pollution requires attention because it increases the risk of respiratory infections [23], [25].
According to data from the World Health Organization (WHO), in 2019, 99% of the global population resided in areas with polluted air, with low- and middle-income countries experiencing the highest levels of exposure [49]. By 2022, air pollution had reached alarming levels, with only 13 countries and territories worldwide maintaining healthy air quality [39]. In 2023, Indonesia faced severe air pollution, which peaked in August when Jakarta, the nation's capital, was ranked as the world's most polluted city [10]. This situation demands urgent attention, as air quality has significant impacts on public health. Immediate measures must be implemented to prevent further deterioration of the public health crisis.
Many critical decisions must be made, particularly during an outbreak, to mitigate the spread of infectious diseases. These decisions can occur at various levels, ranging from individual choices—such as whether to comply with a policy or recommendation—to collective actions within communities or nations. A powerful mathematical framework for modeling such decision-making processes is game theory. Game-theoretic models are regarded as essential tools for understanding and predicting human behavior in epidemics. [7] introduced the concept of imitation dynamics to model vaccination behavior, employing replicator equations to describe shifts in individual strategies. Subsequent research, such as [18], expanded this framework by incorporating strategy changes governed by the Fermi function and simulating population dynamics on network structures. [38] investigated the dynamics of behavioral changes in response to H1N1 awareness campaigns, and [35] integrated social norms into imitation dynamics to better capture the influence of societal factors on strategy adoption.
Several studies have employed game theory to simulate human behavior during epidemics, including decisions related to vaccination [1], mask usage, and self-quarantine [36]. These approaches often combine game-theoretic models with compartmental models to better capture the interplay between individual decisionmaking and disease dynamics. For instance, [44] investigated community behavior regarding mask usage and self-quarantine by integrating the Susceptible-Exposed-Infectious-Recovered (SEIR) model with evolutionary game theory. Similarly, [3] applied game theory to study mask usage during the COVID-19 pandemic, incorporating the risk of severe COVID-19 outcomes into the cost calculations within a Susceptible-Infectious-Recovered (SIR) framework.
Further advancements in modeling decision dynamics have used replicator equations, which describe how strategies evolve over time. These studies often merge compartmental models with replicator equations to study the co-evolution of behavior and disease spread. For example, [5] developed a model combining the Susceptible-Infectious-Recovered-Susceptible (SIRS) framework with replicator equations to represent three distinct behavioral strategies. In another study, [27] modified the Susceptible-Undetected-Infectious-Recovered-Death (SUIRD) epidemic model by incorporating replicator equations to evaluate the effectiveness of public health measures during the COVID-19 pandemic. This research aimed to explore the relationship between infection spread and individuals' willingness to cooperate in response to an epidemic.
In this work, we investigate human behavior regarding mask usage in response to the resurgence of ARI cases post-pandemic by combining the SIR compartmental model with game theory. Using incidence data from Jakarta, Indonesia, we propose a novel approach to calculating payoffs that incorporates three key factors: the proportion of infected individuals, the proportion of mask users, and the efficiency of masks. We find that both the cost of using masks and the initial proportion of mask users significantly influence the dynamics of the infected population.
2. MODEL FORMULATION
In this work, we construct a model that combines the classical SIR epidemic model with the replicator equation to describe the interplay between the behavior of individuals and the epidemiological dynamics. We assume that the infection rate will decrease when the proportion of mask users increases. The calculation of the payoff in the mask game and the construction of the proportion of mask users are described as follows.
Consider a mask game involving n players, each of whom can voluntarily choose to either use or not use a mask. In this game, every player has access to information about the proportion of infected individuals among the n players, denoted by pinf. The parameters and variables associated with this game are summarized in Table 1.
Each player is assumed to play with the same values of a, b, and c. To determine the values of a and b, we use data from an experimental study conducted in [45]. The study found that when a non-spreader individual
Variable/Parameter Description Value Ci Infected cost (the cost that needs to be paid by the susceptible people when they get infected) ≥ 0 Cuse Mask usage cost (the cost that needs to be paid when using a mask) ≥ 0 c = Cuse/Ci Relative cost Cuse towards Ci with Ci > 0 [0,1] a Reduction factor resulting from protection when a non-spreader uses the mask [0,1] b Reduction factor resulting from protection when a spreader uses the mask [0,1]
Table 1: Variables and parameters in the mask game.
used cotton masks, the reduction in virus uptake ranged from 20% to 40%. In contrast, surgical masks and N95 masks reduced virus uptake by 50% and 80%–90%, respectively. On the other hand, if a spreader used a mask, cotton and surgical masks blocked more than 50% of the virus, whereas N95 masks demonstrated even greater efficacy. In our study, we assume that the masks used in the community are made of cotton. Consequently, we select a = 1−0.3 = 0.7 and b = 1−0.5 = 0.5 to reflect the effectiveness of cotton masks in reducing virus uptake for non-spreaders and spreaders, respectively.
Here, the j−th player (j = 1, 2, . . . , n), can find the proportion of mask users among the remaining players, denoted by P. The cost incurred by the j−th player when deciding to wear a mask or not depends on the type of individual they encounter. For simplicity, we assume that any individual the j−th player meets is a spreader. Consequently, the relative cost c is applied only when the j−th player chooses to wear a mask. Table 2 summarizes the costs associated with meeting a non-mask user or a mask user.
Using Table 2, we can compute the total cost paid by the j−th player for each decision. The total cost is calculated by summing the costs incurred when the player interacts with both mask users and non-mask users, as detailed in Table 3.
Table 2: The cost incurred by j-th player if they meet a user or non-mask user.
| Cost | |||
|---|---|---|---|
| Mask user | Non-mask user | ||
| use | P · pinf · a · b + c | (1 − P ) · pinf · a + c | |
| no | P · pinf · b | (1 − P ) · pinf | |
Table 3: Cost matrix of the mask game with n players.
| Cost | |
|---|---|
| use | (1 − P + P · b) · pinf · a + 2c |
| no | (1 − P + P · b) · pinf |
From Table 3, the j-th player will decide to wear a mask if
\[(1 - P + P \cdot b) \cdot p_{\inf} \cdot a + 2c < (1 - P + P \cdot b) \cdot p_{\inf},\] or equivalently,
\[2c + p_{\inf} \cdot (a-1) \cdot (1 + (b-1) \cdot P) < 0.\]
Let Gj (P, pinf) be defined as
\[G_j(P, p_{\inf}) = 2c + p_{\inf} \cdot (a-1) \cdot (1 + (b-1) \cdot P).\]
Thus, the j-th player will choose to wear a mask if Gj (P, pinf) < 0 and will not wear a mask if Gj (P, pinf) > 0. Notably, Gj (P, pinf) is linear with respect to P.
Next, we will investigate the strategy of each player in the Nash equilibrium. In this condition, we obtain a stable state in which each player can identify the optimal strategy in a multiple-player interaction.
Proposition 1. (Nash Equilibrium). In a mask game with n players, where every player adopts the same values of a, b, and c, the Nash equilibrium occurs when each player decides to wear a mask with probability
\[P_{\textit{ne}} = \max \left\{ \min \left\{ \frac{p_{\textit{inf}} \cdot (1-a) - 2c}{p_{\textit{inf}} \cdot (1-a) \cdot (1-b)}, 1 \right\}, 0 \right\}.\]
Proof: The j-th player (j = 1, 2, ..., n) does not have a dominant strategy if
\[G_i(P, p_{inf}) = 2c + p_{inf} \cdot (a-1) \cdot (1 + (b-1) \cdot P) = 0,\] which yields
\[P = \frac{p_{\inf} \cdot (1-a) - 2c}{p_{\inf} \cdot (1-a) \cdot (1-b)}.\]
However, since \(P \in [0,1]\), the feasible value of P is
\[P' = \max \left\{ \min \left\{ \frac{p_{\inf} \cdot (1-a) - 2c}{p_{\inf} \cdot (1-a) \cdot (1-b)}, 1 \right\}, 0 \right\}.\]
Without loss of generality, the same reasoning applies to the other n-1 players.
Next, we show that if P < 0, the j-th player will tend not to wear a mask. If P < 0, then P' = 0 or P < P'. Given the condition \(G_j(P, p_{\inf}) = 0\) and the linearity of \(G_j(P, p_{\inf})\) with respect to P, it follows that \(G_j(P, p_{\inf}) > 0\). Thus, the j-th player will prefer not to wear a mask.
Similarly, if P > 1, the \(j^{th}\) player will tend to wear a mask. If P > 1, then P' = 1 or P > P'. With the condition \(G_j(P, p_{\text{inf}}) = 0\) and the linearity of \(G_j(P, p_{\text{inf}})\), it follows that \(G_j(P, p_{\text{inf}}) < 0\). Thus, the \(j^{th}\) player will prefer to wear a mask.
Therefore, the Nash equilibrium is achieved when every player decides to wear a mask with probability
\[P_{\text{ne}} = \max \left\{ \min \left\{ \frac{p_{\text{inf}} \cdot (1-a) - 2c}{p_{\text{inf}} \cdot (1-a) \cdot (1-b)}, 1 \right\}, 0 \right\}.\]
Next, we discuss the SIR model combined with the replicator equation. The general SIR dynamic model is as follows [40]:
\[\frac{dS}{dt} = \dot{S} = -\frac{\beta SI}{N}, \frac{dI}{dt} = \dot{I} = \frac{\beta SI}{N} - \gamma I = \left(\frac{\beta S}{N} - \gamma\right) I, \frac{dR}{dt} = \dot{R} = \gamma I,\] (1)
where the total population is N=S+I+R. In this model, individuals are classified into one of three compartments: susceptible (S), infected (I), or recovered (R). We assume that after an individual is infected, they proceed directly to the infection phase without an incubation period. The parameter \(\beta\) represents the maximum transmission rate, and \(\gamma\) is the recovery rate.
The transmission rate \(\beta\) is influenced by the proportion of mask users P. Specifically,
- If P=0, the transmission rate is \(\beta\) (i.e., no reduction due to mask usage).
- If P=1, the transmission rate is adjusted by the mask efficiency parameters a and b.
The transmission rate as a function of P is formulated as:
\[\beta(P) = \beta \left( (a \cdot b - 1)P + 1 \right).\]
Thus, the SIR dynamic model incorporating mask usage becomes
\[\frac{dS}{dt} = \dot{S} = -\frac{\beta \left( (a \cdot b - 1)P + 1 \right) SI}{N},\] \[\frac{dI}{dt} = \dot{I} = \frac{\beta \left( (a \cdot b - 1)P + 1 \right) SI}{N} - \gamma I,\] \[\frac{dR}{dt} = \dot{R} = \gamma I,\] (2)
with positive initial conditions \(S(0) = S_0\), \(I(0) = I_0\), and \(R(0) = R_0\).
Next, we discuss the replicator equation. The replicator equation describes the dynamics of strategy adoption in a deterministic framework, assuming an infinitely large and well-mixed population [34]. In this context, stochastic factors are ignored, and all individuals are considered homogeneous and interact uniformly.
We integrate the replicator equation with the mask game. Consider a game with n strategies, labeled \(S=1,2,\ldots,n\). The \(n\times n\) payoff matrix A has entries \(a_{st}\), representing the payoff for strategy s against strategy t, where \(s,t\in S\). The proportion of players adopting strategy s is denoted by s, with s with s is given by
\[f_s = \sum_{t=1}^n x_t a_{st},\] and the average payoff of the entire population is
\[\phi = \sum_{s=1}^{n} x_s f_s.\]
The replicator equation is then expressed as [34]
\[\frac{dx_s}{dt} = \dot{x}_s = x_s(f_s - \phi), \quad s = 1, 2, \dots, n.\] (3)
For a game with two strategies, A and B, the dynamics of \(x_A\), the proportion of individuals choosing strategy A, are given by
\[\dot{x}_A = x_A (1 - x_A)(f_A - f_B),\tag{4}\]
where \(f_A\) and \(f_B\) are the average payoffs for strategies A and B, respectively. By applying the replicator equation in (4), the payoff matrix in Table 3, and \(p_{\inf} = \frac{I}{N}\), the dynamics of the proportion of mask users P can be written as
\[\frac{dP}{dt} = \dot{P} = P(P-1)\left(2c + \frac{I}{N}\cdot(a-1)\cdot(1+(b-1)\cdot P)\right). \tag{5}\]
Thus, the full model combining the SIR dynamics with the replicator equation is
\[\dot{S} = -\frac{\beta \left( (a \cdot b - 1)P + 1 \right) SI}{N},\tag{6}\]
\[\dot{I} = \frac{\beta \left( (a \cdot b - 1)P + 1 \right) SI}{N} - \gamma I,\tag{7}\]
\[R = \gamma I,\tag{8}\]
\[\dot{P} = P(P-1) \left( 2c + \frac{I}{N} \cdot (a-1) \cdot (1 + (b-1) \cdot P) \right). \tag{9}\]
3. MODEL ANALYSIS
In Theorems 3.1–3.3 below, we will analyze the properties and behavior of this system. Theorem 3.1 is established to ensure the mathematical and biological well-posedness of the model.
Theorem 3.1. Assume \(S(0), I(0), R(0) \ge 0\). The solutions of the system (6)–(9) are contained in the set
\[\mathcal{K} = \{ (S, I, R, P) \in \mathbb{R}^4 : S \ge 0, I \ge 0, R \ge 0, P \in [0, 1] \},\] for all t > 0.
Proof: The solution of (7) is given by
\[I(t) = I(0) \exp\left(\int_0^t \left(\frac{\beta((ab-1)P(\tau)+1)S(\tau)}{N} - \gamma\right) d\tau\right).\]
Thus, if \(I(0) \ge 0\), then \(I(t) \ge 0\) for all t > 0. Next, the solution of (6) is
\[S(t) = S(0) \exp\left(-\int_0^t \frac{\beta((ab-1)P(\tau)+1)I(\tau)}{N}d\tau\right).\]
Since \(S(0) \ge 0\), it follows that \(S(t) \ge 0\). The solution of (8) is
\[R(t) = \int_0^t \gamma I(\tau) d\tau.\]
Since \(I(t) \ge 0\) and \(\gamma > 0\), we have \(R(t) \ge 0\). The proof for P being contained in [0,1] can be found in
Observe that the recovered compartment R is decoupled from the other variables. Moreover, since \(\dot{S}\) + \(\dot{I} + \dot{R} = 0\), the total population N is constant. Therefore, the number of recovered individuals R can be calculated as R = N - S - I. Consequently, the system (6)–(9) can be simplified to
\[\dot{S} = -\frac{\beta((a \cdot b - 1)P + 1)SI}{N},\] \[\dot{I} = \frac{\beta((a \cdot b - 1)P + 1)SI}{N} - \gamma I,\] \[\dot{P} = P(P - 1) \left(2c + \frac{I}{N} \cdot (a - 1) \cdot (1 + (b - 1) \cdot P)\right).\] (10)
Theorem 3.2. The disease-free equilibrium points for the system (10) are \(E_0 = (k, 0, 0)\) and \(E_1 = (k, 0, 1)\), where \(k \in [0, N]\).
Proof: The equilibrium is obtained when the system satisfies \(\dot{S} = 0\), \(\dot{I} = 0\), and \(\dot{P} = 0\). In the diseasefree condition, I=0, which implies \(\dot{I}=0\) and \(\dot{S}=0\) for any value of S(t). Let S(t)=k represent the number of susceptible individuals in the disease-free condition, where \(k \in [0, N]\). For \(\dot{P} = 0\) when I = 0, we have P=0 or P=1. Thus, the disease-free equilibria are \(E_0=(k,0,0)\) and \(E_1=(k,0,1)\), where \(k \in [0, N].\)
Theorem 3.3. For the system (10),
- 1) \(E_0\) is locally asymptotically stable if \(\frac{\beta k}{N} < \gamma\). 2) \(E_1\) is an unstable equilibrium.
Proof: The Jacobian matrix for the system (10) evaluated at \(E_0\) has three eigenvalues:
\[\lambda_1 = 0\], \(\lambda_2 = \frac{\beta k}{N} - \gamma\), and \(\lambda_3 = -2c\).
If \(\frac{\beta k}{N} < \gamma\), then \(\lambda_2 < 0\), and \(\lambda_3 < 0\) for c > 0. Since one eigenvalue is zero, we apply the center manifold theorem. Using the change of variables S = x, \(I = x + \left(\frac{N\gamma}{\beta k} - 1\right)y\), and P = z, the system reduces to
\[\frac{dx}{dt} = -\frac{\beta}{N} \left[ -\frac{(ab-1)5\beta^2}{\gamma N^2} x^5 + \frac{(ab-1)}{N} \beta x^4 + \frac{(ab-1)\beta}{N} + \frac{5\beta}{\gamma N} x^3 \right].\]
This confirms that \(E_0\) is a stable node. On the other hand, the Jacobian matrix evaluated at \(E_1\) has three eigenvalues:
\[\lambda_1 = 0\], \(\lambda_2 = \frac{\beta abk}{N} - \gamma\), and \(\lambda_3 = 2c\).
For c > 0, \(\lambda_3 > 0\), which implies that \(E_1\) is an unstable equilibrium.
4. SIMULATION
Simulation were conducted for two distinct models. In the first model, the probability of mask usage is determined by the replicator equation, whereas in the second model, the probability of mask usage is fixed at Pne. For the first model, the simulation was performed under two scenarios:
- 1) The parameter values are based on the ARIs incidence data for Jakarta, as presented in [2].
- 2) A higher value of β is used to represent a faster spread of ARIs, while all other parameter values remain the same as in the first scenario.
| Variable/Parameter | Value | Source |
|---|---|---|
| Cost of surgical mask (Cuse) | IDR 1,200 | [20] |
| Minimum cost of being infected (C1) | IDR 23,394,180 | [37] |
| Average cost of being infected (C2) | IDR 54,450,366 | [37] |
| Maximum cost of being infected (C3) | IDR 142,717,333 | [37] |
| c1 | 0.015 | c1 = Cuse/C1 |
| c2 | 0.006 | c2 = Cuse/C2 |
| c3 | 0.0025 | c3 = Cuse/C3 |
Table 4: Cost values for simulation.
The effects of the initial proportion of mask users (P0) and the cost ratio of wearing a mask and being infected (c) on the mask game were investigated through simulations. For each of the scenarios mentioned earlier, simulations were conducted for P0 = 0.1 and P0 = 0.5 with several values of c. We assume that the cost of wearing a mask (Cuse) is constant and equivalent to the cost of two surgical masks per day for the entire duration of the simulations. The cost of being infected is derived from [37], which provides the minimum, mean, and maximum costs of hospitalization, as shown in Table 4. Consequently, we define three values of c: c1, c2, and c3, calculated as the ratio of Cuse to the minimum, mean, and maximum costs of being infected, respectively.
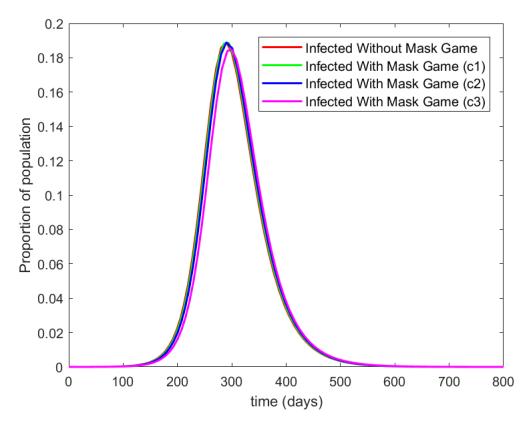
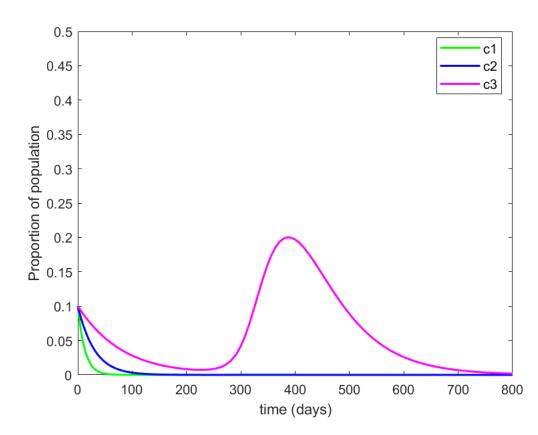
Figure 1 illustrates the simulation results for the first scenario, where β = 0.079. As shown in Figure 1a, for P0 = 0.1, the mask game reduces the infected population by less than 1%. In this setting, we observe that if 10% of the population initially wears masks, the mask game fails to significantly decrease the proportion of the infected population. The proportion of mask users decreases before the outbreak, and only for c3 does the proportion of mask users increase after the outbreak, reaching a maximum of 20% of the population, as shown in Figure 1b.
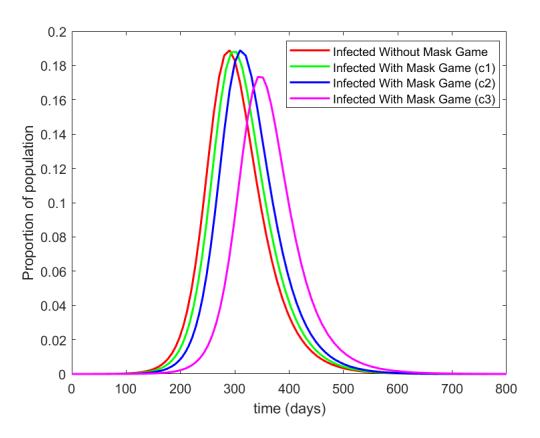
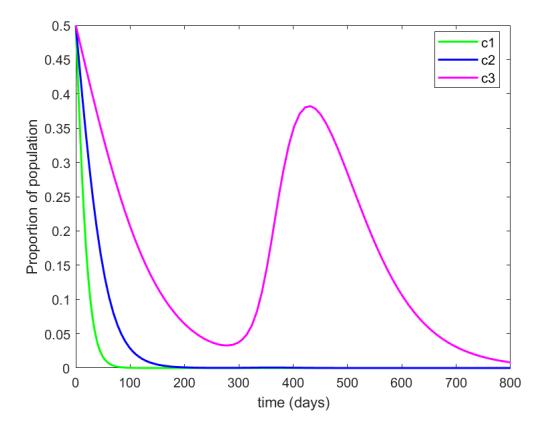
The changes in the proportions of the infected population and mask users are more pronounced for P0 = 0.5, as depicted in Figures 1c and 1d. The mask game with c1 and c2 fails to reduce the peak infection but delays the peak time. In contrast, the mask game with c3 successfully reduces the peak infection by 2% and also delays the peak time. The proportion of mask users declines over time for c1 and c2, whereas for c3, the proportion of mask users begins to increase once the peak infection time is reached. The maximum proportion of mask users for c3 is approximately 40%.
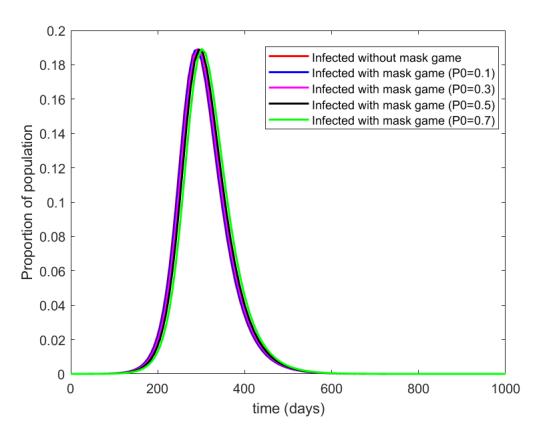
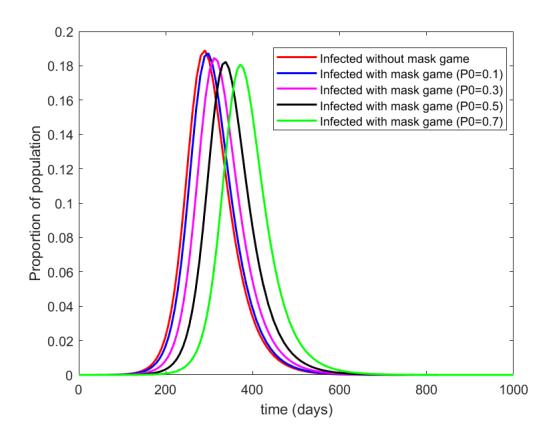
Next, we examine the dynamics of the infected proportion in the first scenario for several values of P0 with fixed values of c. For this simulation, we chose P0 = 0.1, 0.3, 0.5, and 0.7 with c1 and c3. As shown in Figure 2, the mask game with a smaller value of c (i.e., c3) reduces the proportion of the infected population and produces a longer delay in the peak time. For c1, the mask game fails to reduce the proportion of the infected population at any value of P0. In contrast, a distinct reduction in the proportion and delayed peak time is observed for c3. For this value, the results indicate that a higher P0 leads to a greater reduction in the infected population. This suggests that when the cost ratio c is relatively low, more people tend to wear masks if the initial proportion of mask users is larger.
The second simulation was conducted under the scenario of a more rapid infection. In this case, we set the parameter β = 0.3, while the values of the other parameters remained the same as in the first scenario, as shown in Tables 1 and 4. The simulation results for this scenario are presented in Figure 3. As shown in Figure 3a, for P0 = 0.1, the mask game can slightly reduce the proportion of the infected population. As the outbreak progresses, the proportion of mask users in the game increases for all values of c. This result reflects a different dynamic from the first scenario, as shown in Figure 1b, where the proportion of mask

(b) The number of mask users with P0 = 0.1 and several values of c.
(c) The number of infections with P0 = 0.5 and several values of c.
(d) The number of mask users with P0 = 0.5 and several values of c.
Figure 1: Simulation results for the first scenario.
users increases over time for both c1 and c2. Specifically, for c1, the proportion of mask users reaches its peak when approximately 60% of the population wears a mask, after which it declines once the outbreak is over. For c2, the proportion of mask users peaks at around 85% of the population and then decreases gradually. For c3, the proportion of mask users peaks at approximately 90% of the population.
For P0 = 0.5, as shown in Figure 3c, a smaller value of c can result in a greater reduction of the infected population. The proportion of mask users for P0 = 0.5 reaches over 70% of the population at its peak for all values of c. From Figure 3b and 3d, we can infer that a higher P0 value leads to a higher maximum proportion of mask users, suggesting that the initial proportion of mask users affects the overall proportion of mask users in the population. These findings suggest that in situations where the disease spreads rapidly, individuals are more likely to wear masks, regardless of the value of c.
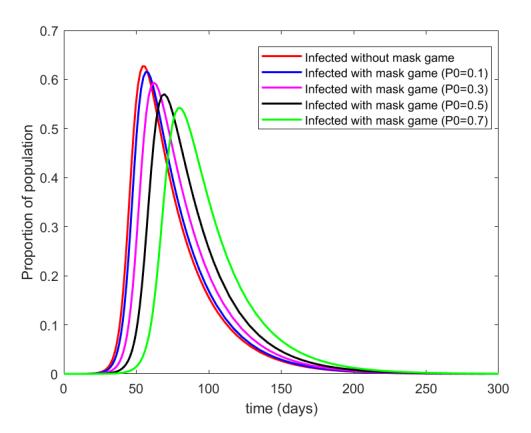
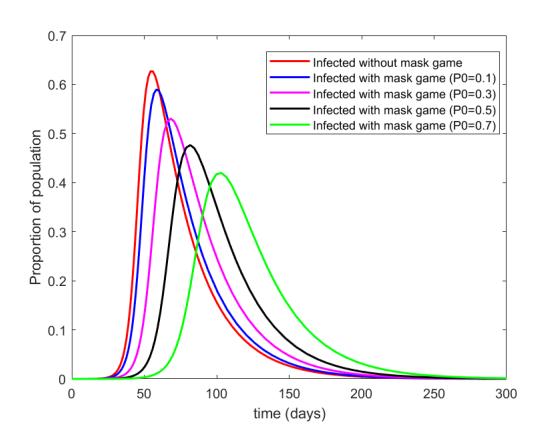
Figure 4 illustrates the proportion of infections for different values of P0 in the second scenario. We observe that in this case, the mask game is effective in reducing the proportion of infections for all variations of P0. For both values of c, the minimum reduction in infections for c1 is approximately 1%, whereas for c3 it is 3%. The maximum reduction for c1 is approximately 9%, and for c3 it reaches 20%.
- (a) The number of infections with c1 and several values of P0. (b) The number of infections with c3 and several values of P0.
Figure 2: Simulation results of the number of infections for several values of P0 in the first scenario.
The dynamics of S(t), I(t), R(t), and P(t) for both scenarios with P0 = 0.50 and c3 are shown in Figure 5. In the first scenario, as depicted in Figure 5a, not all members of the susceptible population are infected. The maximum proportion of mask users is approximately 20%, which occurs after the outbreak's peak. In contrast, for the second scenario, the proportion of mask users increases as the proportion of the infected population peaks, with the maximum proportion reaching approximately 90%. The decline in the proportion of mask users in the second scenario is slower than in the first scenario. This suggests that individuals are more likely to continue wearing masks during a more severe outbreak, even when the number of infections begins to decrease.
The simulation results indicate that the mask game can reduce the proportion of the infected population in the first scenario if the value of c is relatively small and P0 exceeds 10%. In this case, two conditions must be met for the mask game to affect the proportion of the infected population. First, regarding the value of c, if the cost of being infected (Ci) is constant, then the cost of using a mask (Cuse) must be minimized. Second, regarding the P0 value, at time t = 0, more than 10% of the population must be using masks.
On the other hand, in situations where the disease spreads more rapidly, we observe that for P0 = 0.10, the reduction in the proportion of infections (Figure 3a) varies only slightly with c. This indicates that if 10% of the population initially wear masks and Ci is assumed to be constant, the cost may not significantly influence an individual's decision to wear a mask. In Figure 4, we observe that a higher P0 can significantly reduce the proportion of infections. Therefore, in such situations, a high initial proportion of mask users is necessary to reduce infections effectively.
In the second model, each player adopts strategy Pne, as described in model 9, where P = Pne. For the simulation, we selected β = 0.079, γ = 0.035, and the values of c as c2 and c3. Figure 6 presents the simulation results for this scenario. From the results, we observe that the mask game can reduce the proportion of the infected population relative to the situation without it. The mask game with c2 can reduce the proportion of the infected population by up to 5%, whereas c3 can reduce it by up to 13%. However, the proportion of the infected population in the mask game decreases more slowly than without the mask game after both reach their peak values for both c values.
The proportion of mask users in the mask game with c2 peaks at 35% and then continues to decline. This proportion reaches zero when the proportion of the infected population, depicted in Figure 6a, reaches 13%. For c3, the proportion of mask users peaks at 65% and then continues to decline, reaching zero when the infected proportion drops to 4%. For both values of c, the proportion of mask users increases as the proportion of infected individuals rises.
In the mask game with strategy Pne, it is observed that with c2, individuals tend to avoid mask usage when the proportion of infections is below 13%, whereas for c3, they decide not to use a mask when the proportion
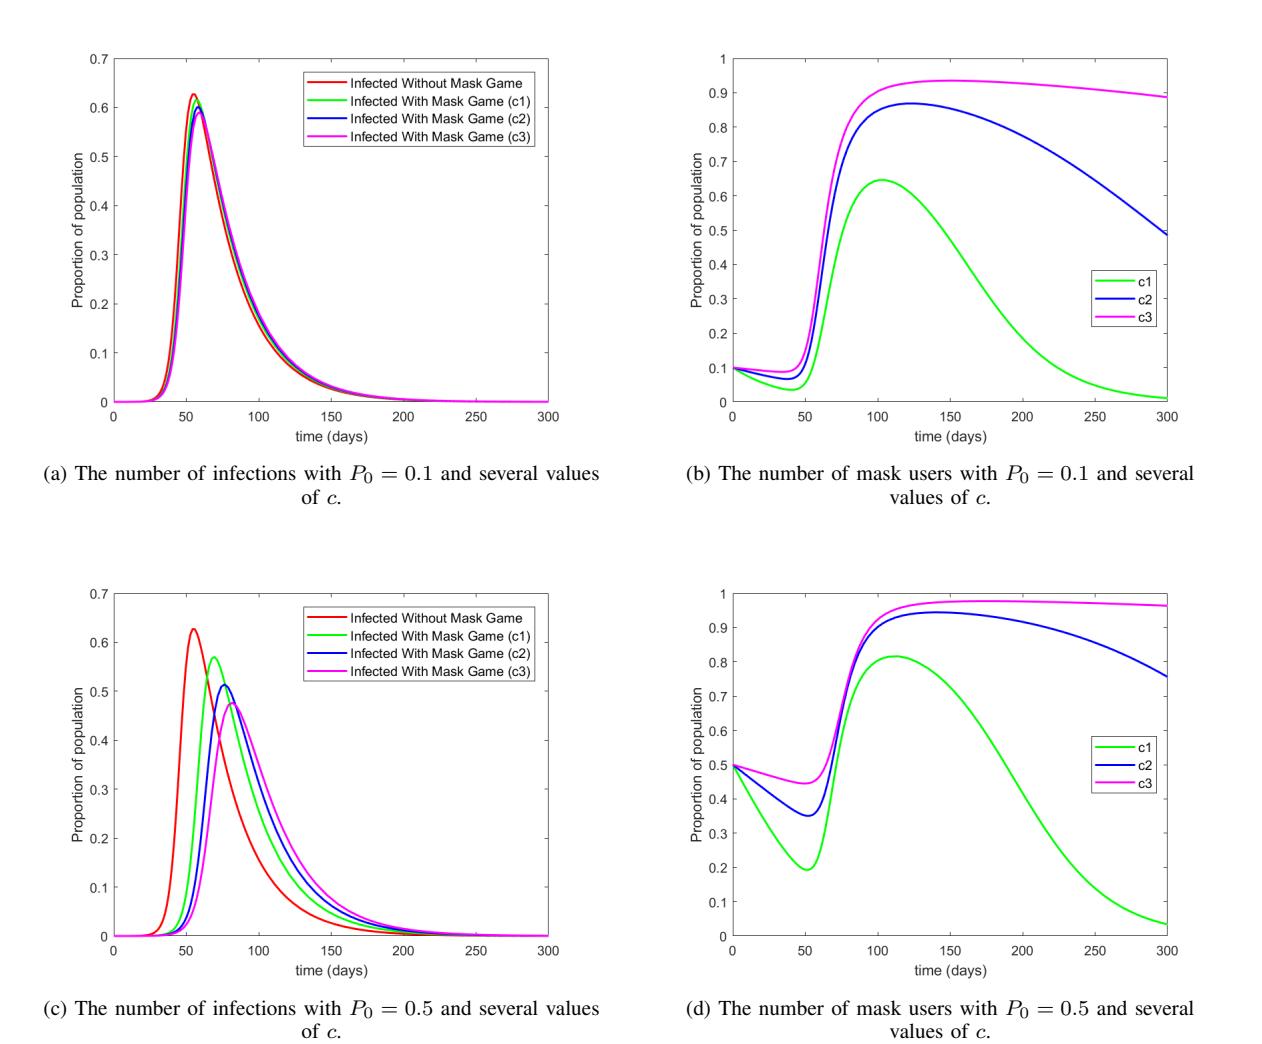
Figure 3: Simulation results for the second scenario.
of infections is below 4%. These results show that despite the still high proportion of infections under the Nash equilibrium, individuals are less likely to wear masks when the c value is higher.
Several studies have explored incorporating behavioral factors such as social distancing and mask wearing into the SIR model to describe the disease transmission. Using the SIR model, the impact of social distancing on disease spread was investigated in [33], [14], [12]. Similarly, the role of mask-wearing in mitigating the spread of COVID-19 was examined using a compartmental model in [28], [50].
The application of game theory to NPIs during the COVID-19 pandemic has been extensively studied. For example, [52] and [16] employed imitation dynamics to analyze behavioral changes during the pandemic. The framework of evolutionary game theory has also been used to examine compliance behaviors under lockdown measures, accounting for both symptomatic and asymptomatic cases, as well as counter-compliance effects [21]. Evolutionary game theory has also been applied to a range of NPIs, including quarantine policies [1], [44], social distancing [31], mask-wearing [31], [44], vaccination efforts [42], and other general NPIs [41].
Social and psychological factors will likely influence individuals' decisions to wear masks. Social implications, such as stigmatization may deter individuals from wearing masks, even in the context of an outbreak
- (a) The number of infections with c1 and several values of P0. (b) The number of infections with c3 and several values of P0.
Figure 4: Simulation results of the number of infections for several values of P0 in the second scenario.
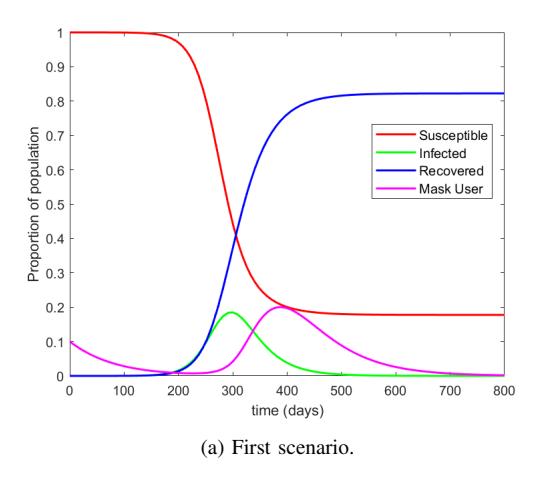
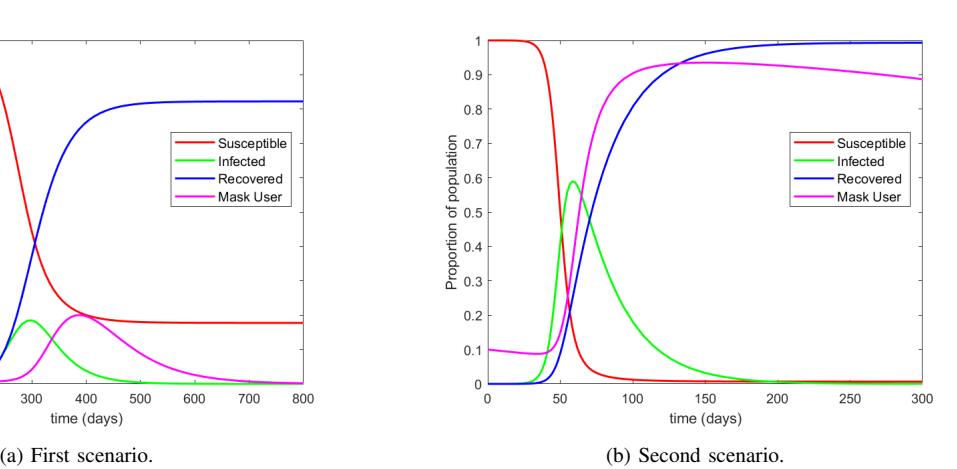
Figure 5: The dynamics of S(t), I(t), R(t), and P(t) for P0 = 0.1 and c3 for the first scenario with β = 0.079 in (a) and the second scenario with β = 0.3 in (b).
[8]. Additionally, observing the behavior of others may influence mask-wearing decisions, as individuals may be more likely to wear a mask if others are doing the same [30]. Moreover, discomfort associated with mask-wearing, such as difficulty breathing or speaking, may contribute to an individual's reluctance to wear a mask [24].
Our model displays a social dilemma structure, characterized by the Nash Equilibrium (NE) and Social Optimum (SO), which are essential for understanding individuals' strategic decisions. This concept is further quantified by the Social Efficiency Deficit (SED), as introduced by [4]. The SED measures the extent to which the payoff can be improved from NE to SO, determined by the difference between the payoffs at SO and NE [43]. [44] highlighted that a higher SED value in mask-wearing behavior indicates a more pronounced social dilemma. In particular, when the cost of wearing a mask is low, individuals may be more likely to forgo mask usage and act as "free-riders", which worsens the dilemma. Additionally, [29] examined the effects of risk perception and costs associated with three intervention strategies: awareness, vaccination, and treatment. Their results suggest that as the costs of vaccination and awareness increase, the social dilemma becomes
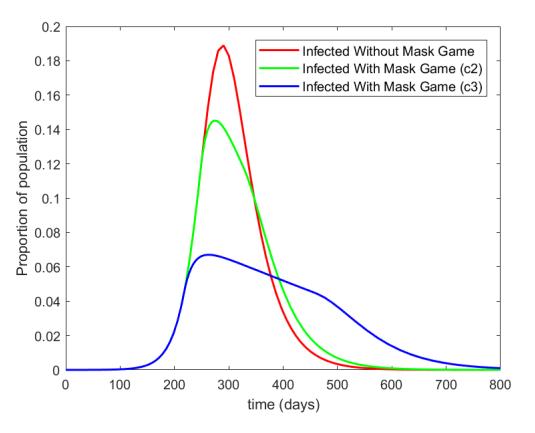
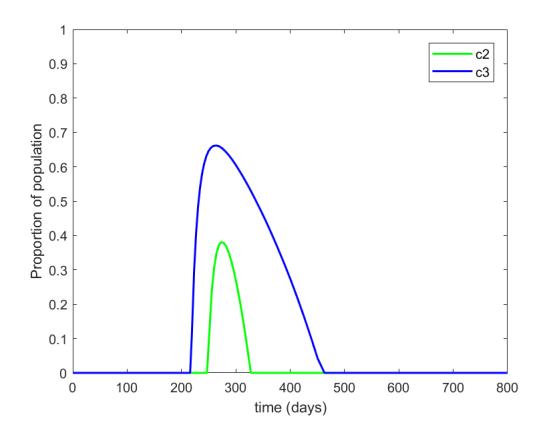
- (a) The number of infections when players play with strategy Pne for c2 and c3.
- (b) The number of mask users when players play with strategy Pne for c2 and c3.
Figure 6: The simulation result when players play with strategy Pne.
more pronounced, reaching its peak when both costs are at their highest. According to their SED analysis, higher awareness, and increased vaccination efforts, when costly, can unintentionally make the social dilemma more difficult to resolve.
Our findings demonstrate that a large initial proportion of mask users can significantly reduce infection levels. This aligns with the concept of mask-wearing as a social contract as stated in [8], according to which high compliance is essential to avoid stigma and ensure collective benefits. This idea is further supported in [30], which found that mask-wearing behavior is strongly influenced by social conformity that is, individuals are more likely to adopt mask use when the proportion of mask users in the population is high. Our results thus reinforce the importance of fostering social norms to promote mask-wearing as a preventive measure. Additionally, our study finds that minimizing the cost of mask use is vital to ensuring widespread adoption. This finding is consistent with [31], in which it was argued that when highly effective face masks are made affordable and their collective benefits are clearly communicated, mask compliance within society increases significantly. The agreement between our findings and the results of prior studies shows the relevance of our work in the broader context of behavioral and epidemiological research.
5. CONCLUSION
In this study, we examined the impact of mask-wearing on controlling the spread of respiratory infections. By integrating a game-theoretic framework with the SIR epidemic model, using a replicator equation, we demonstrated that mask usage substantially reduces the incidence of respiratory infections, especially during the early stages when the number of infections remains relatively low. Our findings indicate that both the initial proportion of mask users within a population and the cost associated with wearing a mask significantly influence the extent of the outbreak. This suggests that in scenarios where the disease spreads rapidly, it is essential for governments to implement and enforce mask-wearing policies, taking into account the cost of wearing masks, to mitigate the transmission of infections.
ACKNOWLEDGEMENT
YNN and NN acknowledge support from an ITB Research Grant. HS also acknowledge support by Khalifa University through a Competitive Internal Research Awards Grant (No. 8474000413/CIRA-2021-065) and Research & Innovation Grants (No. 8474000617/RIG-S-2023-031 and No. 8474000789/RIG-S-2024-070).