
Introduction
A typical human observes, hears, and responds to his or her environment. Some people are not blessed with this significant ability. These people, who are primarily deaf and dumb, rely on sign language for interpersonal communication. However, since not everyone can understand their sign language, it is extremely difficult for them to communicate with regular people, especially when they want to participate in social, educational, and job-related activities.
Creating a sign language translation system was the goal of this study, to help persons who are deaf or hard of hearing communicate with ordinary people. In general, the two basic approaches of sign language recognition are vision-based and sensor-based [1]. The vision-based approach uses images, while the sensor-based approach usually uses a special glove-based device equipped with particular sensors to capture and convey information. The glove in this research utilized an Arduino Nano microcontroller as the processor, and a slide potentiometer and a force-sensitive resistor as the sensors to identify hand poses that represent the alphabet from American Sign Language (Figure 1).
The software portion of the search module makes use of Python, a well-known, high-level programming language that was developed in 1991 for general-purpose programming. With it, programmers may express ideas in fewer lines of code than they can with languages like Java or C. Python supports a variety of programming languages, including procedural, functional, and object-oriented programming. It has a dynamic system and automated memory management. It also has huge and extensive standard libraries. Python code can be executed on a broad range of platforms because of the availability of Python interpreters for several operating systems [2]. Testing of the system in real time was done using Python IDLE; the corresponding letters are displayed on a computer screen. The rationale for selecting a slide potentiometer over a flex sensor – which is the most commonly used sensor in sensor-based sign language recognition – is that the latter is prone to carbon link disconnection with frequent use [3] and the cost of building a data glove using flex sensors can be high due to their high price (the cost when using a slide potentiometer and a force-sensitive resistor is 45% lower than the cost of using a flex sensor). Additionally, the flex sensor's reading is unstable and noise-sensitive [4]. Therefore, providing an alternative to using flex sensors in sign language recognition systems, in addition to
Copyright ©2024 Published by IRCS - ITB J. Eng. Technol. Sci. Vol. 56, No. 2, 2024, 193-204 ISSN: 2337-5779 DOI: 10.5614/j.eng.technol.sci.2024.56.2.2
recognizing all English letters without the need for any sensor that measures direction and rotation, are the basic contributions of this research.
The remainder of this paper is organized as follows. Section 2 presents a literature review of previous research, Section 3 explains the design and hardware components needed, Section 4 is about the creation of data sets, Section 5 shows the software part of the search and results, and Section 6 contains the conclusion of the work and some ideas for future work.
American Sign Language alphabet [5].
Literature Review
According to previous research, sign language recognition in a sensor-based approach can be accomplished by detecting finger bending only through sensors like a flex sensor, a tilt sensor, a light-emitting diode-light dependent resistor (LED-LDR), an accelerometer, and others, or by the detection of wrist position and finger bending [6]. A portion of this study is covered in this section. Sriram et al. [3] developed a gesture recognition glove using five three-axis ADXL 335 ACC sensors. In this system, an ATmega 2560 microcontroller is used to decode motions in American Sign Language (ASL) by considering the axis direction concerning gravity and the associated voltage. Through the use of a Bluetooth module, the alphabet or word is sent to an Android application, which translates it into text and voice.
The technology known as sign-to-letter translator (S2L) was created in [7] by El Hayek et al. Six flex sensors, separate components, an LCD, a microprocessor, and a glove make up the system. There is one flex sensor on the wrist and five on each finger. The analog inputs of the six sensors are transformed into two-bit zeros, one for each letter of the five flex sensors. A few 'if' conditions are used to get the final result. Chouhan et al. [8] developed a glove that records the position of the hand and the bending of the fingers using ACC and Hall Effect sensors. Four Hall Effect sensors (MH183) attached to all fingers save the thumbs are used to detect the south poles of a magnet placed on the palm to determine the tilt of the fingers. The addition of an ADXL535 allowed for the capturing of the hand orientation utilizing information from the triplet of x, y, and z axes (voltages). To ascertain how many motions (0–9) the user made and how accurate (around 96%) the identification is, the data gathered from the glove is fed into a MATLAB script.
Shukor et al. [4] used a tilt sensor to detect words, numerals, and letters in Malaysian Sign Language (MSL) for the first time. The system's constituent parts are a glove with ten tilt sensors – two for each finger – a 3-axis ACC that detects hand motion using roll, pitch, and yaw values, and a microcontroller and Bluetooth module that send the converted data to a mobile device. The accuracy varied from 78.33% to 95% when the design was tested on a few MSL motions using a matching template. An LED-LDR pair for each finger was used by Praveen et al. [9] to detect finger bending. An MSP430G2553 microprocessor generates digital samples and the ASCII code of 10 English alphabets from analog voltage signals. Gestures that have been recognized are conveyed over ZigBee Bluetooth. When the computer shows the received ASCII code, the audio file that goes with it is played.
Abhishek et al. [10] developed a glove based on a charge transfer touch sensor to translate American Sign Language. It is a handheld device that requires cheap hardware to operate. The prototype can recognize
movements for the 26 letters of the alphabet (A through Z) and the digits 0 through 9. The glove's total detection accuracy in the experiment was above 92% based on 1,080 trials. In the field of hand gesture classification in real time, high-density surface electromyography (HD-sEMG) signals may also be used [11]. Zhihao Zhou et al. [12] attempted to recognize American Sign Language letters (A, B, C, I, L, Y) and numbers (1, 2, 3, 8) and the phrase ''I love you'' by designing a system consisting of yarn-based stretchable sensor arrays (YSSAs) and a wireless printed circuit board. The system offers high sensitivity and a fast response time; the recognition rate was up to 98.63% and the recognition time was less than 1 s. Ling Lia et al. [13] presented a new artificial skin, SkinGest, which integrates filmy stretchable strain sensors and machine learning algorithms for gesture recognition of human hands. The presented sensor has a sandwich structure consisting of two elastomer layers on the outside and one soft electrode layer in the middle. The SkinGest system succeeded in identifying American Sign Language digits 0 to 9 with an average accuracy of 98%.
Hardware Components and System Design
Besides the glove, the hardware components needed are:
Slide potentiometer: The greatest resistance that a slide potentiometer can attain is 10 KΩ. Its output changes based on the displacement or position of a slider or wiper. Typically, the slide pot module comes with a red printed circuit board (PCB), a slider/wiper knob that adjusts the output resistance, and pins for two data outputs. It can connect to form a voltage divider circuit as well. In this study, a slide potentiometer was used to detect finger bending.
Force-sensitive resistor (FSR): a sturdy polymer-thick film device whose resistance varies with force. Force may be measured by this sensor in the range of 1 kN to 100 kN. When greater force or pressure is applied, the resistance of the tactile sensor varies. The sensor acts as an open circuit when no pressure is applied, and resistance reduces with increasing pressure [14]. The area diameters of this sensor are circular and measure 0.16, 0.5, and 1 inches. In this design, the FSR is used to detect contact between the index and middle finger and between the middle and ring finger.
Other components: Arduino Nano, push button, breadboards, 7 (10 KΩ) resistors, levers, elastic rubber band, elastic wrist support, fishing line, heat shrink tube. After combining these components, the system will look like Figure 2.
The designed system.
Create the Data Set
In order to generate the data set, a software called Parallax Data Acquisition Tool (PLX-DAQ) is employed (Figure 3(b)). This is an Excel add-on that gathers data from any Parallax microcontroller up to 26 channels in length and arranges the numbers into columns as they come in. It offers real-time equipment monitoring, laboratory study of sensors, and simple spreadsheet analysis of field data. For the proposed system, eight columns of data are needed, one for each of the seven sensors used, while the eighth one is to define the corresponding letter for the column's values. After finishing collecting the data, the Excel file must be saved as a comma-separated values file with extension (.CSV) for easy processing later, using the Pandas library in Python. Three different data sets were created (Figure 3(a)). The first one with 100 samples for each letter, the second one with 200 samples for each letter, and the third one with 300 samples for each letter. The purpose of these data sets was to show the accuracy improvement of the neural network model when the number of samples increased, as shown in the next sections.
(a) Example from the data set, (b) PLX-DAQ tool.
Neural Network Training and Results
Within the fields of computer science and artificial intelligence (AI), machine learning focuses on utilizing data and algorithms to simulate human learning processes in order to continuously increase a simulation's accuracy [15]. Because it is a network of interconnected pieces, the machine learning branch known as the neural network gets its name from the biological nerve system, which served as the inspiration for these components. Neural networks are an attempt to develop devices that mimic the functioning of the human brain by utilizing biologically inspired components. A neural network's job is to take an input pattern and turn it into an output pattern. A neural network can be trained to perform pattern classification, which is one of the tasks it can be programmed to perform [16]. The neural network used in this research consisted of four layers, an input layer, an output layer, and two hidden layers, each with 13 neurons [17], as shown in Figure 4. Google Colab was used to build and train the neural network and then testing it on data sets. The flow chart in Figure 5 explains the code steps. When the model has completed its training, it can be saved for reuse later again.
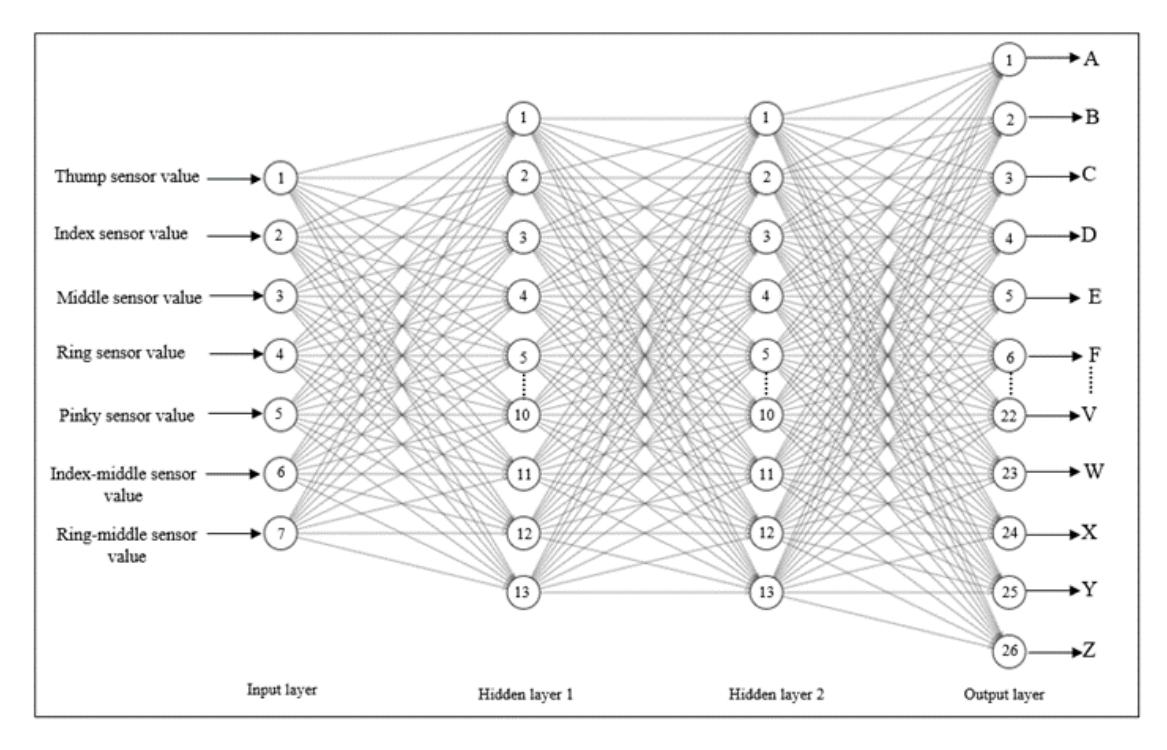
The neural network used.
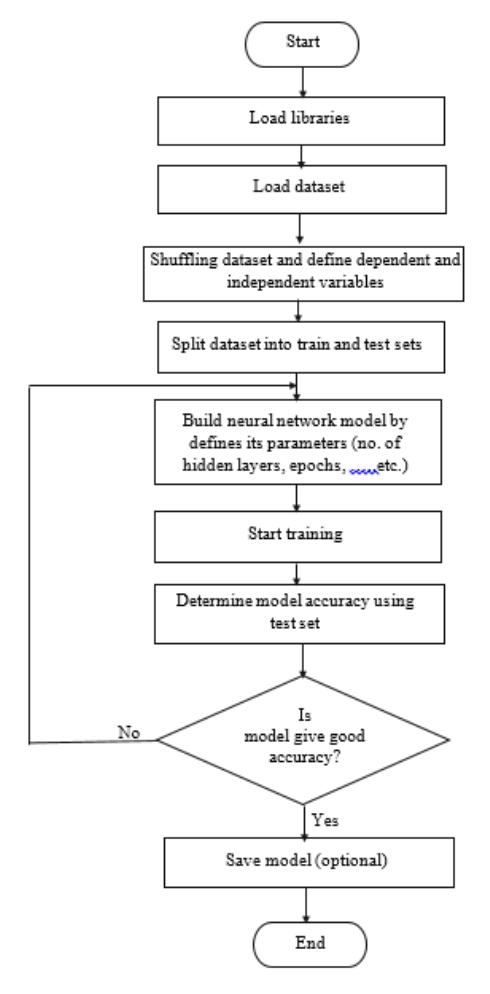
Code steps flowchart.
A wide range of metrics is helpful in evaluating the performance of any multi-class classifier and may also be used to compare two models' performances side by side and examine how varying parameters affect a single model's behavior. Since it contains all the pertinent data on the algorithm and classification rule performance, these metrics are based on a confusion matrix [18, 19].
Confusion matrix: A cross-tabulation table with columns representing the model's predictions and rows representing the true classifications (Figure 1). It shows the frequency of occurrences between two raters as well as the true/actual and predicted classifications. Since the classes are given in the rows and columns in the same order, the correctly categorized items are arranged from the top left to the bottom right on the main diagonal, and their positions correspond to the number of times the two raters agree [20].
| PREDICTED | ||||
|---|---|---|---|---|
| Classes | Positive (1) | Negative (0) | Total | |
| ACTUAL | Positive (1) | TP = 20 | FN = 5 | 25 |
| Negative (0) | FP = 10 | TN = 15 | 25 | |
| Total | 30 | 20 | 50 | |
Confusion matrix for a system with two classes.
Precision: The precision for every class is calculated by dividing the proportion of True Positive elements by the total number of units that were positively predicted (i.e., the sum of the predicted positives in the column). To be more precise, True Positive (TP) components are those that the model classified as positive, but which are genuinely positive, while False Positive (FP) elements are those that the model has classified as positive, but which are negative. It also evaluates the classifier's capacity to exclude unrelated topics [21].
\[Preicsion = \frac{TP}{TP + FP} \tag{1}\]
Recall: The proportion of True Positive elements divided by the total number of positively categorized units (row sum of real positives) determines the recall for each class. Particularly, False Negative (FN) components are those that the model has classified as negative but are, in fact, positive.
\[Recall = \frac{TP}{TP + FN} \tag{2}\]
Accuracy: Accuracy is derived directly from the confusion matrix and is among the most often used metrics in multi-class classification. On the whole set of data, accuracy provides a general indicator of how well the model predicts.
\[Accuracy = \frac{TP + TN}{TP + FN + TN + FP} \tag{3}\]
As the elements on the main diagonal of the confusion matrix the model has correctly classified are called True Positives (TP) and True Negatives (TN) in the accuracy equation's numerator. The denominator also takes into account all the elements outside of the main diagonal that the model has incorrectly classified.
F1-Score: Evaluates the performance of the classification model by combining the Precision and Recall metrics under the harmonic mean notion, beginning with the confusion matrix. The harmonic mean may be utilized to determine the optimal balance between accuracy and recall, as their respective contributions to the F1-score are equal.
\[F1 - Score = 2 \cdot \frac{Recall \cdot Precision}{Recall + Precision} \tag{4}\]
For each one of the three data sets, these metrics were calculated using (classification_report) in Python. Below are the classification report tables and confusion matrix figures for each data set, where Support is the number of actual occurrences of the class in the data set.
Table 1 Classification report for 100 sample data set.
| Precision | Recall | F1-Score | Support | |
| A | 0.944 | 1.000 | 0.971 | 17 |
| B | 1.000 | 1.000 | 1.000 | 21 |
| C | 1.000 | 1.000 | 1.000 | 23 |
| D | 1.000 | 0.824 | 0.903 | 17 |
| E | 1.000 | 1.000 | 1.000 | 18 |
| F | 1.000 | 1.000 | 1.000 | 19 |
| G | 0.941 | 1.000 | 0.970 | 16 |
| H | 1.000 | 0.900 | 0.947 | 20 |
| I | 1.000 | 1.000 | 1.000 | 17 |
| J | 1.000 | 1.000 | 1.000 | 17 |
| K | 0.920 | 1.000 | 0.958 | 23 |
| L | 1.000 | 1.000 | 1.000 | 23 |
| M | 1.000 | 1.000 | 1.000 | 24 |
| N | 0.947 | 1.000 | 0.973 | 18 |
| O | 0.857 | 0.857 | 0.857 | 21 |
| P | 0.875 | 1.000 | 0.933 | 21 |
| Q | 0.667 | 0.615 | 0.640 | 13 |
| R | 1.000 | 1.000 | 1.000 | 21 |
| S | 1.000 | 0.952 | 0.976 | 21 |
| T | 0.900 | 1.000 | 0.947 | 18 |
| U | 0.724 | 0.913 | 0.808 | 23 |
| V | 0.812 | 0.619 | 0.703 | 21 |
| W | 1.000 | 1.000 | 1.000 | 16 |
| X | 0.885 | 0.821 | 0.852 | 28 |
| Y | 1.000 | 1.000 | 1.000 | 19 |
| Z | 0.870 | 0.800 | 0.833 | 25 |
| Accuracy | 0.935 | 520 | ||
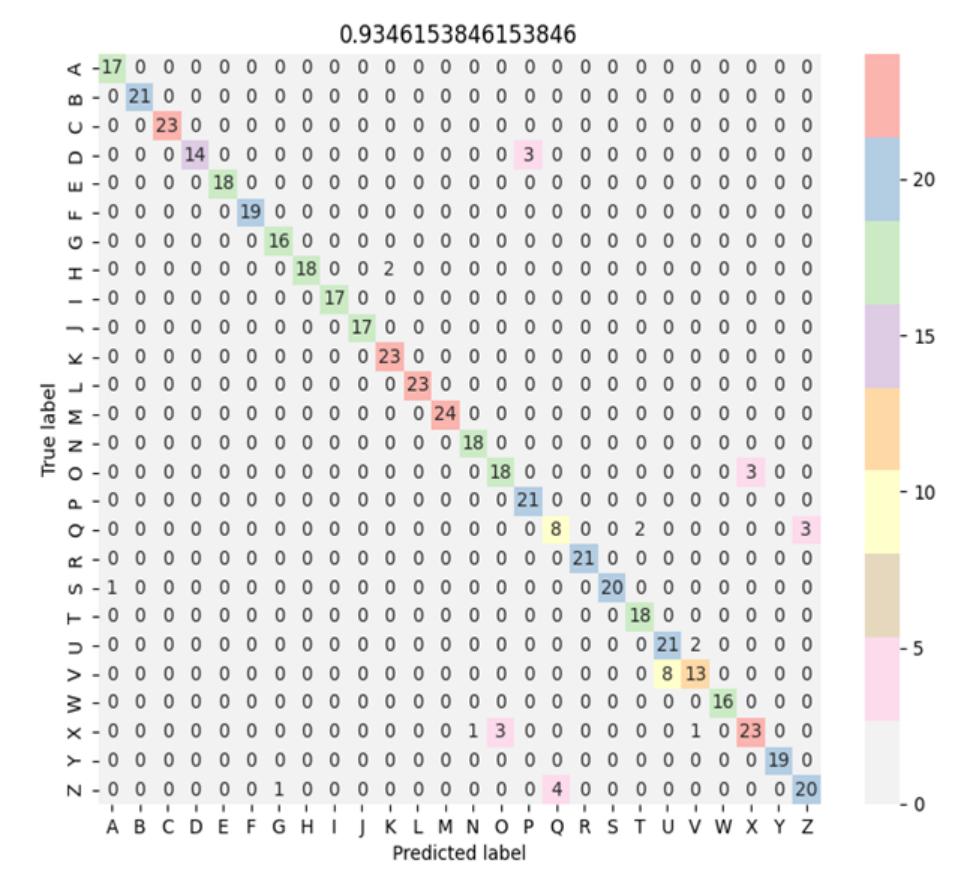
Confusion matrix for 100 sample data set.
Table 2 Classification report for 200 sample data set.
| Precision | Recall | F1-Score | Support | |
|---|---|---|---|---|
| A | 1.000 | 1.000 | 1.000 | 31 |
| B | 1.000 | 0.974 | 0.987 | 38 |
| C | 0.946 | 1.000 | 0.972 | 35 |
| D | 0.837 | 0.923 | 0.878 | 39 |
| E | 1.000 | 1.000 | 1.000 | 51 |
| F | 0.974 | 0.950 | 0.962 | 40 |
| G | 0.830 | 0.907 | 0.867 | 43 |
| H | 0.953 | 1.000 | 0.976 | 41 |
| I | 1.000 | 1.000 | 1.000 | 40 |
| J | 1.000 | 1.000 | 1.000 | 45 |
| K | 1.000 | 0.967 | 0.983 | 30 |
| L | 0.944 | 0.971 | 0.958 | 35 |
| M | 0.953 | 1.000 | 0.976 | 41 |
| N | 0.925 | 1.000 | 0.961 | 37 |
| O | 1.000 | 0.979 | 0.989 | 47 |
| P | 0.886 | 0.816 | 0.849 | 38 |
| Q | 0.886 | 0.830 | 0.857 | 47 |
| R | 0.974 | 0.950 | 0.962 | 40 |
| S | 1.000 | 1.000 | 1.000 | 41 |
| T | 0.957 | 0.917 | 0.936 | 24 |
| U | 0.913 | 1.000 | 0.955 | 42 |
| V | 1.000 | 0.826 | 0.905 | 46 |
| W | 0.921 | 1.000 | 0.959 | 35 |
| X | 0.977 | 0.843 | 0.905 | 51 |
| Y | 1.000 | 1.000 | 1.000 | 45 |
| Z | 0.950 | 1.000 | 0.974 | 38 |
| Accuracy | 0.954 | 1040 | ||
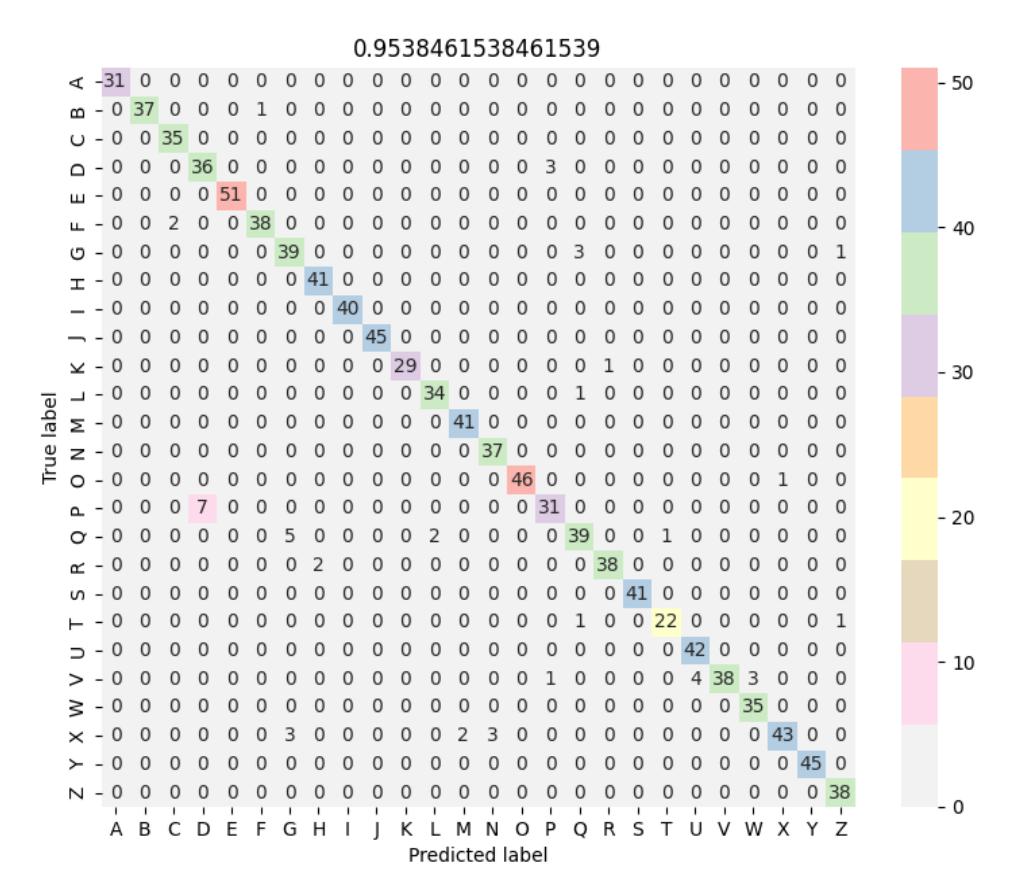
Confusion matrix for 200 sample data set.
Table 3 Classification report for 300 sample data set.
| Precision Recall F1-Score Support A 1.000 1.000 1.000 57 B 0.982 1.000 0.991 55 C 0.944 0.927 0.936 55 D 0.940 0.839 0.887 56 E 1.000 1.000 1.000 56 F 0.969 1.000 0.984 62 G 0.934 0.826 0.877 69 H 0.984 0.969 0.976 64 I 1.000 1.000 1.000 69 J 1.000 1.000 1.000 59 K 0.967 0.983 0.975 60 L 0.983 1.000 0.991 57 M 1.000 1.000 1.000 62 |
|---|
| N 1.000 0.982 0.991 56 |
| O 1.000 1.000 1.000 51 |
| P 0.912 0.969 0.939 64 |
| Q 0.914 0.914 0.914 58 |
| R 0.984 0.984 0.984 61 |
| S 1.000 0.984 0.992 62 |
| T 0.922 1.000 0.959 71 |
| U 1.000 1.000 1.000 67 |
| V 0.966 1.000 0.983 57 |
| W 1.000 1.000 1.000 48 |
| X 0.967 0.967 0.967 61 |
| Y 1.000 1.000 1.000 60 |
| Z 0.953 0.968 0.961 63 |
| Accuracy 0.973 1560 |
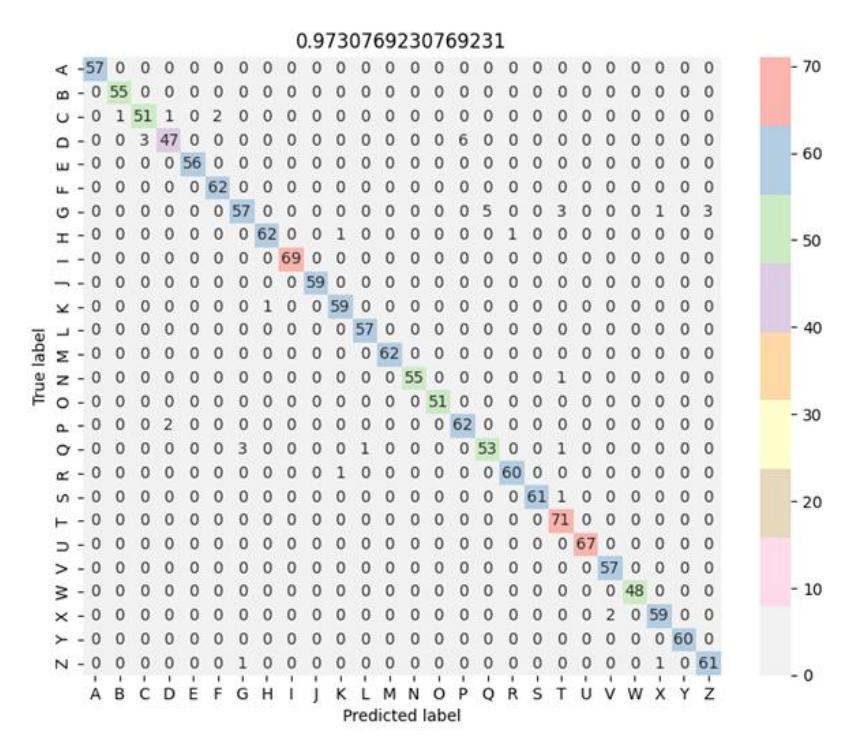
Confusion matrix for 300 sample data set.
The neural network model was saved after finishing training in Colab and was then loaded into Python IDLE for use in a real-time test. Python IDLE was used to take data from the Arduino serial and then predict the result using the pre-trained model. The save and load operation can be accomplished using the Keras library. Table 4 shows the real-time tests for some letters.
Table 4 Real-time test result.
| | DLESH: 336| | File Edit Shell Debug Options Window Help | To detect the letter Please press bush button | values from sensors are : 5 50 61 58 37 1 1 | The letter you entered is: ['A'] | To detect another letter press the button again | A |
|---|---|
| | DLE Shell 206 | File Edit Shell Debug Options Window Help | | | B |
| File Edit Shell Debug Options Window Help values from sensors are: 61 19 13 7 4 1 1 The letter you entered is: ['E'] To detect another letter press the button again | E |
| Values from sensors are: 13 13 10 2 1 0 1 The letter you entered is: ['F'] To detect another letter press the button again | F |
| File Edit Shell Debug Options Window Help values from sensors are : 5 4 40 39 52 0 1 The letter you entered is: ['G'] To detect another letter press the button again | G |
| File Edit Shell Debug Options Window Help values from sensors are: 9 14 35 46 38 0 1 The letter you entered is: ['T'] To detect another letter press the button again | T |
| | DLE SHII 366 | File Edit Shell Debug Options Window Help | | | VIII VIII VIII VIII VIII VIII VIII VII |
| File Edit Shell Debug Options Window Help values from sensors are: 64 7 25 41 33 0 0 The letter you entered is: ['X'] To detect another letter press the button again | × |
Conclusion and Future Work
It appears that improved communication between the deaf and dumb can be achieved through the development of a glove-based sign language interpreter. The major advantage of the system proposed in this paper is using a slide potentiometer for detecting finger bending rather than a flex sensor. All sensors used are placed on a glove. Three data sets are created using the PLX-DAQ tool. The software part of this research is done by using a neural network that was built and trained using Colab and Python as the programming language. The system was tested on the three data sets. The accuracy achieved was 93% for the data set with 100 samples, 95% for the data set with 200 samples, and 97% for the data set with 300 samples. In the end, the proposed system was tested in real time using Arduino serial and Python IDLE.
For future work, the number of samples for each letter can be increased, which may give higher accuracy, and adding one flex sensor on the palm to detect hand bending, which may improve system performance. Also, the overall system can be extended to recognize numbers and words instead of only letters, and additional signs can be added to the data set when the hand is in rest position and there is no sign.