
Introduction
The production of composite laminates for aerospace applications commonly includes utilizing woven fiber materials embedded with pre-impregnated resin systems. Transforming prepreg into composite laminates is primarily divided into two phases [1]. Throughout the first manufacturing phase of pre-forming, layers of prepreg materials are meticulously arranged at a controlled humidity and temperature before being layered in a vacuum bagging mold. Then, vacuum pressure is employed to expel excess air and resin from the mold, thus eliminating voids inside the laminate. In the second phase of the manufacturing process, a curing process takes place, where both heat and pressure are concurrently employed to solidify and unite the composite materials [2]. Generally, pre-forming techniques such as resin transfer molding (RTM), filament winding, liquid molding, and vacuum bagging (VBO) are utilized, while curing is extended through methods including autoclave and out-of-autoclave (OOA) processes, encompassing options like oven, microwave, Quickstep, and more [3-5].
The combination of vacuum bagging followed by autoclave curing has emerged prominently as the most prevailing and efficient approach for generating composite structures featuring minimal void content that are particularly suited for stringent performance criteria, especially in the aerospace industry [6, 7]. Throughout autoclave curing, the trapped air and volatile substances responsible for void formation can be expelled through two approaches: careful selection of pressure intensity and timing, and the process of resin bleeding. However, this processing route has to deal with the limitations of an increment in time consumption of approximately 30 to 50%, the emergence of excessive residual stress (resulting in issues such as composite core crush, skin pillowing, and dimpling), as well as elevated costs by 30 to 50% across capital, production, and operational expenses [4, 8-10]. These limitations have prompted researchers to explore alternative processing methods,
Copyright ©2024 Published by IRCS - ITB J. Eng. Technol. Sci. Vol. 56, No. 2, 2024, 219-230 with vacuum-bagging-only pre-forming and oven curing (VBO-oven curing) standing out as the most relevant shift, effectively eliminating the need for high pressure and the elevated costs of autoclave curing [11-13].
Although this technique has been proved to fabricate composites at reduced cost, the structure seldom attains the necessary mechanical attributes comparable to autoclave-produced counterparts, primarily because of insufficient compression pressure, resulting in higher levels of void content [14, 15]. Given that voids are typically produced throughout the composite manufacturing phase, it is essential to conduct investigations on the effects of variations in processing variables towards the quality performance of the composite produced. Apart from such investigations on the curing processes [16-18], several studies have been conducted on the improvement of VBO pre-forming techniques, for example, on the organization of layup and bagging [19-21].
Kratz and Hubert [22] claimed that the primary problem with VBO-oven curing is to devise a method that can efficiently improve the prepreg permeability in order to facilitate the elimination of entrapped voids before the resin solidifies. The air permeability was claimed to have an inversely proportional relationship to the magnitude of pressure; as the pressure increases, the air permeability is reduced. This phenomenon was ascribed to the reduction in the gas flow path dimensions caused by the applied pressure, consequently leading to a decline in material permeability. Hence, 20 minutes room temperature debulking on each prepreg layup was recommended, which is efficient in removing entrapped air between the plies [20, 23]. Liu and Hubert [24] studied the impact of combining heat treatment with debulking and discovered that the application of heated debulking led to a reduction in the manufacturing cycle time by 26 to 71%. The debulking process, carried out for 120 minutes at 48 ℃, yielded elevated shear strength at 75.98 MPa and lower void content at 2.44%, compared to 16-hour room temperature debulking with a shear strength of 72.36 MPa and a void content of 2.88%. Meanwhile, implementation of a rubber seal as intensifier positioned under the original steel plate intensifier was proved by Xin et al. [25] to facilitate a uniform dispersion of compacting pressure throughout the curing process.
The laminate's surface finish quality is also impacted by various types of mold release agents. Any significant stress transfer between the mold and the laminate can be avoided via release agents such as release spray, wax, and film. A greater strain is anticipated with the absence of a release agent, which leads to unfavorable springin within the laminate [26, 27]. Despite that, the implementation of a release agent, particularly adhesive film, was discovered to restrict the air permeability flow in the through-thickness direction, which reduces the amount of void vented out during curing [15]. Moreover, it was discovered that placing dry glass fibers at the laminate edges as an edge breather will effectively increase the air permeability along the in-plane direction of the laminate [28].
Since the implementation of an autoclave is limited by the high production costs and the excess of residual stress, previous studies have highlighted the importance of vacuum bagging pre-forming for the final properties of the cured composite. Surprisingly, analysis of the impact of individual and combined vacuum bagging oven curing (VBO-oven curing) parameters on thickness, abnormalities, and void content in cured laminates of conventional, inexpensive composite material has not yet been extensively done.
Hence, the objective of this study was to experimentally investigate the effect of vacuum bagging pre-forming parameters towards abnormalities, thickness, and void quality of conventional prepreg material with curing, conducted using an oven. The impact and significance of both individual and combined vacuum bagging preforming processing methods were measured. The impact of individual pre-forming variables as well as their collective effects on a low-cost, conventional-material composite laminate was investigated in an experimental investigation using a two-factor design. An ultrasonic C-scan attenuation paired with a MATLAB image processing algorithm were utilized to evaluate abnormalities within the panels. Thickness measurement was done to determine variation in thickness. Finally, a burn-off test was done to measure the void percentage of the laminate panel. Analysis of variance (ANOVA) was used to analyze the interaction between combined preforming parameters towards void content.
The prepreg material used in this study was commonly fabricated using standard vacuum bagging preforming with expensive autoclave curing, with the composite structure produced proposed for aircraft exterior parts. Therefore, the results and findings obtained from this paper have the potential to be emphasized and applied in the field of composite aircraft manufacturing. Transitioning from the autoclave method to the nearest out-ofautoclave approach, specifically oven curing, has the possibility of significantly lowering manufacturing costs associated with the substantial compaction pressure required in the traditional autoclave curing process. An optimized procedure may be further developed using the optimal condition of these vacuum bagging preforming parameters.
Experimental Materials and Methods
Materials
The glass/epoxy plain weave prepreg Cycom 7668/7881-1 (Cytec Engineered Materials Inc.) was employed in this investigation. The prepreg was produced via the hot-melt technique and was found to have outstanding thermal stability, excellent flammability, remarkable tensile and compressive quality characteristics throughout serviceability. Cycom prepreg is conventionally cured in an autoclave for composite laminate and sandwich structures specifically for aircraft exteriors.
Fabrication of Composite Laminates
The kitting of the prepreg was done in a composite control room, where square prepreg panels of 30 × 30 cm were prepared. Nine prepreg plies were laid up and then the VBO pre-forming process took place with different bagging setup arrangements. A 2 4 full factorial experimental design was employed to examine four variables: vacuum debulking, various types of release agents, intensifier usage, and edge breather. Each of these factors was employed at two different levels, leading to a total of 16 unique processing combinations.
Figure 1 illustrates the variations in the vacuum bagging method. For the standard or baseline bagging procedure in Figure 1(a), the prepreg plies were placed on a flat aluminum mold, with a release film positioned in between the initial prepreg ply and the mold. The other consumables were positioned over the laminate panel in the following sequence: RF260 non-perforated release film (Tygavac Advanced Materials), Airweave N10 bleeder cloth (Airtech Advanced Materials) and WL7400 vacuum-bag (Airtech Advanced Materials). GS2131/2 sealant tape (General Sealants Inc.) was subsequently utilized to seal the vacuum bagging edges. A vacuum port was employed to extract air from the sealed bagging system.
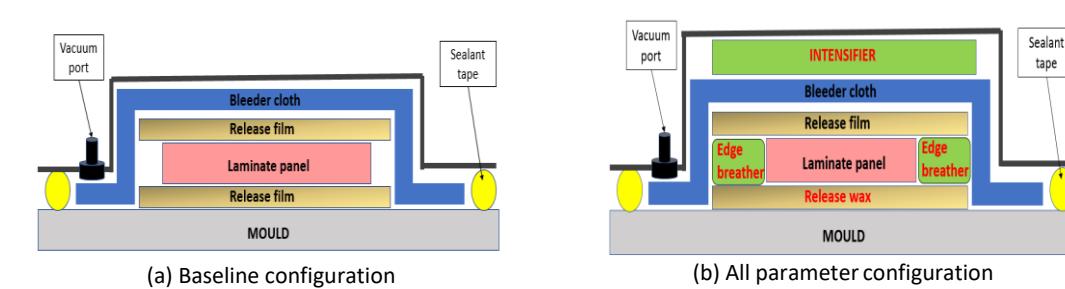
The different configurations for the vacuum bagging process.
In the all parameter configuration (Figure 1(b)) of laminate 14, release wax (TR-104 High Temperature Mold Wax) was used instead of release film. A thin coat of release wax is spread onto the prepared mold using a cloth or sponge, employing a circular motion. This method was repeated five times with a 10-minute interval between each repetition, allowing the wax layer to fully dry. A 1-kg stainless steel plate was employed as intensifier, placed on top of the bleeder cloth to boost the contact pressure. Vacuum debulk was carried out during the layup process, employing a Shanghai Jingke Scientific Instrument vacuum pump, which achieves an ultimate vacuum level of 5 Pa. Each individual prepreg layup received a low vacuum pressure of approximately 3.86 kPa for a duration of 20 minutes at room temperature. This process was continued until all nine prepreg plies had been laid up. Strips of Tygavac Y-0094 dry glass fiber with 10 mm thickness and 25 mm width was used as the edge breather, positioned at every laminate edge. The breather facilitated the removal of voids, trapped air, and excess resin from the laminate plies in the horizontal direction.
The laminates underwent an identical curing process conducted in a Grieve WRC 566-500 oven, which maintained a constant vacuum pressure via a primary vacuum pump throughout the curing process. Curing involved a 120-minute dwell period at a temperature of 180 ± 12℃, with heating and cooling rates of 2 ℃ per minute. Throughout curing, a primary vacuum pump was linked to the vacuum bag to maintain the vacuum within the bagging system. Cure panel removal took place after the temperature had been slowly decreased to 60 ℃.
Testing and Analysis
Thickness Analysis
Thickness measurement was performed at ten distributed points on the laminates using a vernier caliper. Average values were calculated to measure thickness variations in the composite panels following the curing. The thickness uniformity was assessed through the computed standard deviation derived from ten measured values for each panel. A high standard deviation indicates a significant variability in the thickness values across the laminate panels.
Ultrasonic C-scan Analysis
An ultrasonic C-scan analysis was conducted via the SONIC-138 VFD equipment (Physical Acoustic UK with UTwin ultrasonic acquisition) with quadrilateral penetration in water immersion mode. The scan was conducted using a 100-MHz ultrasonic fault detector to produce a true-to-size map of the composite panel, with distinct colors assigned to various levels of attenuation. Scanning at 10 dB gain in transmission loss, 3.15 mm/nanosecond of longitudinal velocity, and 1.727 mm/nanosecond of shear velocity were utilized. A MATLAB algorithm was employed for digital image processing to examine the presence of anomalies in scanned images of laminates. This process involved distinguishing and identifying colors within the JPEG image. Profile graphs were generated based on the RGB (red, green, and blue) intensities, and the choice of image proportions was made using the initial scanned image. The characteristics denoted by the RGB colors were established as signifying samples with either no or minimal anomalies, a moderate scattering of anomalies, and a substantial concentration of anomalies, respectively.
Image filtering involved converting the image into binary format by selecting a gray threshold to segment and distinguish the irregularities in accordance with the black template image. By applying an appropriate threshold value, a binary image was generated using the profile graph plotted according to the binary intensity. This binary image accurately represented abnormalities within the grayscale figure. The profile graph calculates the intensity values along the lines within the image. Subsequently, the percentage of matching figures was computed by assessing the alignment of black and white spots present at the binary image position.
Burn Off Test
In compliance with ASTM standard D 3171-99, four samples measuring 10 × 20 mm were grinded and polished before the burn-off test. The specimen was weighed before undergoing the burn-off process in a Vecstar Naber Therm NII F-24389 muffle furnace at a temperature range of 565±30 °C for six hours. This procedure effectively eliminated the matrix material, resulting in the retention of the fiber only. Subsequently, the remaining fiber was allowed to reach room temperature within desiccators, and a final weight measurement was taken to determine the composite laminate's void percentage.
Results and Discussion
C-scan and Thickness Analysis
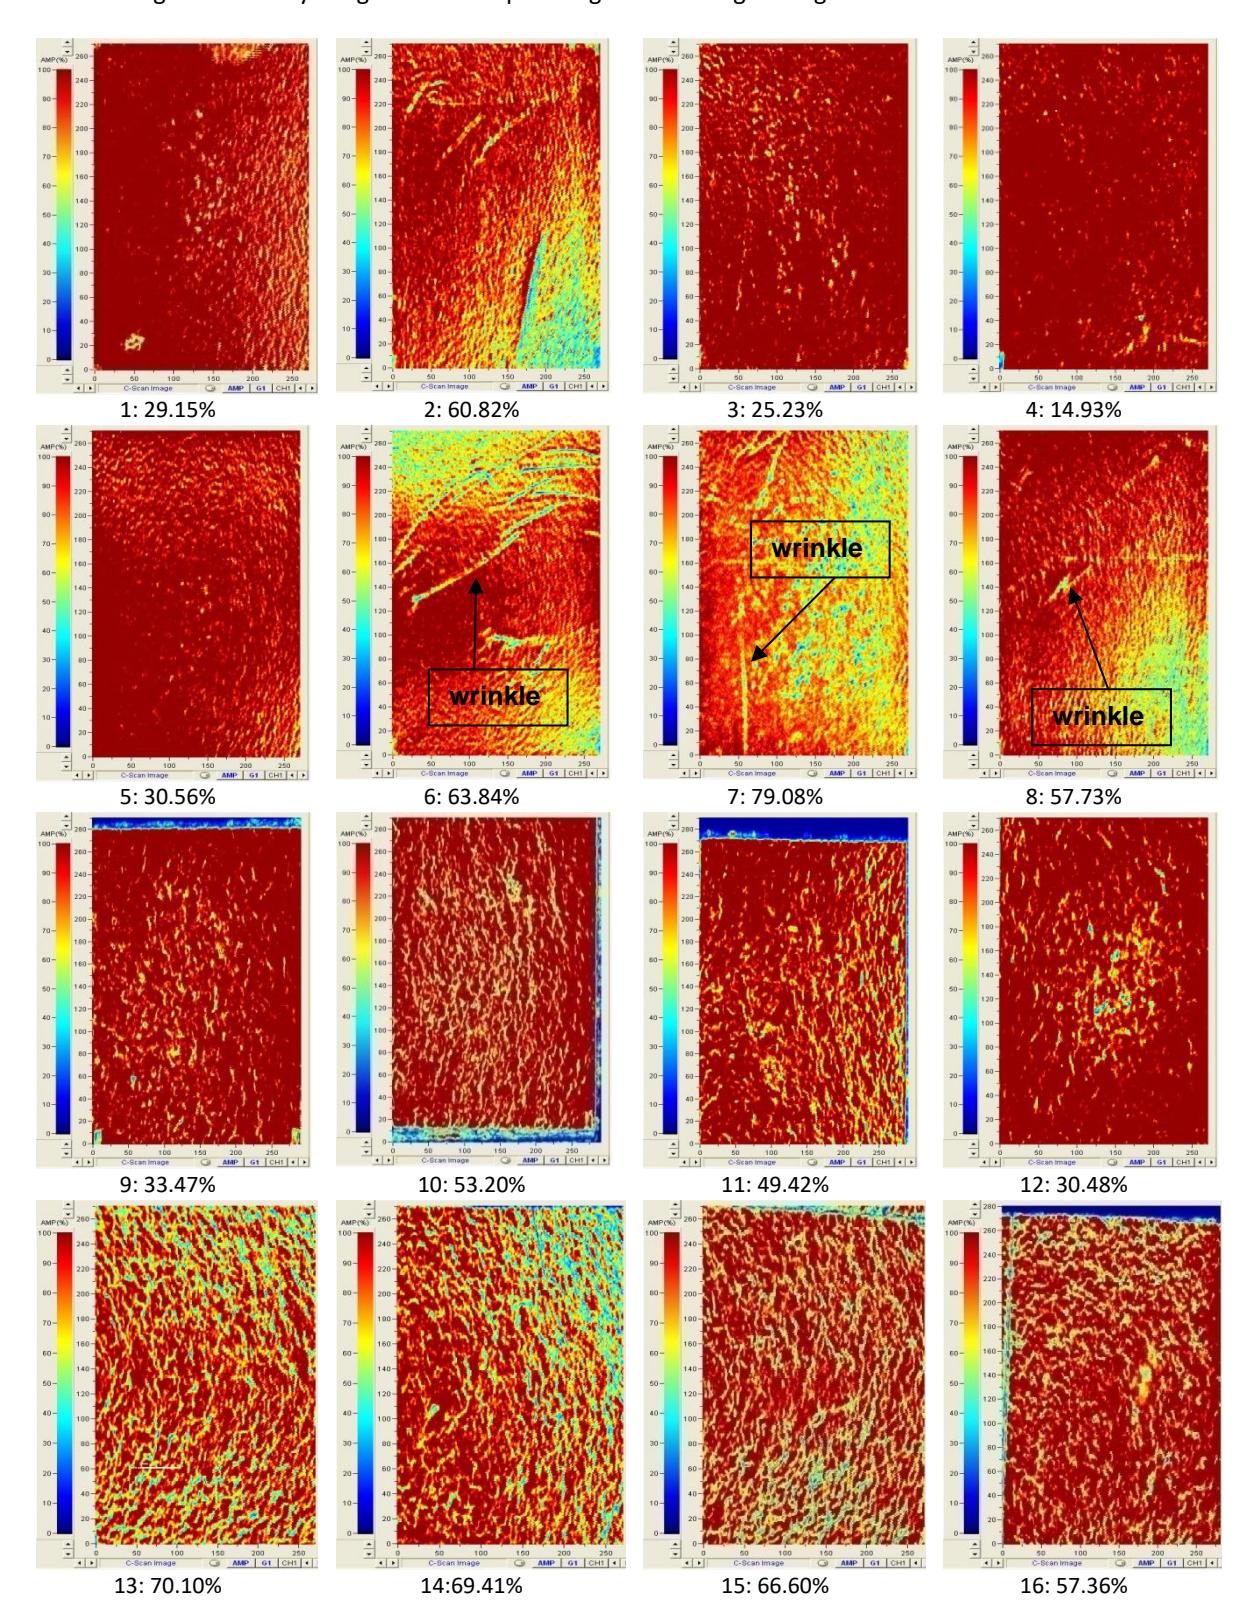
Figure 2 shows C-scans of 16 laminate samples, with variations of color contours, indicating the quality level of the panels. The color variations were illustrated in RGB (red, green, blue) intensities. For C-scan images generated from C-scan analysis, other than the red colored sections, represent all the abnormalities within the produced laminate panels. These abnormalities can include summation of wrinkles, non-uniform thickness, porosity, voids, inclusions, de-laminations etc., which cannot be differentiated with only C-scan attenuation
analysis. Therefore, in order to calculate the absolute abnormalities percentage, an image processing algorithm was employed, where the measured abnormalities percentage is indicated under each C-scan image in Figure 2. These percentages were calculated based on preprocessing image analysis, where image conversion, filtering, and matching of the binary images were computed against the target image.
C-scan images and abnormalities of laminate samples.
The analysis revealed that the proportion of abnormalities within the laminates was within the range between 14.93% and 79.08%, correlating with the different processing routes. Laminates 7, 13 and 14 had the highest abnormality percentages at 79.08%, 70.1% and 69.41%, respectively. On the other hand, the lowest abnormality percentages recorded were for laminates 4, 3 and 1 at 14.93%, 25.23% and 29.15%, respectively. The average value of the abnormality percentages in this study was 49.46%.
It was clearly observed that wrinkles were seen in the C-scan images of laminates 6, 7 and 8, where yellow lines are apparent on the red template images. These wrinkles increased the abnormality percentages for laminates 2, 6, 7 and 8, with high calculated percentages of 60.82%, 63.84%, 79.08% and 57.73%, respectively. The wrinkles were developed on the laminate surface from the consumables, such as bagging film, breather, or release film during the layup and/or bagging process (i.e., consumable placement or vacuum suction process), which generally affect the physical quality of the laminate.
Thickness analysis was then carried out to determine variations in thickness throughout the laminate following the different processing routes. The thickness consistency is illustrated by the calculated standard deviation of the 10 thicknesses measured for each panel in Figure 3. A high standard deviation value resembles high variation in thickness values for each laminate panel. The recorded standard deviation was found to be in the range between 0.015 and 0.115 mm. The highest standard deviation thicknesses were observed for laminates 7 (0.115 mm), 14 (0.091 mm), 13 (0.090 mm) and 16 (0.090 mm). These values were highly consistent with those in the previous results (shown in Figure 2), while the abnormality percentages of these laminates was also considered high, at 79.08%, 69.41%, 70.1% and 57.36%, respectively.
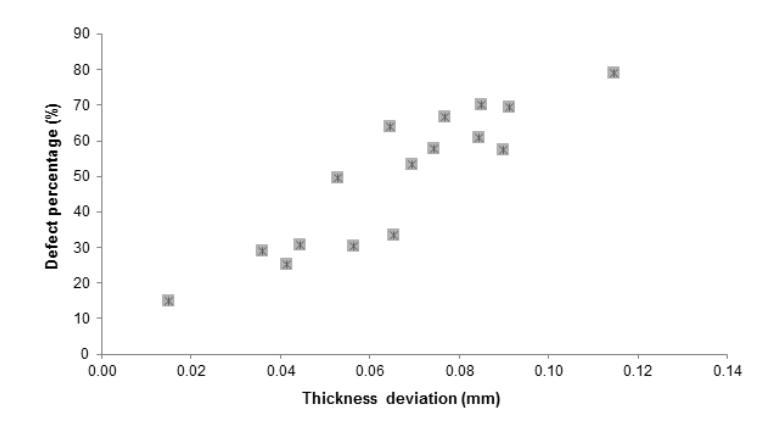
Plot of standard thickness deviation with abnormality percentages.
Meanwhile, the lowest standard deviation was recorded for laminates 4 (0.015 mm), 1 (0.036 mm) and 3 (0.041), where the abnormality percentages were considered lowest with values of 14.93%, 29.15% and 25.23%, respectively. This shows that the standard deviation of laminate thickness had a nearly proportional relationship towards the abnormality percentages. It was observed that a higher standard deviation of the thickness yielded a higher abnormality percentage for the C-scan results, which also resembled the total discontinuities and nonuniformities within the whole panel. Roughness of the laminates, which also resembled the non-uniformity in thickness, was also seen for laminates 13, 14, 15 and 16, where the distribution of numerous yellow dots can clearly be seen in the C-scan images in Figure 2 above. Since resin pockets, wrinkles, cross stitches, voids, tow spread, etc. affect the energy reflection and orientation during the scanning process, C-scanning alone is insufficient to characterize the void percentage in the laminate. Hence, the measurement of the void content requires a more specific test following an ASTM standard, such as burn off, which is discussed in the next subsection.
Optical observation revealed that laminate 7, characterized by the highest thickness variation of 0.115 mm and abnormality percentage at 79.08%, displayed an uneven surface roughness. Conversely, laminate 4 exhibited a smooth surface roughness, showcasing the least thickness variation and abnormality percentage of 0.015 mm and 14.93%, respectively. These findings indicate a significant interdependence among the physical
characteristics investigated. Specifically, a correlation was observed wherein increased thickness variation led to higher abnormality percentages, consequently contributing to a diminished surface quality of the laminate panel.
Void Percentage Analysis
The results for the void content obtained through the burn-off test are tabulated in Table 1. The void content ranged from 5.74% to 8.36%, with the highest void content observed in laminate 3 (baseline laminate), which was fabricated using the standard pre-forming processing route. The void content was found to be lowest when using both edge breather and wax mold release together. This specific processing integration improved the permeability in both the horizontal (edge path) and the perpendicular (gel-liquid property) direction.
Throughout the cure process, the release wax liquefies and serves as a 'lubricant', creating routes for entrapped voids to escape in the perpendicular direction. When a comparison was made with the processing methods using release film – although at a highest curing temperature of 180 °C – the release film (with a melting point of ±260 ℃) still remained in a solid condition and acted as 'dam' and 'airlock' between laminate and film, preventing bleeding-out of voids. Due to this, the void content was decreased when a wax mold release was employed in the pre-forming procedure. Another contrary finding was that higher void contents were documented when there was an absence of release wax and edge breather in the processing configuration. This underlines the beneficial impact of these parameters on the void quality of the composite laminate.
| Trial | Void percentage | ||||
|---|---|---|---|---|---|
| Debulk | Mold Release | Factor Edge Breather | Intensifier | (%) | |
| 1 | No | Wax | No | No | 7.43 |
| 2 | Yes | Wax | No | No | 6.88 |
| 3 (baseline) | No | Film | No | No | 8.36 |
| 4 | Yes | Film | No | No | 8.00 |
| 5 | No | Wax | Yes | No | 6.02 |
| 6 | Yes | Wax | Yes | No | 6.91 |
| 7 | No | Film | Yes | No | 7.43 |
| 8 | Yes | Film | Yes | No | 7.44 |
| 9 | No | Wax | No | Yes | 6.77 |
| 10 | Yes | Wax | No | Yes | 7.53 |
| 11 | No | Film | No | Yes | 7.21 |
| 12 | Yes | Film | No | Yes | 8.10 |
| 13 | No | Wax | Yes | Yes | 5.81 |
| 14 | Yes | Wax | Yes | Yes | 5.74 |
| 15 | No | Film | Yes | Yes | 6.06 |
| 16 | Yes | Film | Yes | Yes | 7.79 |
Table 1 Void content obtained via burn-off test review.
Analysis of Variance (ANOVA)
Table 2 shows the evaluation of the substantial influence of individual and combined input variables on the output response via ANOVA. When the calculated P-values of the models were calculated below 0.1, it signified that the model terms held statistical significance. Within this scenario, factors B and C were signified as the highest contributions towards the void content, which is further shown in Figure 4.
It was observed that only five interactions of AA, BB, CC, DD, and AD were plotted in the contribution bar plot of Figure 4. These factors with P-values smaller than 0.5 indicate that the model terms were statistically significant. While the cumulative contribution of significant model terms amounted to only 82.85%, the remaining 17.15% was attributed to minor, insignificant contributions arising from the interaction of 10 other insignificant factors. Consequently, the ANOVA analysis revealed that factors B (32.18%) and C (30.18%) exhibited the highest contribution percentages compared to the other model terms. Meanwhile, factors A (debulking), D (intensifier), and AD contributed 6.64%, 7.19%, and 6.66%, respectively.
| Source | Sum of Squares | • | ree of edom | Mean Square | F-value | P- value | |
|---|---|---|---|---|---|---|---|
| Model | 9.11 | 8 | 1.14 | 6.55 | 0.011 | ||
| A-A | 0.69 | 1 | 0.67 | 3.95 | 0.087 | ||
| B-B | 3.32 | 1 | 3.32 | 19.11 | 0.003 | ||
| C-C | 3.11 | 1 | 3.12 | 17.92 | 0.004 | ||
| D-D | 0.74 | 1 | 0.74 | 4.27 | 0.078 | ||
| AD | 0.69 | 1 | 0.69 | 3.96 | 0.087 | ||
| Residual | 1.21 | 7 | 0.17 | ||||
| Total | 10.33 | : | 15 | ||||
| Std. Dev. | N | Mean | C.V. % | PRESS | |||
| 0.427 | 7.09 | 5.88 | 6.36 | ||||
| R-Squared | R-Squared Adj R-Squared | Pred R-Squared | Adeq Precision | ||||
| 0.88 | 0.75 | 0.38 | 8.11 | ||||
Table 2 ANOVA for void percentage.
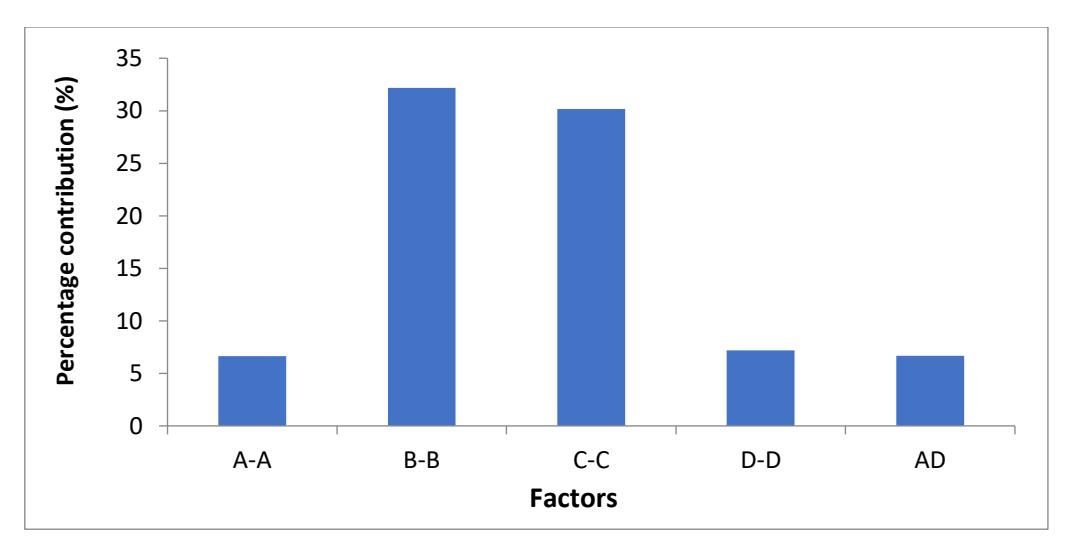
Figure 4 Bar plot of factor contribution percentages towards void content.
Figure 5 illustrates the primary impacts of the pre-forming variables on the composite panel void percentage. The investigation revealed that wax mold release, edge breather, and intensifier reduced the void content, where edge breather and release wax had the strongest influence on this quality enhancement, with a void content reduction of 11.87% and 12.93%, respectively. Edge breather is claimed to enhance the in-plane permeability path, while wax provides an inter-plane path for the entrapped air to be evacuated. The employment of intensifier reduced void content by 6.85%, while debulk and release film had a negative effect on the laminate, where void content was increased by 6.57% and 13.53%, respectively.
Even though debulking was claimed to evacuate the entrapped air and reduced the void size [22], the void content versus debulk plot in the figure shows that the single factor of debulking the prepreg layup during resin B-stage phase was inappropriate, as the path for in-plane air permeability was blocked after compaction [25]. Nonetheless, the integration of the debulking method with intensifier, edge breather, and release wax has the potential to further minimize the void content. According to the second plot, depicting void content versus mold release, it was determined that wax mold release is a more favorable choice as release agent in vacuum bagging, considering the resulting void content. This is attributed to the fact that release film acts as an inter-plane dam between mold and laminate, hence, excess resin and entrapped voids are obstructed from being evacuated.
Meanwhile, wax acts as inter-plane permeability pathway for the excess resin and entrapped porosity to be evacuated out from the laminate. The third plot illustrates that the use of an edge breather enhances the permeability pathway horizontally. An edge breather offersseveral advantages in the oven curing of composites, namely, enhanced permeability in the in-plane direction, improved pressure distributions and amplified resin flow, all of these assisting in the void removal process during curing. Meanwhile, in the last plot of void content versus intensifier, it can be seen that the intensifier supplies additional compaction throughout curing and subsequently facilitates resin flow within the laminate. As a result, this aids in proper fiber wetting, improved cure uniformity, enhanced fiber-matrix attachment, which reduce the void content in the produced composite laminate.
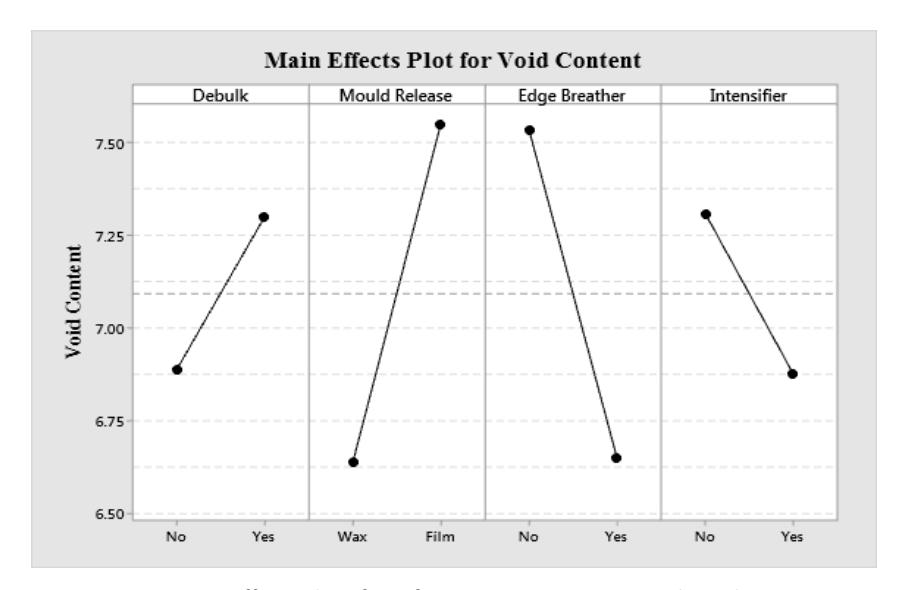
Main effects plot of pre-forming parameters towards void content.
Nonetheless, as we further analyzed the combinations of the 16 designed processing routes, there were four interactions of the combined factors present, as illustrated in Figures 6 and 7. The interaction plot in Figure 6(a) indicates that in cases where an edge breather and release film were used in panel production, the inclusion of an intensifier led to a higher void content compared to panels produced without it. In addition, the inclusion of an edge breather, wax, and an intensifier in the processing method produced composite laminates with the lowest void content compared to similar panels made with the absence of an intensifier. Using an intensifier could potentially intensify the formation of airlocks and create a 'dam' effect caused by the release film, consequently entrapping voids in the middle of the laminate and release film due to the blockage of permeability in the vertical direction. The trapped air can only escape from the laminate via the assistance of an edge breather through the horizontal direction. The void content is then reduced by combining wax with an intensifier because the intensifier enhances the inter-plane permeability when the wax has completely melted and reaches its lowest viscosity state. This improves the likelihood of trapped air being expelled.
As previously highlighted, the use of debulking alone produced a negative effect on the void content. However, when the technique was integrated with release wax, an edge breather, and an intensifier, as illustrated in Figure 6(b), this processing route yielded the lowest void content at 5.74%. Following debulking, the size of the entrapped voids was getting relatively smaller and these were then easily removed with the aid of an edge breather, as the coplanar permeability was broadened. These findings could provide a basis for further development of an optimized processing route using these four factors.
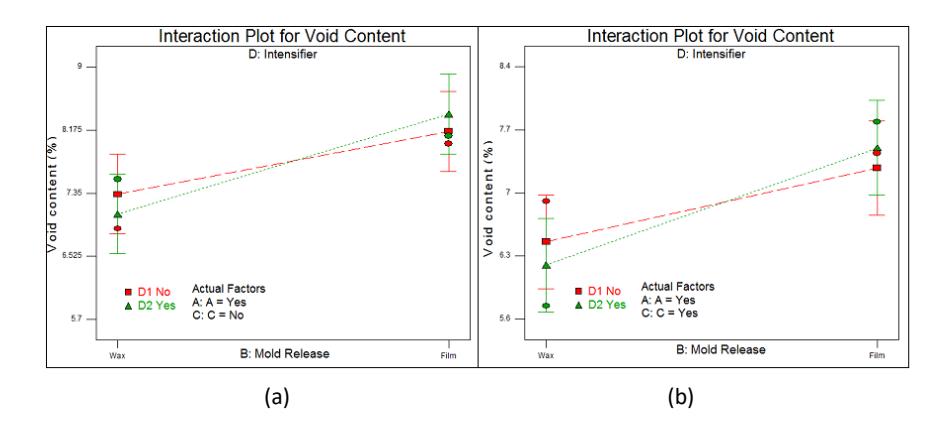
Interaction plots of mold release and intensifier with: (a) edge breather, (b) edge breather, and debulking.
Furthermore, the interaction plots in Figure 7(a) show that the void content was reduced when only either debulking or an intensifier was included together with a mold release film. The study revealed that an intensifier and debulking had an impact on permeability exclusively in the inter-plane direction. The joint use of debulking and an intensifier could potentially exacerbate the horizontal barriers initially created by the release film. These barriers create air-sealed pathways in the middle of the laminate and release film, thus restricting the elimination of voids and volatiles throughout the curing process.
Figure 7(b) displays a comparable plot configuration to Figure 7(a) but with a reduced void percentage. In this case, the presence of an edge breather enhanced the in-plane permeability of the laminate panel. The edge breather improved the air pathway, facilitating the extraction of voids and trapped air through vacuum suction during curing. Utilizing the breather cloth directly on the edges of the laminate served as an effective perimeter medium to establish the horizontal permeability pathway from the layers of the laminate towards vacuum suction. Consequently, in this research work, all composite panels produced with the employment of a glass fiber edge breather showed a decrease in void percentage. Conclusively, an edge breather and wax release were found to have the greatest effect on the void volume fraction of the laminate panels by improving the in-plane and through-thickness permeability and breathability path, respectively, for evacuation of entrapped air within the composite.
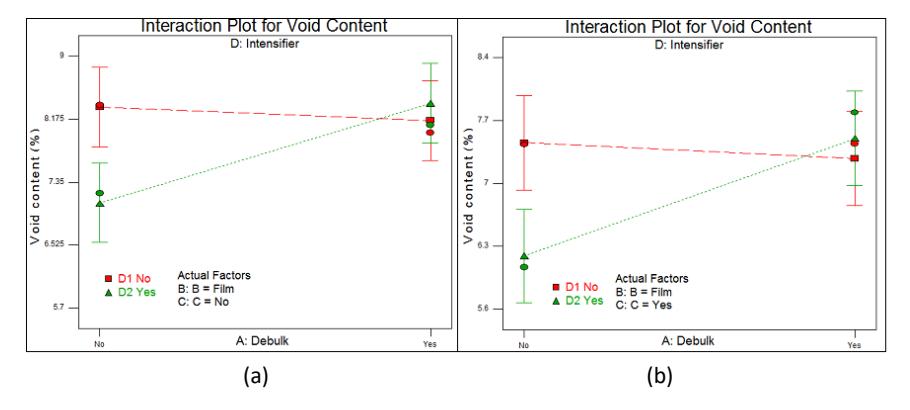
Interaction plots of debulking and an intensifier with: (a) release film, (b) release film and edge breather.
Conclusion
An experimental investigation was carried out to measure the impact of individual pre-forming parameters as well as their combined effects on abnormalities, thickness, and void quality of composite laminates. A factorial design based on four factors, i.e., debulking, mold release type, intensifier, and edge breather, was proposed for 16 different processing routes, to establish the interaction between the combined factors.
It was observed that a higher thickness standard deviation yielded higher abnormality percentages in the C-scan results, which also resembled the total discontinuities and non-uniformities within the whole panel. The highest voids were found in the laminate produced via the conventional pre-forming process (baseline configuration). Wax mold release, edge breather, and intensifier contributed to a reduction in void content within the laminates at approximately 11.87%, 12.93% and 6.85%. However, the use of vacuum debulking and release film had detrimental consequences for the laminate, leading to an elevation in void content by 6.57% and 13.53%, respectively. Combining all four factors in the processing routes resulted in the lowest void content, suggesting that an optimized procedure could be further developed using the optimal conditions of these four processing parameters.
Acknowledgement
The authors would like to thank the Ministry of Higher Education, Malaysia and Universiti Teknologi Petronas, Malaysia for their financial support for this research work through YUTP Research Grant [015LC0-057].