
Introduction
In many structural applications, high strength and toughness are crucial requirements, without compromising safety, durability, and reliability in the application [1]. Various components in the aerospace, automotive, and railway industries applications are fabricated from stainless steel because of its ability to withstand hightemperature applications and resistance to corrosion and creep [2]. For instance, Stainless Steel 304 has great weldability, high ductility, and strength [2] together with ease of fabrication, despite its aesthetic quality [3]. Another widely used material is aluminum alloy because of its high strength and damage tolerance. Crashworthiness is a crucial aspect of vehicle structure designs, serving two key functions: crash management and occupant protection. Crash management is about the vehicle structure's ability to absorb energy during an accident, while occupant protection focuses on keeping the passengers safe from the collision impact [4]. In crashworthiness studies, energy absorption (Ea) is a key factor in structural design [5]. The specific value of Ea is determined by the integration of the load-displacement curve as follows:
\[E_a = \int_0^{\delta max} P(\delta) d\delta \tag{1}\] where P(δ) is the prompt impact load, δ is the compressing displacement and δmax is the maximum compressing displacement.
Aluminum foam is commonly employed as an alternative material for energy-absorbing devices [6-7]. Particularly, heat-treated Aluminum Alloy 6061 and Aluminum Alloy 7075 are known for their light weight and
Copyright ©2024 Published by IRCS - ITB J. Eng. Technol. Sci. Vol. 56, No. 3, 2024, 329-339 ISSN: 2337-5779 DOI: 10.5614/j.eng.technol.sci.2024.56.3.2
Faculty of Industrial and Manufacturing Engineering Technology, Universiti Teknikal Malaysia Melaka, Hang Tuah Jaya, 76100 Durian, Malaysia
strength, along with their ease of formability for complex shapes and parts [8]. Specifically, 7075-T6 alloy possesses higher yield and ultimate strength, with slightly higher density than the 6061-T6 alloy [9]. In automotive applications, approximately 25% to 30% of a vehicle's weight consists of aluminum components; most of which are fabricated from 5000 and 6000 series aluminum alloys. Meanwhile, in the aerospace industry, 7000 series aluminum alloys, particularly 7050 and 7075, are extensively used due to their ideal strength-to-weight ratio, making them suitable for security crash components and also providing cost-effective solutions in terms of cost per kilogram saved [10].
The Charpy test is a standardized test to assess a material's toughness or impact strength. During the impact test, a pendulum hammer swings and strikes the specimen and the impact energy is measured when the specimen breaks. Depending on the striker's height and mass, the impact velocity typically ranges from 5 to 5.5 m/s, with corresponding strain rates of \(10^{-1}\)s<sup>-1</sup> [11]. Theoretically, the Charpy impact energy absorbed is measured as the difference between the height of fall and the height of rise, as depicted in Figure 1. The energy absorbed is expressed in Eqs. (2) and (3). The higher the height of rise, the greater the energy absorbed.
Figure 1 Dimensions for calculation, ASTM E23 [12].
\[U = mg(h - h^1) (2)\]
\[U = mgS(\cos\beta - \cos\alpha) \tag{3}\] where U is the absorbed energy, m is the pendulum mass, g is gravity, h is the initial elevation of the striker, \(h^1\) is the height of rise, S is the length of the pendulum distance to the center of the striker, \(\theta\) is the angle of fall, and \(\alpha\) is the angle of rise.
An instrumented impact test involves the use of a sensor or transducer, which helps measure and record various parameters such as displacement, strain, force, and acceleration. The utilization of the instrumented Charpy device provides additional data on the material mechanical response, enabling a better understanding of the impact phenomenon [13, 14]. For example, the force-displacement curve can be obtained to understand the material's behavior and the changes when the striker hits the material [15, 16]. This study used a strain gauge as the device to measure strain in the impact test. A strain gauge works by measuring the strain related to the change in the electrical resistance [17]. Strain gauges have been extensively used in many applications, such as capturing the signal of vehicle suspension components for fatigue signal analysis [18, 19], and measuring and recording the strain response of wheel impact [20]. Embedded strain gauges have been used in pavement layers for pavement monitoring and health evaluation [21], measuring soil movement along pile shafts [22] as well as detecting damage in an aircraft composite sandwich structure [23].
The present study followed an experimental method used in previous studies, where the strain gauges were placed on the impact strike and the strain signals were recorded later to obtain the energy absorbed value [24-26]. This study presents variations of materials tested with the instrumented Charpy impact test, namely Stainless Steel 304, Aluminum Alloy 6061-T6, and Aluminum Alloy 7075-T6. The Charpy machine records the energy absorbed value and the impact strain signal is simultaneously recorded during the impact test. These findings are important in studying the impact response of each material under the instrumented impact test.
Additionally, the results demonstrate different signal patterns from each material, corresponding to the impact duration and area under the curve.
Methodology
Experimental Work
In this study, the materials selected were Stainless Steel 304 (SS 304), Aluminum 6061-T6 (AA 6061-T6), and Aluminum 7075-T6 (AA 7075-T6). These three materials were chosen because they are frequently used in structural applications in architecture and the construction, automotive, and aerospace industries. The material properties are given in Table 1.
| Material | |||
|---|---|---|---|
| Stainless Steel | Aluminum | Aluminum | |
| 304 | 6061-T6 | 7075-T6 | |
| Tensile strength (MPa) | 603.81 | 314.40 | 582.10 |
| Yield strength (MPa) | 306.35 | 260.57 | 510.85 |
| Young's modulus (GPa) | 193 | 70 | 72 |
| Density (kg/m3 ) | 7800 | 2710 | 2800 |
Table 1 Material properties [27-28].
In the instrumented Charpy test, the specimens were prepared according to the American Society for Testing and Materials, specifically the Standard Test Methods for Notched Bar Impact Testing of Metallic Materials, ASTM-E23. The specimen had a standard size of 55 mm in length, with a height and width of 10 mm respectively. It was a V-notch type with a 45° notch, a root radius of 0.25 mm, and a depth of 2 mm. Three samples were prepared for each material. An actual specimen is shown in Figure 2.
Specimen used in the test.
The Charpy machine pendulum in this experiment has a capacity of 250 Joules and an impact speed of 5.24 m/s. The overall instrumented Charpy impact consisted of the apparatus and instruments presented in Figure 3. Before executing the experiment, the strain gauge was glued onto the sides of the pendulum impactor as illustrated in Figure 3(c). The strain gauge used was a 2-mm length KYOWA strain gauge. SOMAT eDaq lite data acquisition was used to collect the strain signal along with a laptop for data display purposes. The Charpy machine was also connected to a computer and equipped with the WinImpact software application. WinImpact is mainly used to record the basic information and data of the impact test, as shown in Figure 4.
Apparatus and instruments used in Charpy test: (a) 250 J Charpy machine, (b) strain gauge, (c) strain gauge glued onto the impactor, (d) data acquisition system (eDAQ), (e) laptop computer for result display.
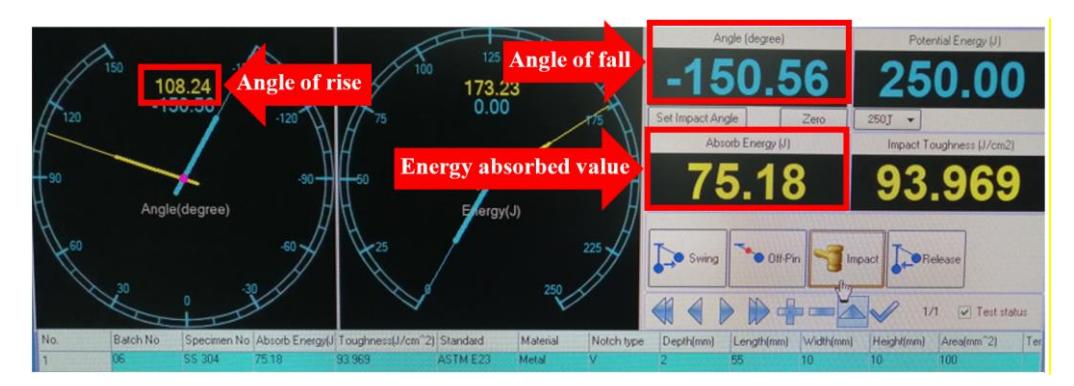
Example of the WinImpact display; showing valuable data, the angle of fall, angle of rise and the absorbed energy value.
Data Analysis
This section explains the method used in the data analysis. The experimental value of energy absorbed was measured by the Charpy machine's scale and simultaneously recorded digitally by the WinImpact software, as shown in Figure 4. During the impact test, the software displayed the angle after the impact experiment (angle of rise). The impact signal was presented as a strain-time curve, as exemplified in Figure 5. The figure shows the impact duration, which is defined as the time difference between the time at the point where the material starts to deform until it fractures. The area under the curve is derived from the shaded area as illustrated in the graph in Figure 5. Meanwhile, the maximum strain value is identified at the highest peak of the strain-time curve.
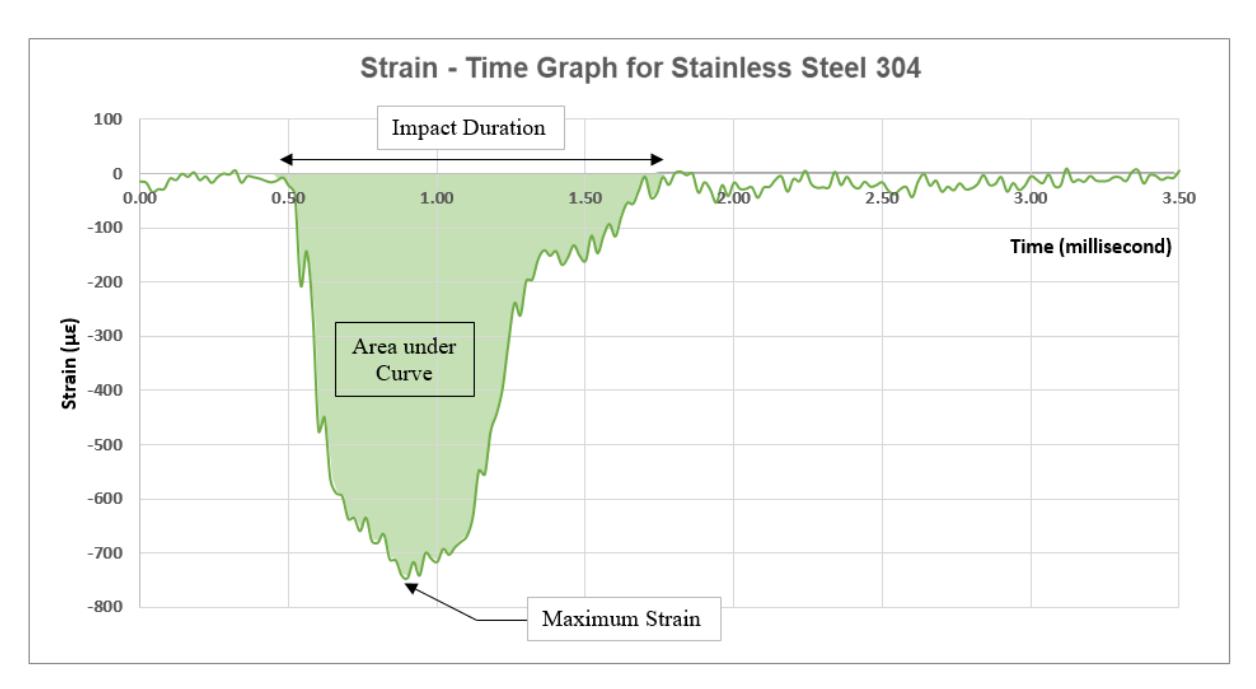
Example of impact strain signal indicating the impact duration, maximum strain, and the area under the curve.
Results and Discussion
The results of the impact strain signal for each material are illustrated in Figures 6 to 8. For a more distinct comparison, samples from each material were combined, as shown in Figure 9. All the graphs were optimized and selected within the time range of 0 milliseconds to 3.6 milliseconds. The deformation started at 0.5 milliseconds and ended before reaching 3.0 milliseconds; this is referred to as the impact duration period. Focusing on the strain deformation section of the graph, each material exhibits a different curve pattern. SS 304 demonstrates a larger area under the curve compared to the other two materials. In contrast, the graphs of AA
7075-T6 have quite sharp curve shapes. However, the curve for AA 6061-T6 is somewhat less sharp and larger than the curve for AA 7075-T6. The shape is further clarified by analyzing the area under the curve, which was derived from the graphs obtained.
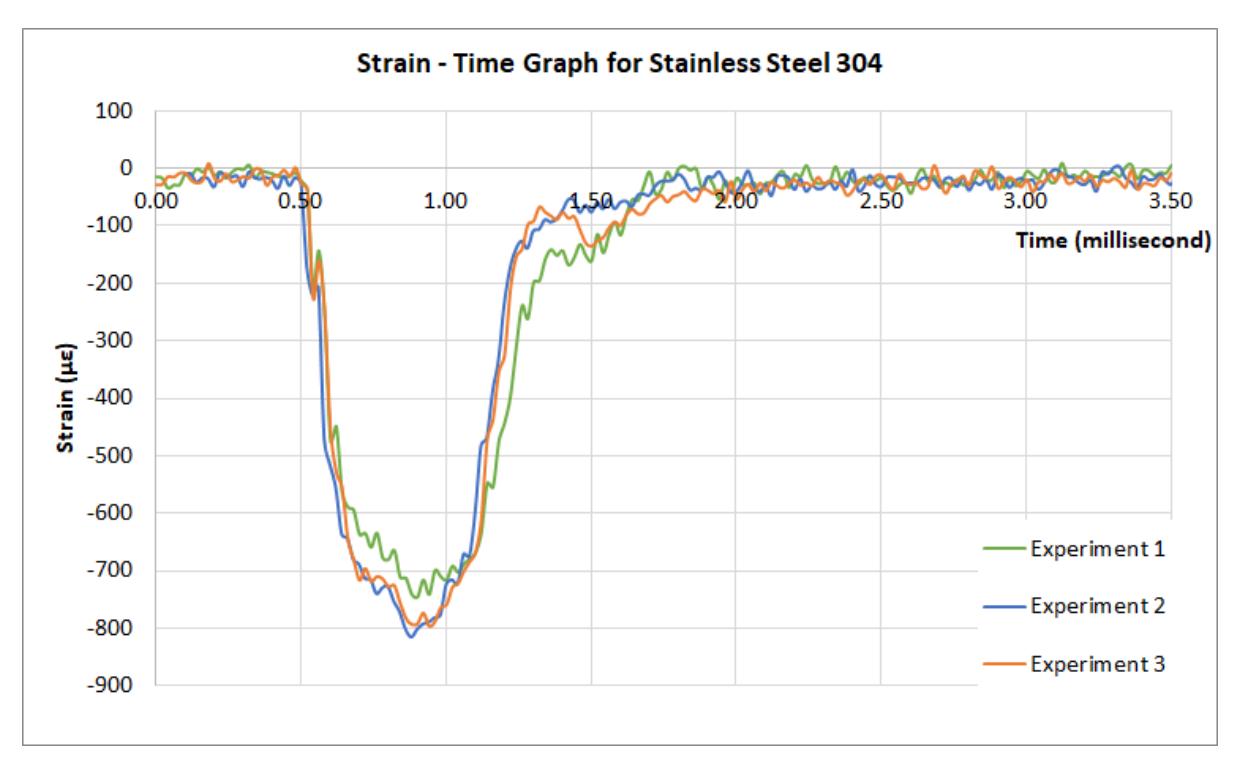
Strain-time curve for Stainless Steel 304.
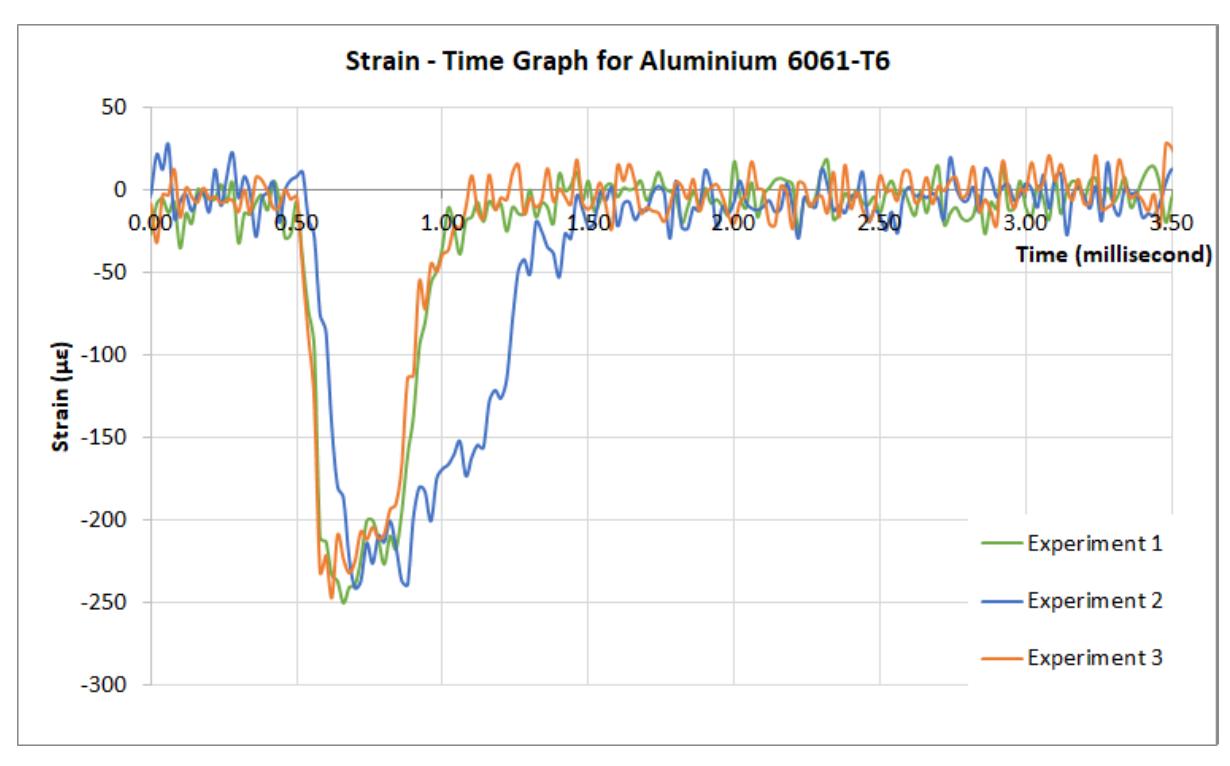
Strain-time curve for Aluminum 6061-T6.
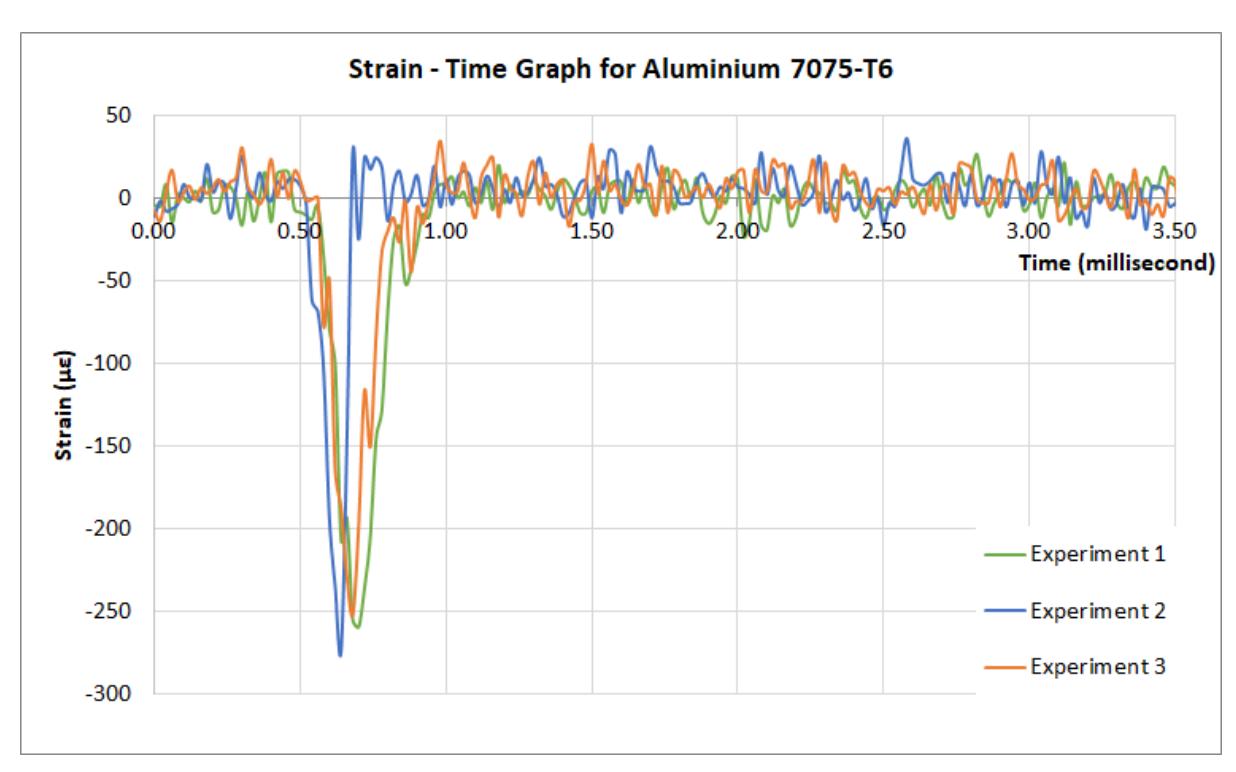
Strain-time curve for Aluminum 7075-T6.
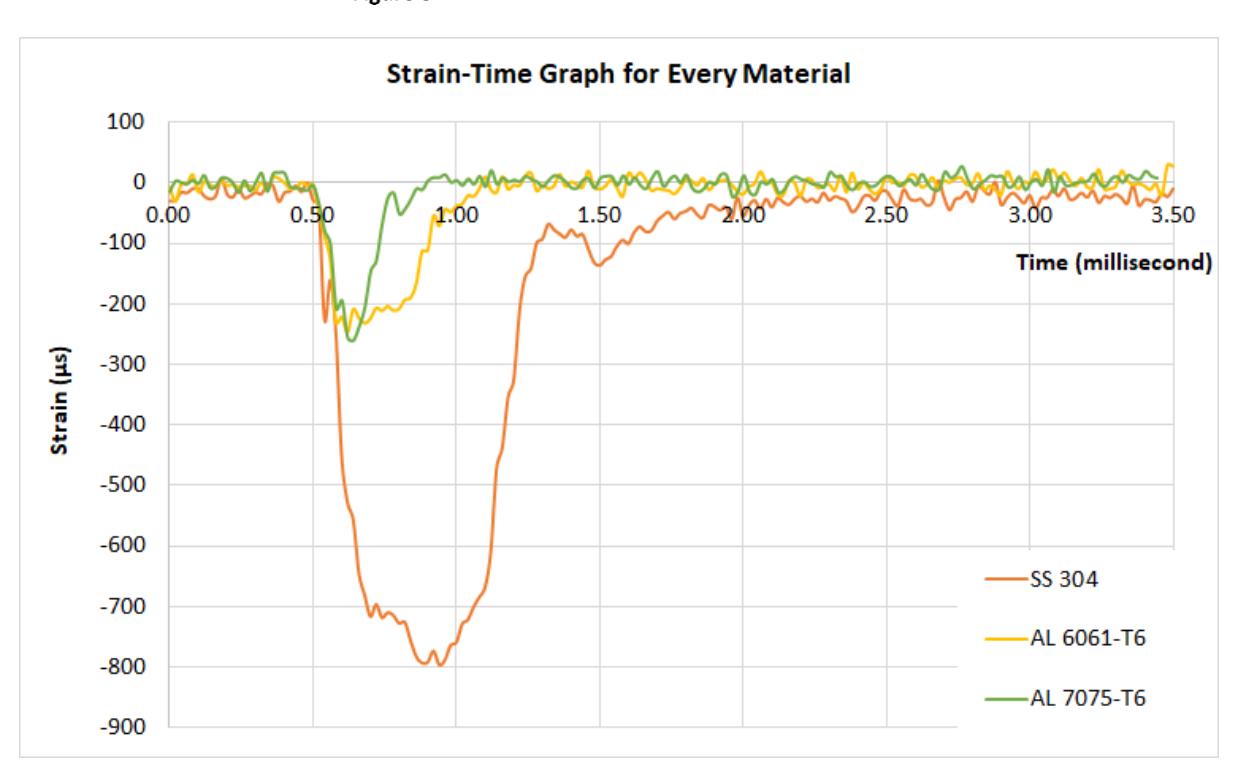
Average strain-time curve for each material.
To enhance the understanding of the strain deformation curve pattern, the discussion will go deeper into the analysis of the impact duration and the maximum strain value. Relevant data such as the impact duration, the maximum strain, and the area under the curve were extracted from the graphs, as listed in Table 2. The experiments were carried out in triplicate and average data was calculated, as shown in Table 2.
| Table 2 | Data for each material. |
|---|---|
| Stainless Steel 304 | Aluminum 6061-T6 | Aluminum 7075-T6 | ||
|---|---|---|---|---|
| Experiment energy absorbed (J) | Exp 1 | 90.00 | 13.75 | 9.38 |
| Exp 2 | 85.00 | 18.75 | 6.25 | |
| Exp 3 | 76.50 | 15.00 | 8.13 | |
| Average | 83.83 | 15.83 | 7.92 | |
| Theoretical energy absorbed (J) | Exp 1 | 85.66 | 14.38 | 6.38 |
| Exp 2 | 82.05 | 17.47 | 5.45 | |
| Exp 3 | 75.34 | 13.03 | 5.72 | |
| Average | 81.02 | 14.96 | 5.85 | |
| Maximum strain (με) | Exp 1 | 746.06 | 250.57 | 259.84 |
| Exp 2 | 816.47 | 241.46 | 274.02 | |
| Exp 3 | 795.20 | 247.35 | 252.24 | |
| Average | 785.91 | 246.46 | 262.04 | |
| Impact duration (millisecond) | Exp 1 | 1.24 | 0.90 | 0.48 |
| Exp 2 | 1.32 | 1.24 | 0.22 | |
| Exp 3 | 1.80 | 0.94 | 0.42 | |
| Average | 1.45 | 1.03 | 0.37 | |
| Area under the curve (με.ms) | Exp 1 | 473.78 | 89.47 | 42.00 |
| Exp 2 | 456.58 | 135.60 | 25.33 | |
| Exp 3 | 484.010 | 76.93 | 35.94 | |
| Average | 471.49 | 100.67 | 34.42 |
Here is an example using Eq. (2). By substituting the value in Figure 4, given that mg = pendulum weight = 178.17 N, S = 0.748 m, β = 150.56°, α = 108.24°:
\[U = (178.17)(0.748)(\cos 150.56 - \cos 108.24)\]\[U = 74.32J\]
Comparing the experimental and theoretical values of the energy absorbed, it is evident that the experimental value was greater than the theoretical value. The difference is attributed to the energy losses throughout the experiment due to friction and windage [12]. The impact energy absorbed value for SS 304, both experimental and theoretical, was the highest, followed by AA 6061-T6 and AA 7075-T6. Meanwhile, the recorded energy absorption values indicate that AA 6061-T6 exhibited twice the energy absorption compared to AA 7075-T6. In a previous study, Yildiz [29] observed that AA 6061-T6 has better energy absorption than AA 7075-T6. Although AA 7075-T6 has a greater yield strength than AA 6061-T6, it exhibits lower impact energy and impact strength compared to AA 6061-T6 [30].
Figure 10 displays the correlation between impact energy absorbed and the area under the curve. The area under the strain-time curve responds similarly to the energy absorbed; the area under the curve increases as the energy absorbed value increases [31]. Concisely, SS 304 leads in both impact responses, followed by AA 6061-T6 and AA 7075-T6. When the impactor strikes the specimen, the impactor deforms and simultaneously the strain gauge starts measuring the impact strain. At the same time, the specimen begins to deform and break within a certain period of impact duration. The larger the internal energy or plastic deformation of a material, the higher its impact energy absorption capacity [32]. This greater energy absorption capacity contributes to a greater area under the curve. In summary, the energy absorption performance can be inferred from the impact strain signal, as the area under the curve mirrors the energy absorption trend. This significant finding contributes to a better understanding of the relationship between energy absorption and the impact strain signal pattern.
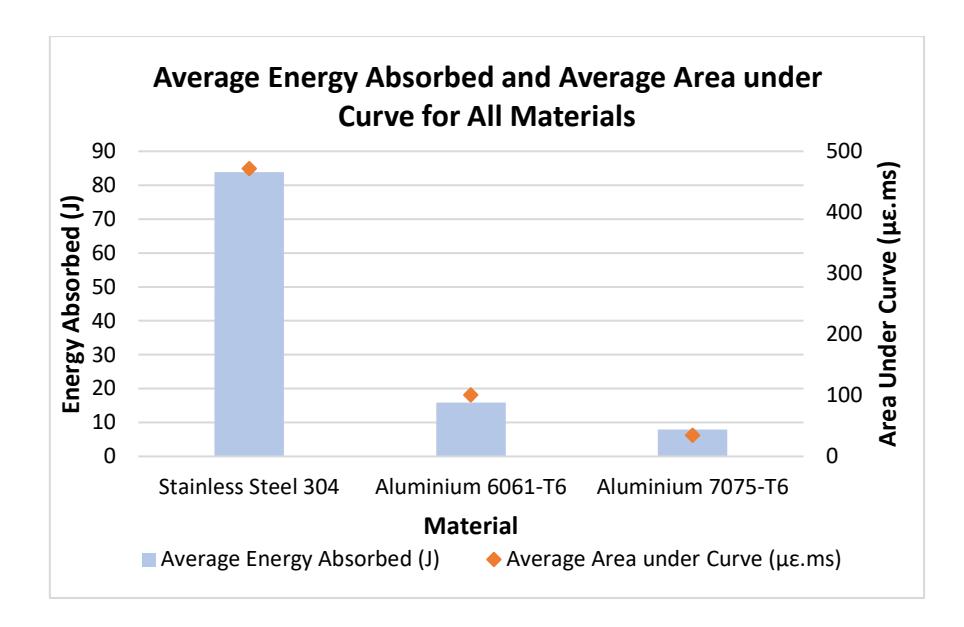
Correlation of the energy absorbed and area under the curve.
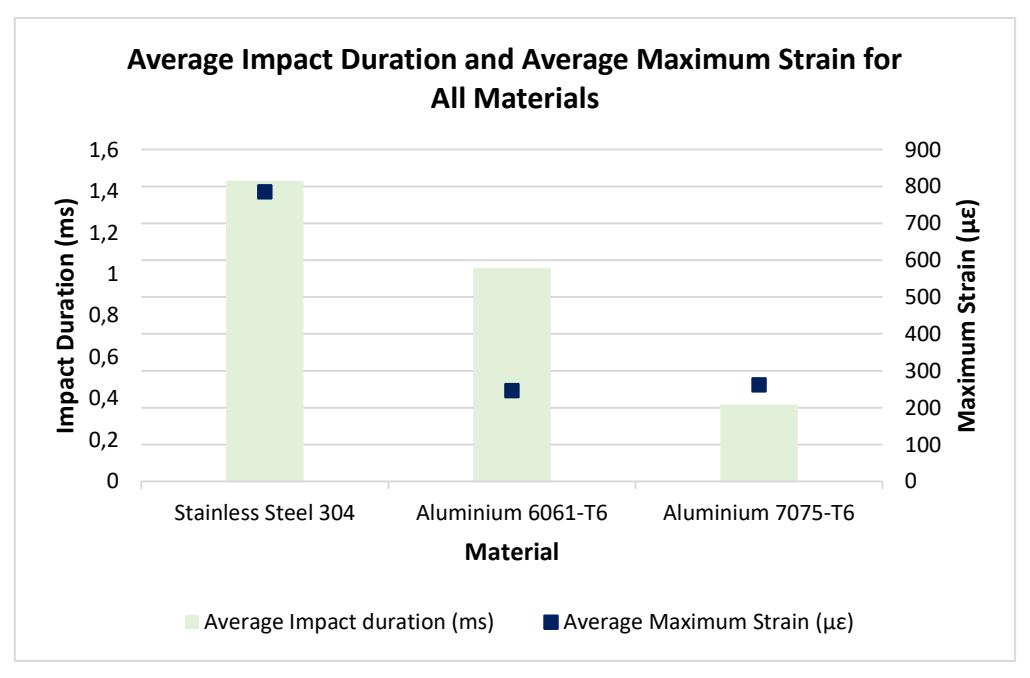
Figure 11 shows a comparison of impact duration and maximum strain for each material. There is no significant relationship between the impact duration and the maximum strain. Impact duration is related to the rate of deformation and fracture of the material. Material deformation is proportional to the strain value, meaning that maximum deformation leads the material to experience a higher maximum strain. An increase in impact energy also leads to a rise in the maximum displacement value [33]. However, the maximum strain of AA 7075-T6 is slightly higher than AA 6061-T6 by 6.32%. A previous study by Zakaria et al. [34] found that AA 7075-T6 has better strength and ductility, with longer strain deformation before fracture, when compared to AA 6061-T6.
Due to this, further study is needed, given that AA 6061-T6 has a higher energy absorption value but lower tensile strength and yield strength than AA 7075-T6. While the tensile strength and yield strength are important mechanical properties, the impact resistance also depends on the ductility and percentage elongation, since these allow more for deformation before fracture. This may be due to the different composition of their alloying elements. All these material properties assessments are crucial in selecting material performance for specific applications.
Impact duration and maximum strain for the material experimented.
Looking at the impact duration illustrated in Figure 11, the impact duration of SS 304 was relatively longer than the other materials. The extended impact duration of SS 304 suggests that the material exhibits a slower rate of deformation and fracture under impact loading conditions. This particular characteristic is important, as it shows that the material allows greater energy dissipation of kinetic energy during the impact events. Following SS 304, AA 6061-T6 had the second longest impact duration, while AA 7075-T6 had the shortest impact duration. This indicates that material performance varies in terms of withstanding deformation, thus resulting in variation in impact duration. The improved mechanical properties of AA 7075-T6, which contains higher tensile and yield strength compared to AA 6061-T6, result in a reduction of the ductility and energy absorption capabilities.
Referring to the signal patterns in Figures 6 to 8, SS 304 exhibits a U-shaped signal pattern, while AA 6061-T6 and AA 7075-T6 show a narrower shape resembling a V-shaped pattern. The shapes are indicated by the impact duration and the maximum strain experienced by the material itself. In a crashworthiness application, a longer impact duration is important, as it allows more time during the crashing events, which dissipates more energy and ultimately reduces the force at the end of the impacting event [32].
Overall, SS 304 excels in every impact property, which makes it a good base material for energy-absorbing structural applications, unlike the other two aluminium materials. When the application emphasizesthe material properties, such as weight, density, cost of materials, manufacturability, recyclability, and material life cycle, automobile fabrication needs the integration of multiple materials [35]. Even though SS 304 has excellent impact resistance, a holistic approach and consideration must be made of other factors when choosing the materials in the design process.
Conclusion
In conclusion, SS 304 demonstrates a better impact response than aluminium, suggesting that stainless steel can be selected as the best material to be used as an impact energy-absorbing device. A good energy-absorbing device should be able to absorb a significant amount of impact energy with a high impact duration as well as a large value of maximum strain. High internal energy and plastic deformation allow great energy absorption capacity. It is important to note that the longer impact duration provides somewhat optimized energy dissipation during the impacting event and later minimizes the hazardous effect at the end of the impact phenomenon. Regarding the performance of AA 6061-T6, it is considered the second-best material as an impact energy absorber in this study, where the impact energy absorbed and the impact duration recorded surpassed those of AA 7075-T6. Despite the tensile strength and yield strength of AA 7075-T6 being higher than AA 6061-T6, the impact response did not follow the same pattern. Furthermore, the ductility, percentage elongation and the alloying elements influence the material's impact response. It is worth noting that AA 6061-T6 is a more commonly used material in structural impact applications than AA 7075-T6. Further research specifically at the microscopic level is recommended, to gather a deeper understanding of the grain structure of the different grades of the material.
Acknowledgements
The work has been partially presented at the 7th Symposium on Damage Mechanics of Materials and Structures. The authors wish to express their gratitude and thanks to Universiti Teknikal Malaysia Melaka (UTeM) for funding this research under the Fundamental Research Grant (FRGS/1/2020/TK0/UTEM/02/36).