
Introduction
Sulawesi Island has several active faults due to the subduction process of the Australian Plate underneath the Eurasian Plate [1-3]. As a result, this region has a fairly complex geologic structure [4]. Faults are fractures between two blocks of rocks or fracture planes that are accompanied by shifts relative to other blocks of rock of varying sizes, which can range from a few centimeters to tens of kilometers [5]. GPS measurements and gravitational anomalies [6] show that there are fault structures that correlate with the microplate boundaries; these fault structures in Sulawesi are still actively moving, as indicated by their height.
The Palu-Koro Fault is one of the active faults on the island of Sulawesi and extends from Palu Bay to Bone Valley, having a length of around 460 km [3]. This fault is the main geological structure in the province of Central Sulawesi, which is a left strike-slip fault that is trending NNW-SSE [3,7-9]. The Palu-Koro Fault was identified as the cause of the shallow earthquake with magnitude 7.5 that occurred on September 28, 2018, which was followed by liquefaction and a tsunami in Sulawesi [6, 10]. This earthquake was not only caused by the Mw 7.5 mainshock that occurred at 10:02 UTC but was possibly also triggered by the significant earthquakes (Mw 6.4,
Copyright ©2024 Published by IRCS - ITB J. Eng. Technol. Sci. Vol. 56, No. 3, 2024, 317-328 ISSN: 2337-5779 DOI: 10.5614/j.eng.technol.sci.2024.56.3.1
1 Indonesian Agency of Meteorology Climatology and Geophysics, Jalan Angkasa 1 No. 2, Jakarta 10610, Indonesia
2Global Geophysics Research Group, Faculty of Mining and Petroleum Engineering, Institut Teknologi Bandung, Jalan Ganesa No. 10, Bandung 40132, Indonesia
Mw 6.2, and Mw 6.1) that took place less than 25 minutes after the mainshock. This earthquake sequence most likely led to the liquefaction that occurred in Balaroa, Petobo, and Jono Oge on September 28, 2018. The epicenter of both the Mw 6.4 and Mw 6.2 aftershocks was located very close to the area where the liquefaction took place. These aftershocks caused a shaking impact that was equivalent in intensity to the mainshock (Figure 1). The measurement of the shaking intensity caused by the four significant earthquakes can be seen in Table 1.
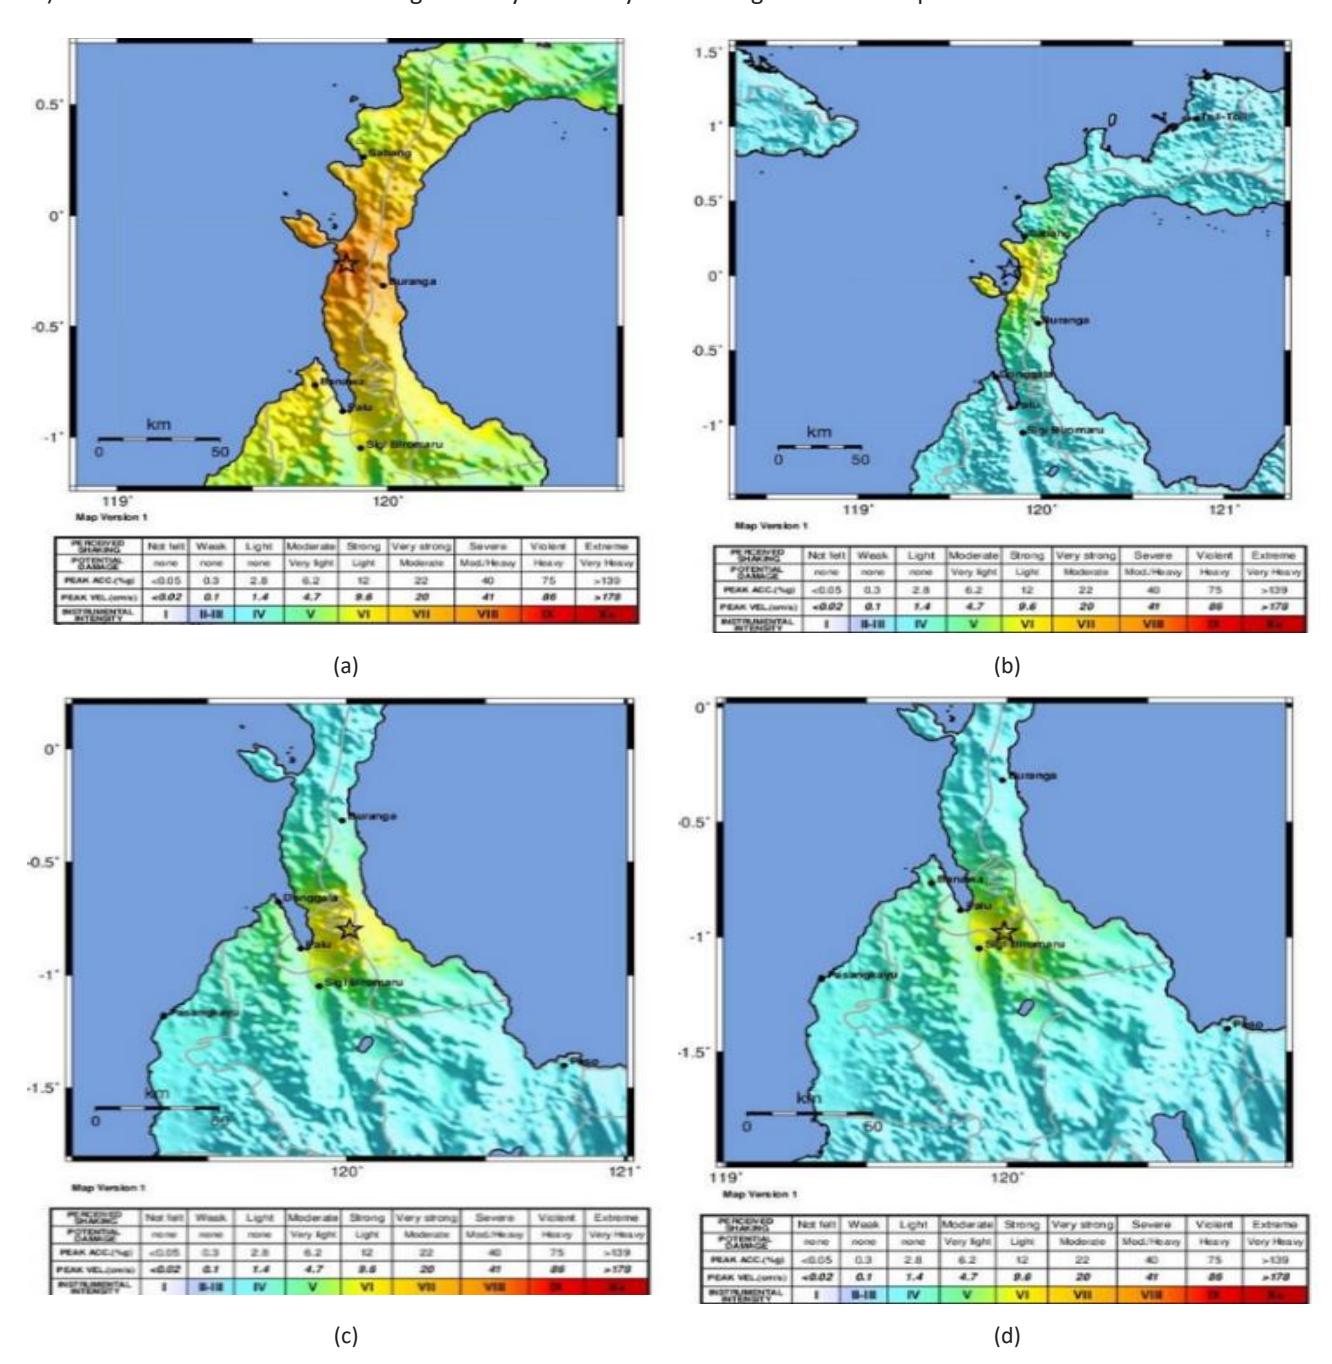
Shakemap showing an overview of the scale of intensity caused by the mainshock and aftershocks: (a) the mainshock, imputed as VI on the Modified Mercalli Intensity (MMI) scale, took place in the city of Palu and the location of the liquefaction, (b) the second aftershock, (c) the third aftershock, and (d) the fourth aftershock, which had an impact intensity of VI (MMI) in Palu and the liquefaction area.
Table 1 Analysis of the mainshock and aftershocks of the 2018 Palu-Donggala earthquake event Based on the Agency for Meteorology, Climatology, and Geophysics/Badan Meteorologi, Klimatologi, dan Geofisika (BMKG) Catalog.
| Event | Date | Origin Time (UTC) | Mw | Intensity scale (MMI) | ||
|---|---|---|---|---|---|---|
| Balaroa | Petobo | Jonooge | ||||
| Mainshock | 28/09/18 | 10:02:43 | 7.5 | VI | VI | VI |
| Aftershock 1 | 28/09/18 | 10:14:21 | 6.4 | IV | IV | IV |
| Aftershock 2 | 28/09/18 | 10:16:51 | 6.2 | VI | VI | VI |
| Aftershock 3 | 28/09/18 | 10:25:06 | 6.1 | VI | VI | VI |
Liquefaction occurs in a medium with sandy soil [11-13] and water-saturated conditions experiencing deformation due to an earthquake [14]. As a result of this deformation, the medium loses its effective stress, which changes the solid mass to liquid [15, 16]. Water-saturated soil layers at shallow depths (near the surface) have a high tendency to experience liquefaction [17]. The earthquake sequence on September 28, 2018, resulted in continuously repeated loads with a large enough magnitude in a reasonably short duration as the main factors in the liquefaction.
Seismic loads have been the cause of most liquefaction events worldwide [18]. Previous studies, such as [19], used microtremor data including HVSR to describe the Palu liquefaction that caused massive mudflows. Then, [20] estimated the Vs profile to understand the flow of the liquefaction phenomena in Palu. Both studies used microtremor data to investigate the subsurface profile that corresponded to the liquefaction flow. The present research investigated the potential relationship between the 2018 Palu earthquake sequence and the liquefaction events that occurred in Balaroa, Petobo, Jono Oge, and Palu. We aimed to assess whether the earthquakes triggered or influenced this geotechnical phenomenon. We investigated specific earthquake parameters such as magnitude, duration, and ground shaking intensity to see if they correlated with the severity or extent of liquefaction.
By understanding the relationship between the 2018 Palu earthquake and liquefaction, we can improve our ability to predict and prepare for similar events in the future. Liquefaction during earthquakes can lead to significant infrastructure damage and loss of life. Understanding the factors that contribute to liquefaction, such as the specific characteristics of an earthquake sequence, is crucial for hazard mitigation and risk reduction efforts. In the case of Palu, investigating the possible link between an earthquake and liquefaction can inform future preparedness and response strategies for the region. We used the subsurface profile retrieved from MASW measurements by [21] to understand the 2018 liquefaction phenomena.
Data and Method
We carried out Vs30 measurements using the Multichannel Analysis of Surface Wave (MASW) method in areas affected by liquefaction in Balaroa, Petobo, Jono Oge, and Palu to determine the site characteristics and make a liquefaction analysis [22, 23]. MASW utilizes surface wave propagation (Love and Rayleigh) to determine the characteristics of subsurface conditions. MASW has been used to profile the subsurface liquefaction areas in Palu, Central Sulawesi [21]. This method generally shows a correlation between the amplitude of ground movement and the damage area [24].
The process of measuring and processing MASW data in the liquefaction area of Balaroa, Petobo, and Jono Oge, and outside the liquefaction area, in the city of Palu and its surroundings has been explained in detail [21]. We carried out MASW measurements at three locations in the Balaroa area (BLR_23, BLR_24, BLR_25) and two drilling locations (BOR_1 and BOR_6), as seen in Figure 2. We also carried out MASW measurements at eight locations in the Petobo area (PTB_27, PTB_28, PTB_32, PTB_33, PTB_34, PTB_37, PTB_38, PTB_39) and two drilling locations, LP_2 and LP_4 as seen in Figure 3. Meanwhile, we also carried out MASW measurements at eight locations in the Jono Oge area (JNG_13, JNG_18, JNG_20, JNG_21, JNG_22, JNG_23, JNG_24, JNG_25) and two drilling locations (J_02 and J_03), as can be seen in Figure 4.
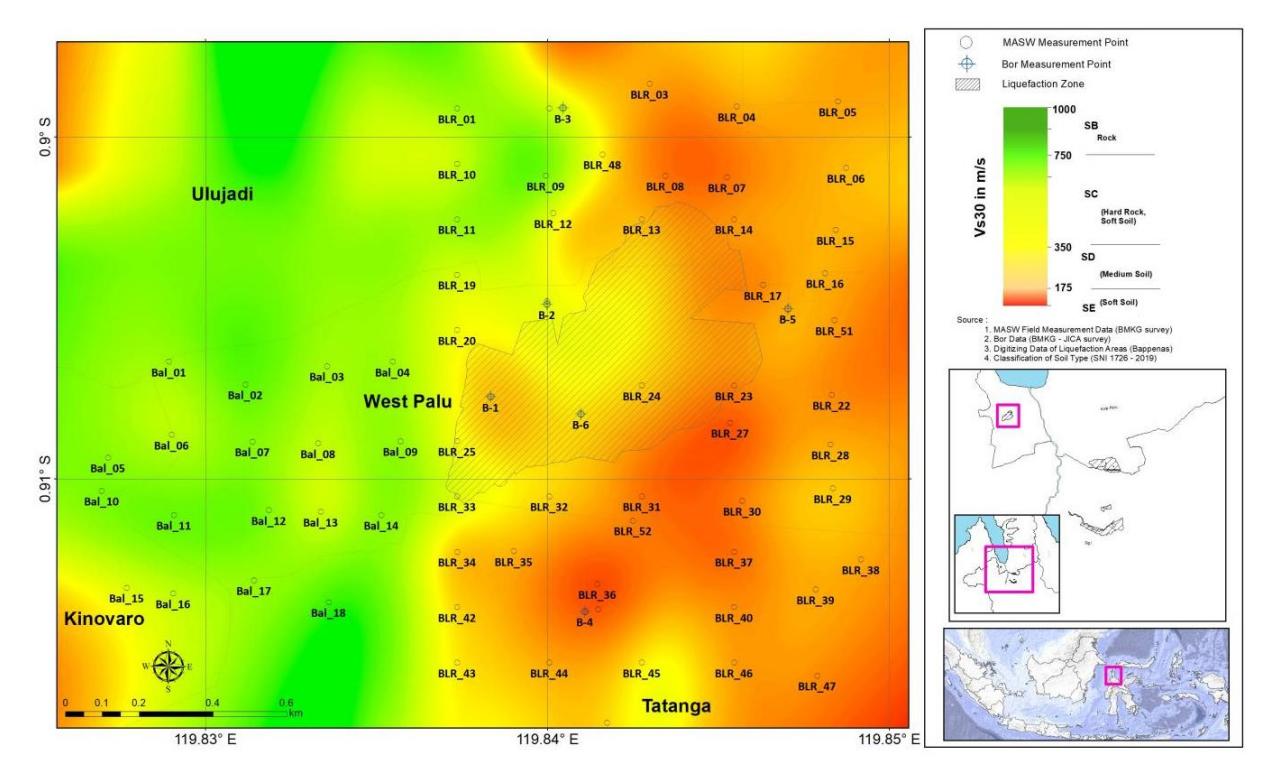
Map of Vs30 measurement locations and drills in the Balaroa liquefaction area and its surroundings.
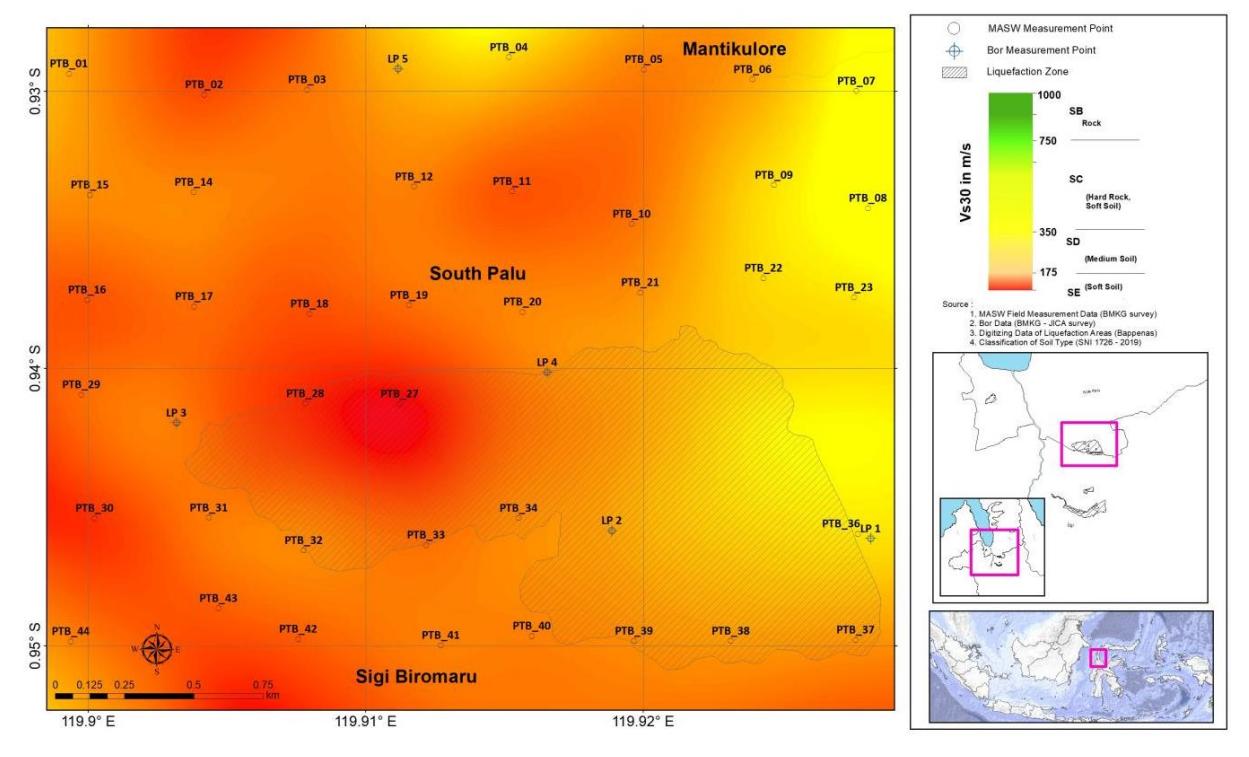
Map of Vs30 measurements and drilling locations in the Petobo liquefaction area and its surroundings.
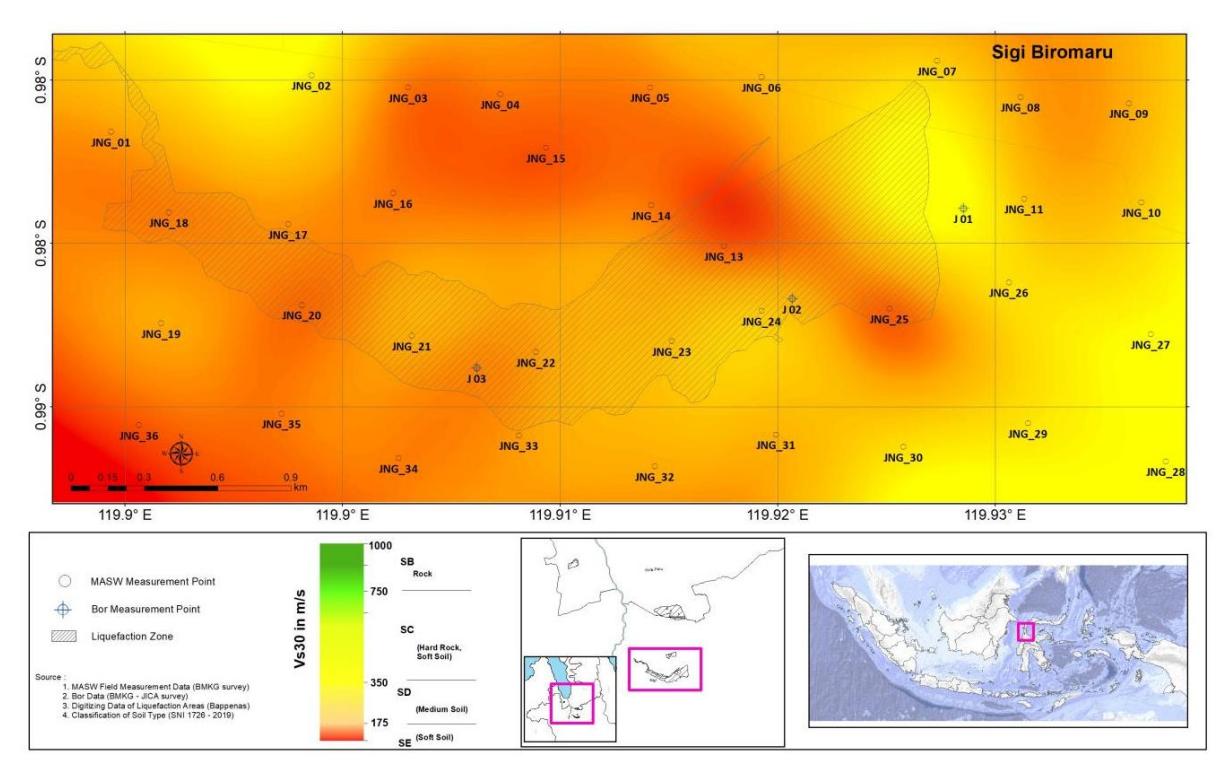
Map of Vs30 measurements and drilling locations in the Jono Oge liquefaction area and its surroundings.
In this research, the parameters that were used to evaluate the determination of liquefaction potential were: shear velocity (Vs), cyclic stress ratio (CSR), and cyclic resistance ratio (CRR) values [25]. This research also utilized supporting parameters from borehole data. For example, borehole data at location J-02 in the Jono Oge area is shown (Figure 5).
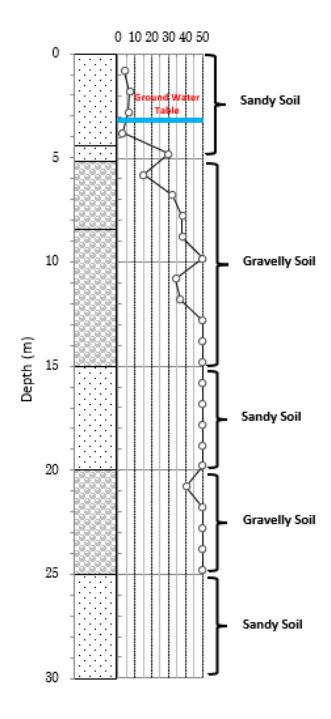
Borehole data example at location J-02 in the Jono Oge area shows borehole data up to a depth of 30 meters consisting of sand and gravel lithology and shows a ground water table depth of 3.20 meters.
Cyclic Stress Ratio (CSR)
CSR is a parameter that represents the influence of seismic vibrations on cyclic pressure in each soil layer. We calculated the CSR parameters based on procedures that have previously been carried out [11] and are defined as follows:
\[CSR = 0.65. \frac{a_{\text{max}}}{g} \cdot \frac{\sigma_{\text{V}}}{\sigma_{\text{V}}'} \cdot r_{\text{d}}\] (1)
where \(a_{max}\) is the peak ground acceleration horizontally; \(a_{max}\) is the peak ground acceleration obtained based on the shakemap results from four earthquake events in Figure 1; g is the acceleration due to gravity, \(\sigma_v\) and \(\sigma'_v\) are the total overburden stress and the effective overburden stress in the vertical direction; and \(r_d\) is the stress reduction factor, \(a_{max}\), which was based on [26]. Calculations \(\sigma_v\) and \(\sigma'_v\) were obtained from primary borehole data based on field measurements from the BMKG and Japan International Cooperation Agency (JICA) in 2018 (Figure 5). Estimation was based on the calculation procedure of [17], using Eqs. (2) and (3):
\[r_d = 1.0 - 0.007654z\] for depth \(z \le 9.15\) m (2)
\[r_d = 1.174 - 0.0267z\] for a depth of \(9.15 \text{ m} \le z \le 23 \text{ m}\) (3)
For ease of computation, \(r_d\) in this research was calculated by Eq. (4):
\[r_{d} = \frac{(1.000 - 0.4113z^{0.5} + 0.04052z + 0.001753z^{1.5})}{(1.000 - 0.4177z^{0.5} + 0.05729z - 0.006205z^{1.5} + 0.001210z^{2})} \tag{4}\]
Cyclic Resistance Ratio (CRR)
CRR is a parameter that measures soil strength against cyclical loads due to earthquakes. This parameter is calculated based on previous research [27], using Eq. (5):
CRR = \[\left(a * \left(\frac{Vs_1}{100}\right)^2 + b \left(\frac{1}{V_{s_1}^* - Vs_1} - \frac{1}{V_{s_1}}\right)\right) * MSF\] (5)
where \(V_{s1}\) is the stress-corrected ground shear wave velocity (m/s) for overburden (per depth until 30 m), \(V_{s1}^*\) is the limit ground shear wave velocity due to the amount of fine content (m/s), and MSF is the magnitude scaling factor.
MSF is calculated on an earthquake scale that differs from M 7.5 [17]; thus, a correction factor is needed, which is formulated as in Eq. (6):
\[MSF = \left(\frac{M_W}{7.5}\right)^{-2.56} \tag{6}\]
The CRR parameter requires a value of shear wave velocity (Vs) that has been corrected with stress (stress corrected shear wave velocity) to improve the penetration resistance [28]. The Vs equation is corrected for voltage \((Vs_1)\) as in Eq. (7):
\[Vs_1 = Vs \left(\frac{P_a}{\sigma_{Vol}}\right)^{0.25} \tag{7}\] where Vs is the ground shear wave velocity measured in the field (m/s), Vs* is the limited ground shear wave velocity due to the amount of fine content (m/s), Pa is the atmospheric pressure (100 KPa), and \(\sigma_{V0^1}\) is the effective overburden stress (kPa).
Factor of Safety (FS)
The factor of safety (FS) value is used to determine the safety factor of liquefaction in soil, which is determined by comparing CRR and CSR, as shown in the Eq. (8) below:
\[FS = \left(\frac{CRR_{7.5}}{CSR}\right)MSF \tag{8}\]
If the factor of safety (FS) value is <1, then the soil is considered to have liquefaction potential. On the other hand, if the factor of safety (FS) is >1, then the land is considered to not be liquefied [17].
Results
The results of Vs30 measurements, validated by drilling data, play an important role in determining soil type and groundwater table depth. These two factors, together with lithology, are the key parameters in assessing liquefaction potential. Liquefaction is a phenomenon where soil loses its strength due to earthquake vibrations, causing it to behave like a liquid. This phenomenon can cause severe damage to buildings and infrastructure. The three geological parameters are interrelated. The Vs30 value indicates soil density, lithology indicates soil type, and groundwater table depth indicates soil saturation level. If one of these parameters does not support liquefaction, the probability of it occurring will be low. In Balaroa, Petobo, and Jono Oge, the liquefaction potential due to the series of earthquakes with magnitudes of 7.5, 6.4, 6.2, and 6.1 SR was estimated using NCEER. In this method, the liquefaction potential is determined by the FS parameter, where an FS value below the critical limit (FS = 1) indicates liquefaction [17].
The FS parameters were analyzed in Balaroa at BLR_23, BLR_24, BLR_25, and BOR_1. The FS parameter at BLR_23 showed the liquefaction potential, due to the series of earthquakes, as indicated by an FS anomaly of less than one at a depth of 10 m. At BLR_24, the FS value for all of the earthquake series had a value of less than 1, which indicates the potential for liquefaction from depths of 0 to 30 m. At BLR_25, liquefaction events occurred at depths of 0 to 10 m, which were caused by the series of earthquakes; while at depths of 10 to 30 meters, liquefaction was only caused by the magnitude 7.5 earthquake. In BOR_1, the series of earthquakes showed the potential for earthquakes at depths from 0 to 25 m.
FS parameters were analyzed in Petobo at PTB_27, PTB_28, PTB_32, PTB_33_ PTB_34, PTB_37, PTB_38, PTB_39. The FS parameter at PTB_27 for all of the earthquake series showed an FS value of less than 1 at a depth of 0 to 25 m, indicating liquefaction. At PTB_28, the earthquake series had an FS value of less than 1 at a depth of 0 to 25 m, which indicates liquefaction potential. In PTB_32, all of the earthquake series had FS values of less than 1 at depths of 0 to 25 m, which indicates liquefaction potential. In PTB_33, all of the earthquake series showed FS values of less than 1 at depths of 0 to 30 m. In PTB_34, the FS value was less than 1 for all magnitudes at depths of 0 m and 10 m. In this depth range, the FS value has a critical value of FS = 1. At PTB_37 and PTB_38, the earthquake series had an FS value greater than 1, which indicates that liquefaction did not occur there. In PTB_39, the earthquake series had an FS value at the critical value FS = 1.
The FS parameter analysis in Jono Oge was carried out at JNG_13, JNG_18, JNG_20, JNG_21, JNG_22, JNG_23, JNG_24, JNG_25. JNG_13 revealed that the series of earthquakes had an FS value of less than 1, which indicates that liquefaction occurred at depths of 0 to 25 m. At JNG_18, JNG_20, JNG_21, JNG_22, and JNG_24, the earthquake series had an FS value of less than 1 at a 0 to 30 m depth. This indicates that liquefaction occurred at these locations; JNG_23 revealed liquefaction for the earthquake series at depths of 0 to 15 m, while at depths greater than 15 m, only earthquakes with M 7.5 caused liquefaction. At JNG_25, liquefaction only occurred at depths of 0 m and from 10 to 15 m.
Discussion
Several studies related to potential liquefaction have been carried out [29]; these calculated the liquefaction potential at Tuzla and Long Beach in Cyprus based on FS values, where FS values above 1.2 indicate no liquefaction potential. Geologically, this area is dominated by alluvial deposits. The potential for liquefaction in Pohang, South Korea was calculated [30], where an FS value of less than 1 indicated liquefaction. This area is geologically dominated by clay, sand, and silt. The new method utilizes CPT and SPT [31, 32], CPT and Vs values [33], which have been proven to be more accurate in predicting liquefaction potential due to their ability to provide detailed information about soil conditions and their mechanical properties. By combining CPT and Vs data can produce a more comprehensive and accurate evaluation method, thus increasing the safety assurance of structures and infrastructure in earthquake-prone areas.
We estimated the potential for liquefaction in Balaroa, Petobo, and Jono Oge due to the series of earthquakes with magnitude 7.5, 6.4, 6.2, and 6.1, based on Vs30 measurements of field and drill data. The results of the NCEER analysis at Balaroa showed that the potential for liquefaction at BLR_23, BLR_24, BLR_25, and BOR_1 was caused by the series of earthquakes. BLR_24, BLR_25, and BOR_1 all had an FS value of less than 1, which indicates the potential for liquefaction events at these locations. A different FS value was seen at BLR_23, which was less than 1 at a depth of 10 m, while other depths had a critical value (FS = 1), as shown in Figure 5. There were quite large fluctuations in FS values at BLR_24, BLR_25, and BOR_1, as well as very small FS fluctuations at BLR_23 that approached the critical point. These were possibly due to the heterogeneity of the rocks that composed the medium soil to soft soil (Figure 2), in accordance with previous Vs30 measurement results [14].
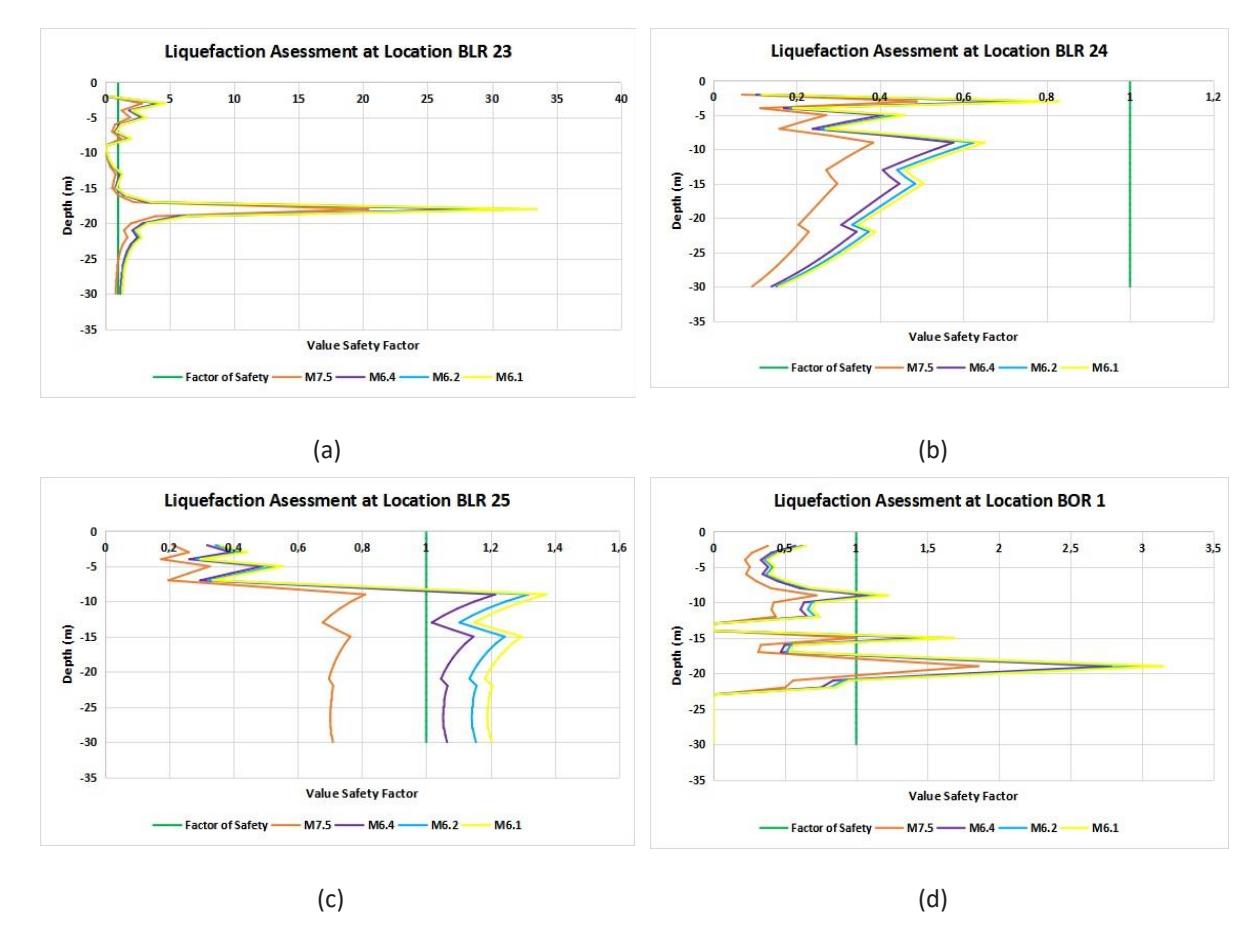
(a) The green vertical line is the value of SF = 1 if the value of SF < 1 is liquefaction and SF > 1 is not liquefied. The BLR_23 measurement was taken at the border of the eastern part of the Petobo liquefaction location. The results of the SF graph show that the liquefaction was triggered by earthquakes that had magnitudes of 7.5, 6.4, 6.2, 6.1 but only to a depth of 13 m, (b) BLR_24 is located in the middle of the Balaroa liquefaction area, where liquefaction was triggered by four significant earthquakes at a depth of up to 30 m, (c) liquefaction was triggered by all the earthquakes but only the magnitude 7.5 earthquake reached a depth of 30 m.
The NCEER analysis in Petobo shows there is potential for liquefaction due to the series of earthquakes that took place at PTB_27, PTB_28, PTB_32, and PTB_33, where the FS value was smaller than 1 at these locations. At PTB_34, PTB_37, PTB_38, and PTB_39 the series of earthquakes only had potential for liquefaction at a critical value (FS = 1), although FS was found to be less than 1 at depths of 0 m and 10 to 15 m (Figure 6). Triyono et al. (2023) have shown that the Vs30 measurement results at this location were in soft (Vs30 < 175) to medium soft (Vs30 > 175) soil, as can be seen in Figure 3.
The NCEER analysis at Jono Oge showed that the series of earthquakes triggered potential liquefaction at all of the following measurement locations: JNG_13, JNG_18, JNG_20, JNG_21, JNG_22, JNG_23, JNG_24, and JNG_25 (Figure 7). The graph of FS against depth shows that the series of earthquakes had an FS value of less than 1 at depths of 0 to 25 m. The Vs30 measurement results [21] show that the measurement location is in soft soil (Vs30 < 175), as can be seen in Figure 4.
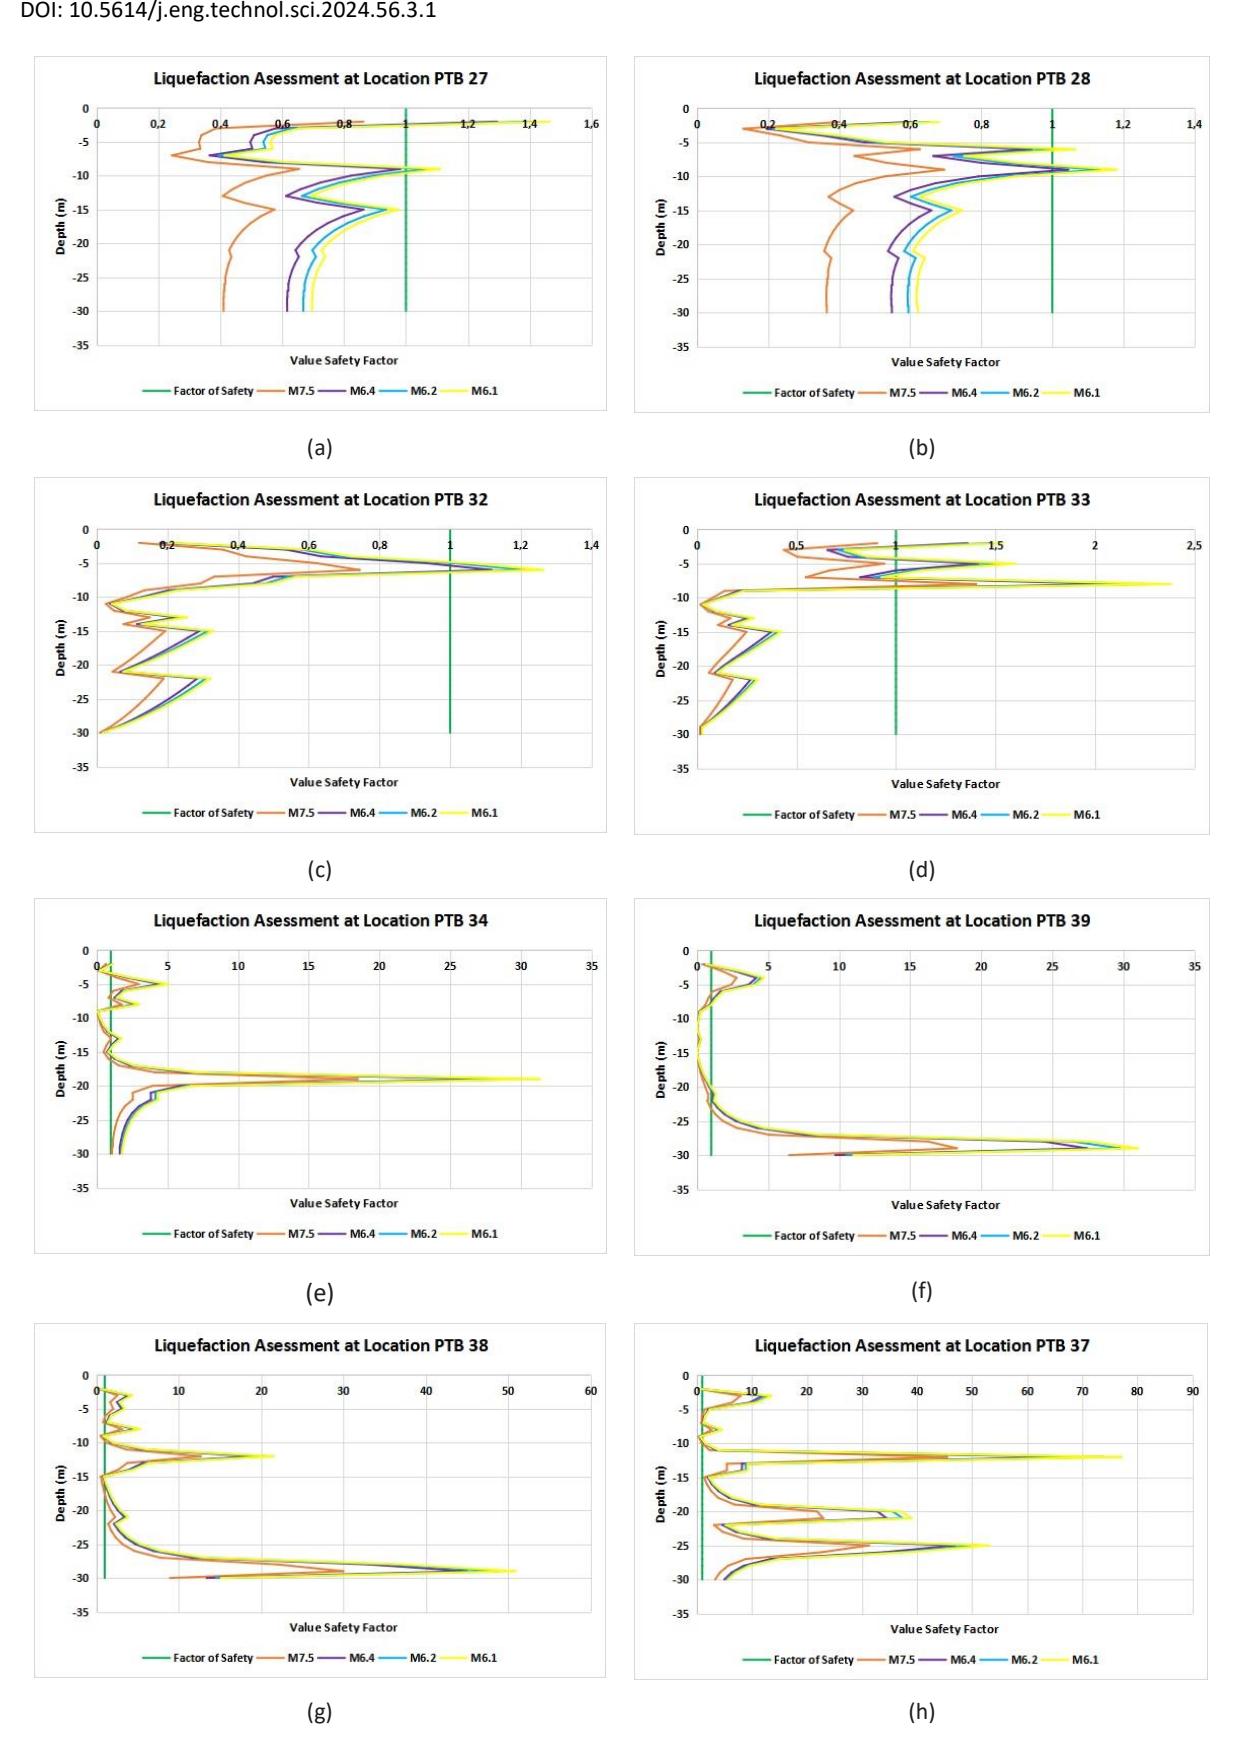
The green vertical line is the value of SF = 1 if the value of SF < 1 is liquefaction and SF > 1 is not liquefied. The graph above shows liquefaction at the surface of the ground water level (GWL), triggered by all of the significant earthquake events, except for at PTB_27 (a) and PTB_33, (d) liquefaction was only caused by the magnitude 7.5 earthquake.
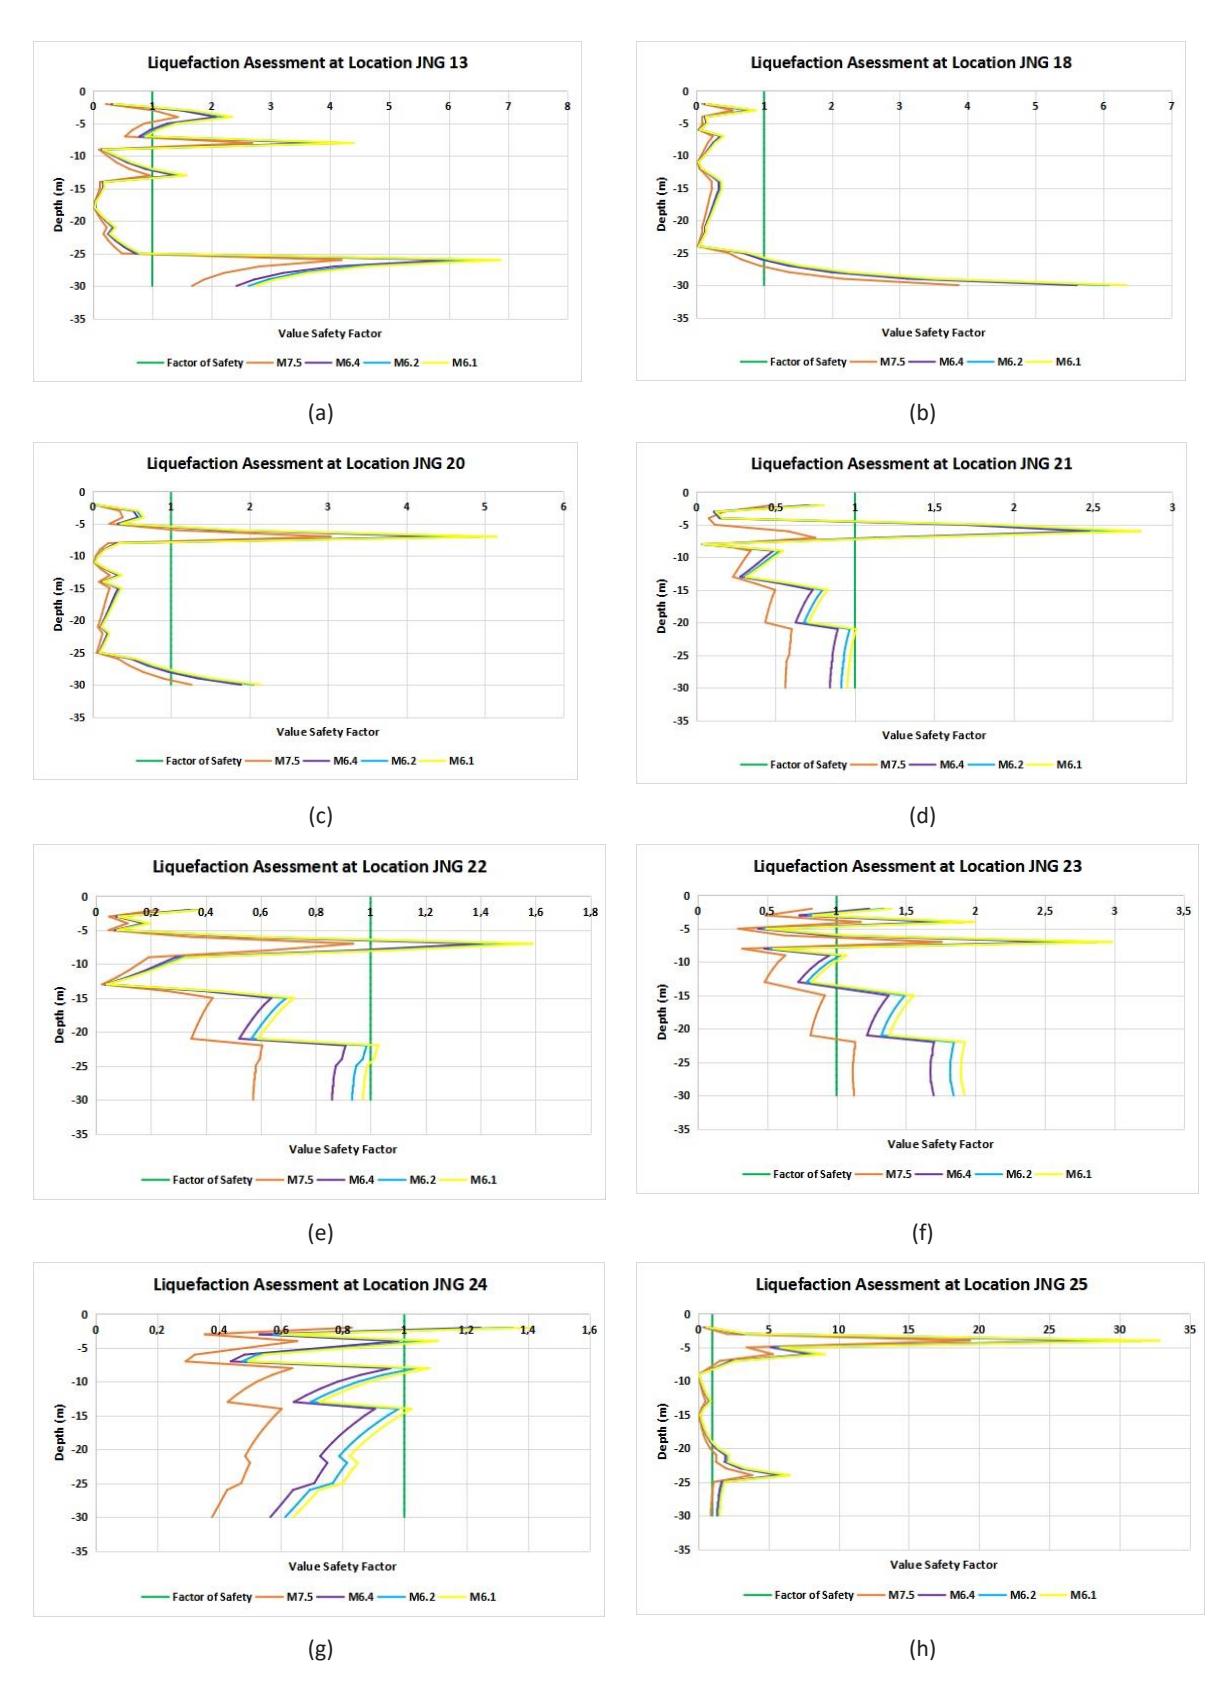
The green vertical line is the value of SF = 1 if the value of SF < 1 is liquefaction and SF > 1 is not liquefied. The graph above shows that liquefaction on the surface of the ground water level (GWL) was triggered by all of the significant earthquake events except for at JNG_23 and JNG_24. The liquefaction was only caused by the magnitude 7.5 earthquake.
Conclusions
The results of the FS parameter analysis that was undertaken to determine the potential for liquefaction at Balaroa, Petobo, and Jono Oge show that the series of earthquakes with magnitudes 7.5, 6.4, 6.2, and 6.1 triggered liquefaction at these locations.
The differences in the positions of liquefaction at Petobo, Balaroa, and Jono Oge due to the series of earthquakes could be caused by differences in the strength of the vibrations coming from the earthquake source as the source of vibration generation for liquefaction and also the stratigraphic structure.
The soil composition at these three locations is based on Vs30 values of soft to slightly soft soil, rock lithology type, and groundwater table depth, indicating that they are more susceptible to liquefaction. The locations of the three liquefaction zones all have similar compositions, suggesting that the liquefaction phenomenon occurred from the same vibration source in all three zones.
Acknowledgments
We would like to thank BMKG for providing the seismic data for this research. We would also like to thank JICA, for their cooperation in allowing drilling in thirty locations around Palu. The Pickwin and WaveEQ computer programs used in the MASW analysis were released under license from the OYO Corporation. All maps generated using the ArcGIS computer program were released under the ESRI license.