
Introduction
An increased population, disproportionate to the area and lifestyle of large cities, has led to the growth of the number of high-rise buildings such as office towers, apartments, malls, and others. In structures of moderate height, parking space is semi-enclosed and typically located on the basement floor, leading to inadequate ventilation and lighting. The absence of ventilation contributes to poor indoor conditions, while exhaust fumes and heat emitted by vehicles result in poor air quality [1, 2]. Recognizing these issues, mechanical ventilation systems are adopted to facilitate air circulation in enclosed spaces. Analyses have shown that air pollution in closed environments, particularly in basement parking spaces, remains a persistent concern, and the implications for human health demand continued scrutiny [3-5].
The primary source of pollution in basement parking spaces are transportation activities from outdoor to indoor environment. Vehicle engines contribute to air pollution through the emission of CO (carbon monoxide), NOx (nitrogen oxide), SOx (sulfur oxide), HC (hydrocarbon), and Pb (lead) [6, 7].
Various methods to reduce contaminants have been investigated. For instance, using the volumetric method on a quantachrome autosorb MP instrument, wood biomass activated carbon with low chemical consumption has demonstrated the ability to reduce CO2 [8]. Honeycomb activated carbon has been effective in decreasing
hydrocarbon emissions from gasoline-fueled vehicles [9]. Combinations of fly ash catalyst and activated carbon combinations in filters have shown the capacity to absorb SO<sub>2</sub> [10]. Additionally, activated carbon filters have been successful in reducing NO<sub>2</sub> exposure in vehicles by up to 87.4% [11].
The effort to reduce indoor air pollution has been extended to using available and sustainable natural ingredients. Small precipitator-type (ESP) air purifiers with carbon brush ionizers and activated carbon fiber filters (ACF) have proven effective in reducing acetic acid, acetaldehyde, and ammonia indoors [12]. Activated carbon derived from foam and granular olive stone has been adopted for indoor air NO<sub>2</sub> filtration [13]. Furthermore, noise reduction strategies using activated carbon have also been reported.
Activated carbon fiber in acoustic measurement systems has sound-absorbing properties and is widely used as a type of sound-absorbing material [14]. Coating surfaces with activated carbon powder have also been shown to absorb sound effectively [15]. It is important to note that most of these studies were confined to laboratory-scale experiments with none having been conducted in real situations. Various efforts to reduce ambient air have been conducted. Green pavement from activated carbon \(TiO_2\) coating reduced \(NO_2\) and NO on the road side [16], however, none of them applied activated carbon panels as a wall lining material to reduce air and sound pollution. The aim of this study was to use activated carbon panels derived from palm oil shells to reduce CO, HC, \(NO_2\), Pb, and indoor noise due to motor vehicle emissions and investigate their impact in relation to the thickness of the panels.
Methods
Materials
The material used in this study comprised palm shell activated carbon procured from Carbonella Indonesia. The characteristics of the activated carbon used were: physical activation, granular form, water content 2.6%, ash content 10.5%, heating loss 950 °C 4.5%, mass density 0.58 g/ml, carbon content 85%, methylene blue absorption 8.97 mg/l, iodine absorption 283.44 mg/g (SNI 06-3730-1995). Table 1 presents the key characteristics of the activated carbon. The panels were crafted from this material and enclosed in a sleek white PVC box with a diameter of 2.5 mm.
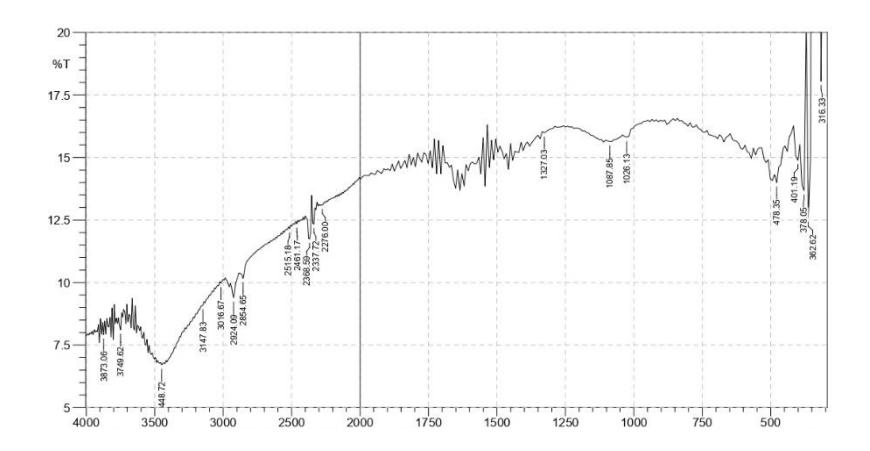
Figure 1 shows the FTIR spectra of the activated carbon. It shows a peak with high intensity in the wave number area 3448.72 cm<sup>-1</sup>, which indicates the presence of the O-H group. C-O absorption is shown at wave number 1327.03 cm<sup>-1</sup> along with C-H bond stretching at wave number 1087.85 cm<sup>-1</sup>.
The carbonation process uses a pyrolysis reactor at a temperature of 700 °C, producing a pore size of 35.9 nm. The results of FTIR analysis show a wave number of 2165.18 cm<sup>-1</sup>, 1554 cm<sup>-1</sup>, 1030.76 cm<sup>-1</sup> and 424.11 cm<sup>-1</sup> [17].
The preparation of the panels consisted of: 1) grinding palm shell activated carbon, 2) filtered palm shell activated carbon using a 5-mesh laboratory sieve, 3) fabricating boxes with 1 cm x 20 cm x 20 cm and 2 cm x 20 cm x 20 cm by PVC, 4) filling the box with activated carbon and covering it with ram wire, 5) installing the panels on the wall, 6) placing three motorcycles, 7) turning them on and recording the results (Figure 2). A space measuring 4 m x 3 m x 2.1 m was prepared for measurement of air and noise pollution. The walls of the space were enclosed by block boards, facilitating easy installation. A total of three walls were designed without doors or windows, while the fourth side featured a glass window. The glass window enabled the observation of the room conditions from outside during the experiment.
Table 1 Characteristics of the 5-mesh palm activated carbon.
| _ | ||||
|---|---|---|---|---|
| Particle Size (Mesh) | Pore Diameter (nm) | Pore Diameter (nm) | Pore Diameter (nm) | |
| _ | 5 | 2.41 | 0.093 | 154.82 |
FTIR 5-mesh palm activated carbon.
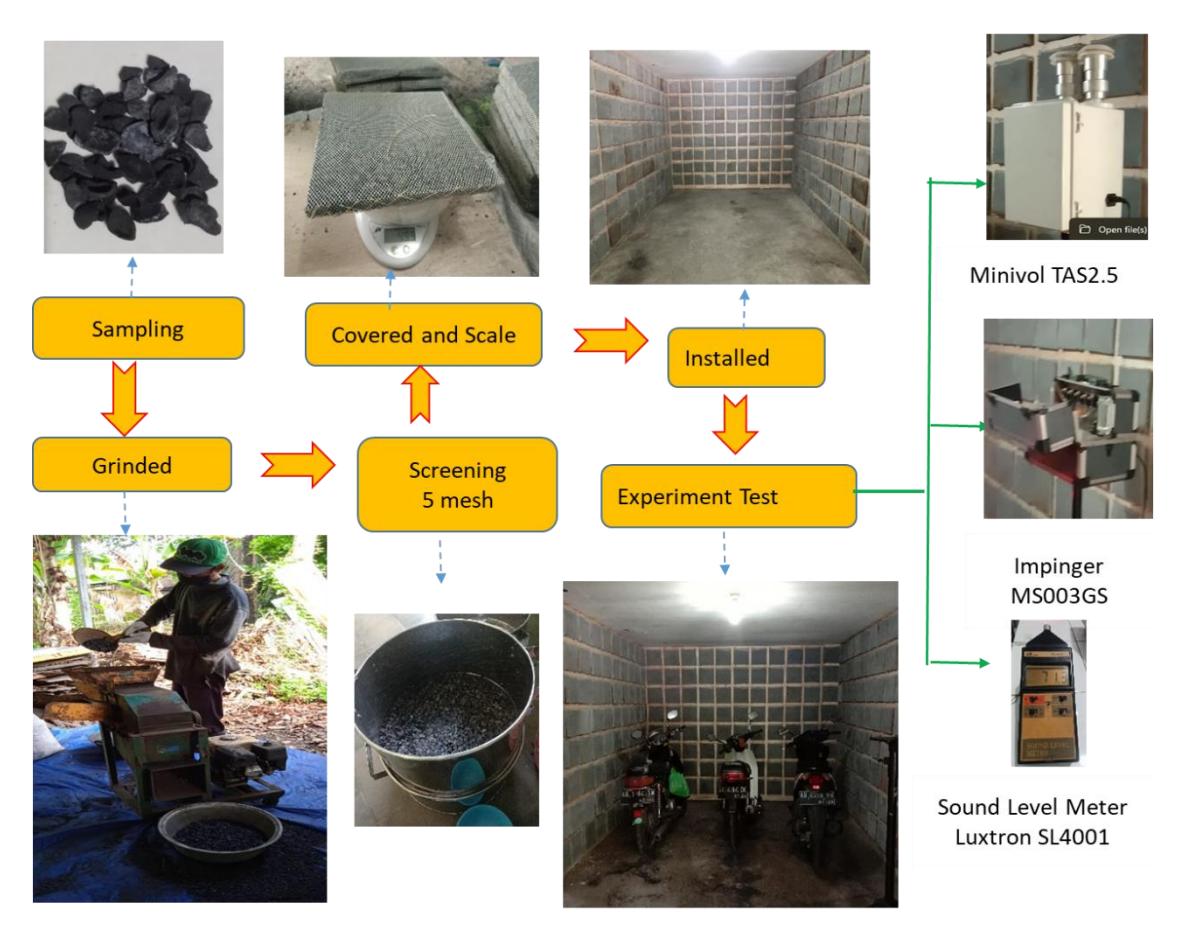
Experimental process flow.
For the study, three motorcycles were prepared as sources of pollution. The characteristics were: Suzuki AB 3784 SM, age 22 years, with Pertalite petrol as fuel type; Supra Fit AB 4194 CK, age 28 years with Pertalite petrol as fuel type; and Honda Beat AB 4359 HA, age 5 years with Pertamax petrol as fuel type. An Impinger MS003GS instrument was used to measure temperature, humidity, wind pressure, wind speed, CO, NO2 and HC levels. Minivol Air Sampler TAS2.5 and Sound Level Meter Luxtron SL4001 instruments were used to measure dust and noise, respectively. Standard sampling for CO, NO2, HC and Pb was done, referring to SNI 19-7119.6-2005, and the noise standard used was SNI 7231:2009. All the tools were placed behind the motorcycles, as shown in Figure 3.
First the activated carbon panels were installed on the wall of the enclosed room with dimensions of 4 m x 2.6 m x 2.1 m, as shown in Figures 2 and 3. Then the three motorcycles were placed in the experimental room. An access door with a width of 0.8 cm was available in the experimental room as well. The door could be opened and closed. A minivol air sampler and a sound level meter were also installed in the experimental room to measure exhaust gases and noise from the motorcycles.
In Case 1, activated carbon panels were not applied to the walls. The room contained only the three motorcycles and a device for measuring air quality and noise pollutants. In Case 2, 1-cm thick activated carbon panels were used to cover three sides of the walls, while in Case 3, the walls were covered with a panel thickness of 2 cm. Table 2 details the proportions of activated carbon used in each case.
| Case | Type | Total Panels | Activated Carbon Weight (gr) |
|---|---|---|---|
| Case 1 | No activated carbon panels | 0 | 0 |
| Case 2 | Three walls covered – activated carbon panel thickness 1 cm | 344 ad 456 gr | 156.864 |
| Case 3 | Three walls covered – activated carbon panel thickness 2 cm | 344 ad 558 gr | 191.952 |
Table 2 Proportions of the designed wall panels.
Sample test.
Experimental Process
In Case 1, the three motorcycles were placed inside the experimental room. Subsequently, the motorcycles were turned on simultaneously in idle mode and operated continuously for 8 hours without interruption. Various parameters, i.e., temperature, wind speed, wind pressure, humidity, noise, CO, and NO2 levels, were monitored every 1 hour. After running the motorcycle for 3 hours, an HC sample was extracted, and 8 hours later, a Pb sample was obtained.
In Case 2, the 1-cm thick activated carbon panels were installed on three sides of the room. Subsequently, the three motorcycles were introduced into the space, simultaneously turned on, and left idle for 8 hours and recorded every hour, with measurements taken similar to Case 1. In Case 3, the 2-cm thickness panels were installed on three sides of the room, and the three motorcycles were introduced. The sampling method and experimental procedures were consistent with Cases 1 and 2.
Upon completion of the experiment, the activated carbon before and after exposure of the contaminants was grinded to 14 mesh size. Subsequently, an analysis was conducted to determine the pore structure (SEM) and carbon content in the pores (EDX).
Results and Discussion
The results in Figure 4 show the variations in temperature, air pressure, wind speed, and air humidity following exposure to motorcycles emissions in the experimental room. The temperature increased at the 5th and 6th hour, after the motorcycles were started in Cases 1, 2 and 3. In Case 1, 2, and 3 the range was from 25.5℃ to 28.8℃, 25.8℃to 29℃, and 27.5℃ to 29.4℃, respectively, with the maximum values occurring at the 5th hour. Among the cases, the highest temperature was in Case 3, as presented in Figure 4a. Granular activated carbon is able of absorb pollution [18].
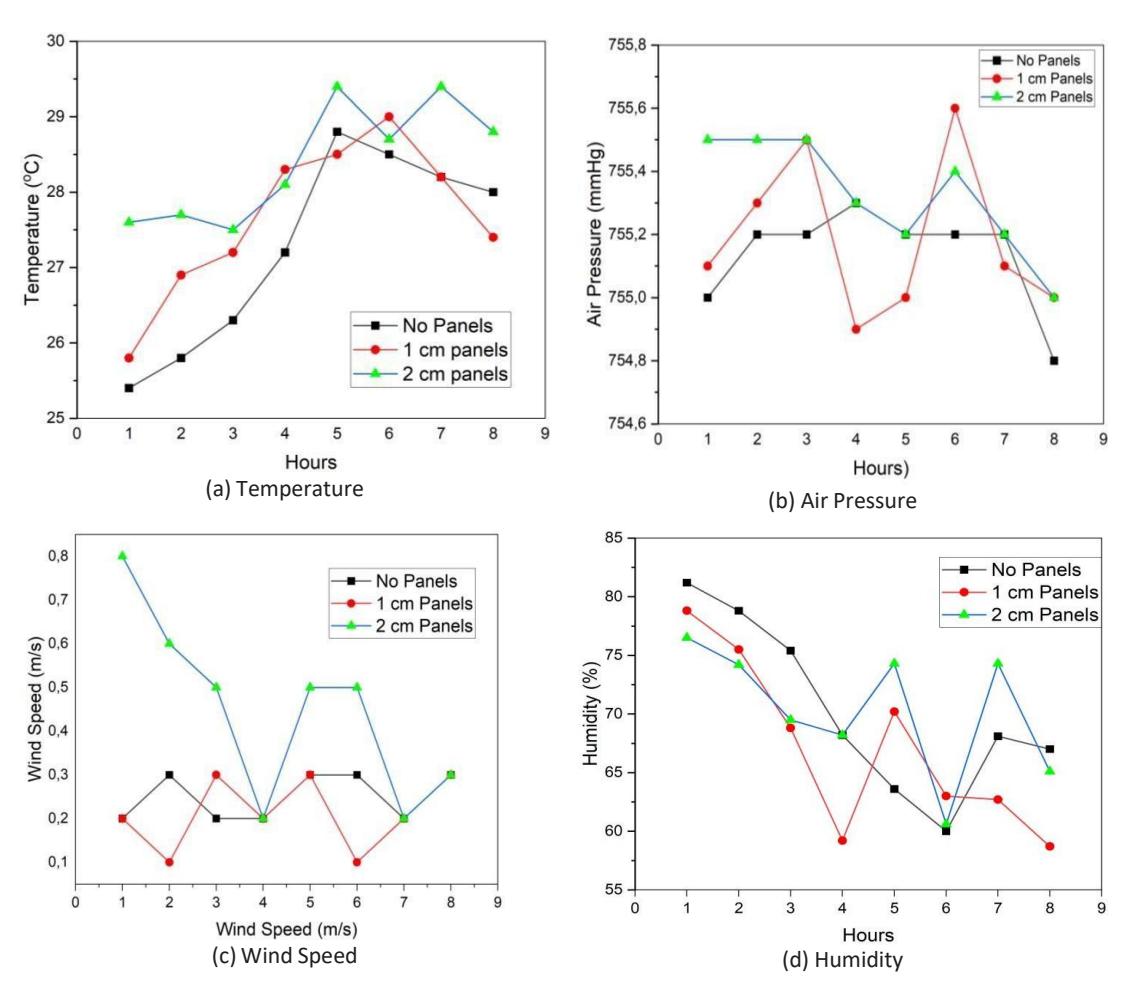
The weather conditions inside the experimental room: (a) temperature, (b) air pressure, (c) wind speed, (d) humidity.
On the other hand, the increase in temperature was accompanied by a decrease in room humidity. Cases 1 to 3 showed a consistent reduction in humidity. In Case 1, air humidity ranged from 60% to 81.2%, with the lowest and highest values recorded at the 6th and 1st hour, respectively. In Case 2, it was between 58.7% and 78.8%, with the lowest humidity recorded at the 1st to the 8th hour at 58.7%, while the highest humidity was measured in the 1st hour. In Case 3, the value was between 65.1% – 76.5%, with the lowest and highest humidity was recorded at 6th and 1st hour. A comparison of the graph indicates that Case 3 had the highest humidity, as shown in Figure 4(d). Ambient temperature and humidity are known to have a significant impact on most pollutants emitted by vehicles into the environment [19].
The air flow in the experimental chamber was influenced by the gas pressure from the motorcycles' exhaust. In Case 1, the air pressure ranged from 754.8 mmHg to 755.3 mmHg, remaining relatively stable from the 2nd to the 7th hour, with a subsequent decrease in the 8th hour. In Case 2, the value was between 754.9 mmHg to 755.6 mmHg, featuring a distinctive sharp rise and fall. The air pressure in Case 3 varied from 755 mmHg to 755.5 mmHg, showing a downward trend. A comparison analysis demonstrated that Case 3 had the highest air pressure. The differences in each case translated into changes in wind speed. The wind speed in the room before using activated carbon ranged from 0.2 to 0.3 m/sec, showing a fluctuating pattern. After using the 1-cm activated carbon panels, the range was 0.1 to 0.3 m/sec, with a similar fluctuation. Following the application of the 2-cm activated charcoal panels, the range became 0.2 m/sec to 0.8 m/sec, initially reaching high speed and subsequently decreasing, as presented in Figure 4(c). According to the Indonesian Minister of Health standard regulation number 1077/MENKES/PER/V/2011[20], good wind speed ranges between 0.15 and 0.25 m/sec. This shows that the speed in Case 3 exceeded the standard.
The basic component of activated carbon is charcoal, which consists of a large content of volatile chemicals but little water vapor. The water vapor absorbs humidity in the air quickly over time. Furthermore, activated charcoal absorbs the heat from motorcycles exhaust upon contact with smoke, contributing to a rise in room temperature.
The motorcycles were started in a closed room with few openings, causing the air in the space to absorb heat from the motorcycle exhaust. The emitted exhaust gases spread in the room, resulting in an elevation of the room temperature. In the absence of activated carbon, the room received smoke in accordance with the temperature emitted by the motorcycles. Following the installation of panels, the smoke interacted with the activated carbon, subjecting it to warming, exploiting their heat-storing properties. According to Minister of Health regulation number 1077/MENKES/PER/V/2011, the required temperature is between 18°C and 30°C, which was still met in the experimental room.
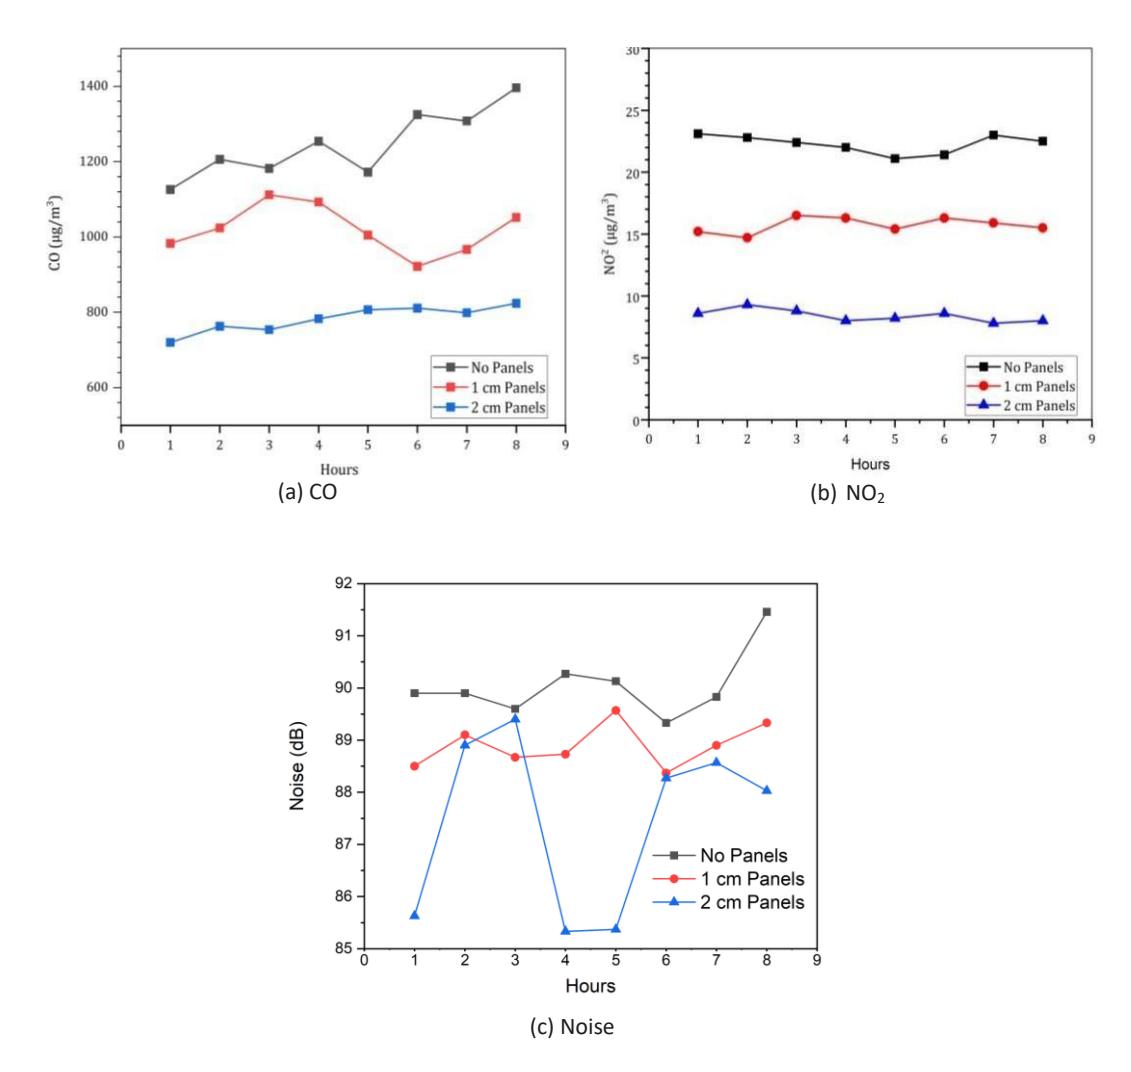
Figure 5 shows the levels of CO, NO2, and noise, while Figure 6 shows the levels of Pb and HC in the experimental room. CO levels in Case 1, 2, and 3 ranged from 1172 µg/m3 to 1398 µg/m3, 983 µg/m3- 1052 µg/m3, and 720 µg/m3- 824 µg/m3, respectively. This showed that the longer the motorcycles were running in idle mode, the higher the CO level and temperature. It is important to note that the CO level in Case 3 was smaller than in Cases 2 and 1. This implies that the reduction in CO in the room occurred due to the installation of the palm shell activated carbon panels. According to [21], such panels possess the capability to absorb CO molecules.
The initial concentration of NO2 in the experimental room was measured at 22.3 µg/m3. Following the application of the 1-cm panels, it decreased to 15.7 µg/m3, and with the 2-cm panels, the value further decreased to 8.4 µg/m3. This reduction is attributed to the installation of the activated carbon panels. The adsorption of NO2 on the activated carbon surface leads to the formation of surface complexes such as –C(O) and –C(ONO2) [22, 23].
Before treatment, the average noise level was 90.05 dB. After installing the 1-cm panels, it measured 88.9 dB, and with the 2-cm panels, the value decreased to 87.44 dB, as shown in Figure 5(c). This experiment showed modest reduction in noise due to installing the panels on the walls. The characteristic of granules being separated and the vibration-induced movement in between are assumed to be the reasons for the slight noise reduction.
The levels of CO: (a), NO2 (b) and noise (c) for each case.
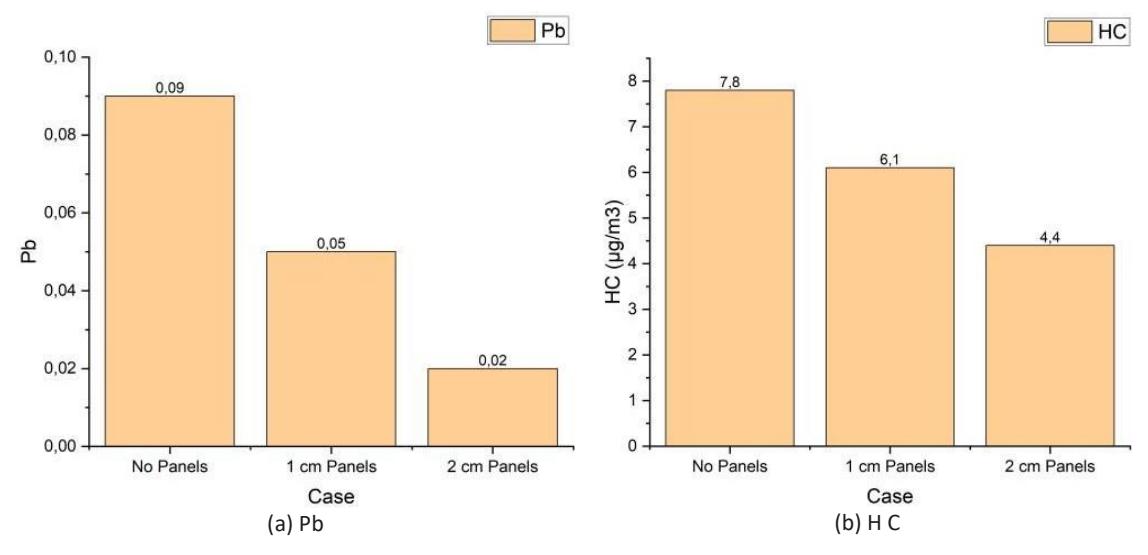
The levels of Pb (a) and HC (b) for each case.
In Case 3 there was a slight difference in results between hours 4 and 5. This was caused by the internal condition of the motorcycles, which causes changes in air pressure and wind speed. If the air pressure decreases, the wind speed also decreases, leading to a reduction in noise levels. This phenomenon coincided with the conditions observed during Case 2, which had an impact on the quality of the NO2 emissions released. When the engine reaches an idle speed of 800 to 850 rpm, the sharp fluctuations in power production from combustion may result in noise or vibration [24]. In this case, at 4 to 5 hours the machine went down and then went up again. When the engine starts again, the air pressure increases, and the engine's sound becomes stronger again.
Figure 6(a) shows that the Pb level before treatment (0.09 µg/m3) was higher than in Cases 2 (0.05 µg/m3) and 3 (0.02 µg/m3). As a result of installing the 1-cm panels, there was a decrease of 0.04 µg/m3 and with the 2-cm panels, the value decreased to 0.07 µg/m3. This data suggests that despite the small amount, there was still Pb content from the gasoline burners in the motorcycles that was reducible by the installation of panels. The same trends were observed with the HC levels, as shown in Figure 6(b). The HC levels in Case 1 were 7.8 µg/m3, while in Case 2 and 3, 6.1 µg/m3 and 4.4 µg/m3 were recorded, respectively. Despite the reduction being small, the installation of activated carbon panels caused a decrease in HC levels. Similar to CO, HC can also be adsorbed by activated carbon [25], resulting in a greater reduction in Case 3 compared to Cases 1 and 2.
Table 2 shows that the weight of activated carbon in palm oil shell was greater in Case 3 than in Case 2. The more activated carbon used, the greater the surface area, number of pores, and volume, allowing for the absorption of more pollutants. Activated carbon made from palm oil shell was identified to be very porous, with a fairly high solid density [26]. When raw palm shell is turned into palm shell charcoal, the surface area and density increase [27]. Palm shell-activated carbon panels have been proven to be capable of reducing CO, NO2, Pb, and noise levels.
Figure 7 shows SEM images of the morphology of the activated carbon before and after exposure to contaminants. The three micrographs indicate significant differences. The pores of the activated charcoal before exposure appear tight, while after treatment in Case 2, they have become larger. Following treatment in Case 3, the pores were larger and more numerous than in Case 2. The pore diameter before exposure was in the range of 0.17 to 3.652 µm. After exposure to contaminants for 8 hours with 1-cm panels on the walls, it increased to 0.33 to 4.32 µm, and with 2-cm panels, the value was 0.34 to 5.56 µm. Finally, exposure to motorcycle fumes causes the pores of activated carbon to enlarge, altering the surface morphology
Activated carbon before testing Activated carbon in 1-cm panels after testing
Activated carbon in 2-cm panels after testing
Activated carbon morphological condition.
Table 3 shows that palm oil activated carbon before being tested contained 68.32% C, 23.07% N, 6.73% O, and 8.68% others. Following the test with 1-cm thickness panels, the content became 94.27% C and 5.73% N. After testing with 2-cm panels, the content was 90.95% C and 9.05% N.
| Element | Before Testing | After Testing with 1-cm Panels | After Testing with 2 cm Panels |
|---|---|---|---|
| C | 68.32 | 94.27 | 90.95 |
| N | 23.07 | 5.73 | 9.05 |
| O | 6.73 | 0 | 0 |
| Mg | 0.12 | 0 | 0 |
| Si | 0.29 | 0 | 0 |
| K | 0.22 | 0 | 0 |
| Ca | 0.56 | 0 | 0 |
| Cu | 0.69 | 0 | 0 |
Table 3 EDX elemnt contents in the panels.
The characteristics of carbon show a decrease in oxygen content with rising temperatures, a trend starkly contrasting with the carbon pattern [28]. Exposure to flue gas emissions within the experimental chamber imparts a modest amount of heat to the activated charcoal in the panel, resulting in heightened carbon content and reduced nitrogen levels.
Activated carbon as adsorbent inherently operates in a saturated state, necessitating periodic regeneration. It is important to note that granular activated carbon has been successfully subjected to regeneration[29-32]. This capability raises optimism regarding the potential further development of palm shell-activated carbon panels, offering a promising avenue for mitigating air and noise pollution in an environmentally-friendly manner
Conclusion
In conclusion, the application of palm oil-activated carbon panels was proven successful in reducing levels of CO, NO2, HC, Pb, and noise in semi-enclosed rooms. Among the three cases explored, the 2 cm-panels in Case 3 had the most favorable outcomes. The data showed the superior performance of the 2-cm panels in gas reduction, with readings ranging from 720 µg/m3 to 824 µg/m3 for CO, 8.4 µg/m3 for NO2, 4.4 g/m3 for HC, 0.2 µg/m3 for Pb, and 87.44 dB for noise, respectively. The inherent characteristics of the panels, including the expansive surface area, substantial micropore volume, and robust adsorption capabilities, contributed significantly to the effective alleviation of both air and noise pollution. This activated carbon material can be applied in areas such as underground basement parking spaces with a larger coverage area by covering empty areas such as building columns and walls, which is a practical approach in reducing air pollution in rooms with inadequate ventilation. This innovative solution holds promise for addressing indoor air pollution with materials that are sustainable and environmentally-friendly.
Acknowledgement
The author is very grateful to the Yogyakarta Institute of Technology (ITY) for funding the Doctoral Project.
Compliance with ethics guidelines
The authors declare that they have no conflict of interest or financial conflicts to disclose.
This article does not contain any studies with human or animal subjects performed by any of the authors.