
Introduction
Practically, within both technical and non-technical restrictions, electric energy is delivered 24 hours a day, 7 days a week by various integrated structures constituting a power system (PS). To meet load demand, power systems are operationally managed using an economic method based on the power balance of the producing units, loads, and losses in the system [1, 2]. Sharing the total power output of each generation station to meet the total load demand, as expressed in an economic dispatch (ED) that minimizes the total cost subject to scheduling the committed generating unit outputs at minimum total cost within some operational constraints, results in a reduction in operating costs, expressed in the committed power production (CPP). The scheduling of generating unit outputs while considering the producing unit's running time is determined by how long it will take to meet the load demand based on loads fluctuating from one hour to the next during operation [3, 4]. Concerning operational restrictions, the power production is accommodated by a dynamic economic dispatch, which takes into account variations in load demand, where the demand is made up of static loads, dynamic loads, and flexible loads, that determines the CPP.
Additionally, variable load penetration has a significant impact on energy use, with EVs being a significant factor, because they are powered by the PS via charging stations [5, 6]. Technically, the charging process will affect the available power production of the scheduled power-sharing producing units. Since EV charging is now possible, providing the adequate amount of power necessary requires additional consideration of changes in demand [7, 8]. As a result, the variable load of EVs has to be taken into account in the power production scenario, allowing
for greater efficiency in the combination of the best generating units expressed in the CPP related to the overall operation under the trip pattern impact of EVs integrated in the power system.
Energy issues are still primarily solved using applications with a traditional approach and computational intelligence techniques. The CPP is determined considering relevant situations with some technological limitations and other needs, while EV inclusion is not yet commonly done. Thus, the inclusion of EVs in power operation offers the chance to evaluate their impact on the energy stock, which was the aim of this work. Further exploring the possibility of offering grid services requires an understanding of charging behavior and charging load profiles for present daily EV travel activities on each trip [9, 10]. The Orca Algorithm, a ground-breaking computational intelligence technique, is introduced in this study for assessing the best power output with EV inclusion. It was applied to the IEEE-62 bus system model while taking into account technical limitations and environmental considerations. To determine the optimal power balance over a 24-hour, 7-day period, the IEEE-62 bus system model was used to supply a PS with a mixture of non-flexible and flexible loads.
Electric Vehicle Trip Patterns
Recently, EV feasibility has started being considered, using the mobility responses to determine the state of charge level, which is assessed using multiday activity-travel patterns to overcome the limitations of using single-day activity travel patterns. Operationally, trip pattern type clustering, travel distance, and variability distribution are feasibility assessments for EV mobility [11]. EVs are the most well-liked as flexible loads have been connected to the electricity grid. Technically speaking, now that EV charging is a possibility, the process of providing electrical energy and the adequate amount of power necessary requires additional consideration of demand changes [12, 13].
Power consumption and unforeseen charging periods both have a substantial impact on the overall operation of power stations. The impact on power generation as well as the extra electric energy needed for particular charging patterns are the main subject of the study of economic dispatch [14, 15]. Additionally, it is essential to provide enough electricity for all EVs in the system at all times of the day, assuming that their batteries are fully charged in the morning, before the first excursion. This implies that comprehending the trip patterns is just as crucial as obtaining the precise number of EVs traveling during the day. Depending on the goal of the trip, excursions can be divided into four categories: 1) business/employment/study, 2) service/shopping, 3) leisure, and 4) other purposes. When analyzing journey patterns, EVs trips can be divided into one-way and two-way trips. These factors are also related to the battery's capacity and the time required for a complete charge. The number of EVs and the number of trips were approached as follows in Eqs.(1) and (2):
\[EV_{total} = \sum_{t=1}^{T} (EV_{onet} + EV_{twot})\] (1)
\[TRIP_{total} = \sum_{t=1}^{T} (TRIP_{onet} + TRIP_{twot})\] (2)
where EVtotal is the number of EVs, EVone is EVs making a one-way trip, EVtwo is EVs making a two-way trip, TRIPtotal is the total length of roads traveled, TRIPone is the total length of roads traveled on one-way trips, and TRIPtwo is the total length of roads traveled on two-way trips.
The CPP technique can be used to solve the economic problem of generating power cost-effectively for 24 hours [16]. To ensure that all power plants operate within the permitted fluctuations in generated power to cover EVs, it is also crucial to calculate the ideal product for each change in operation hours while considering dynamic changes. In addition, environmental protection is now being integrated into many aspects of business operations, including electricity generation and the placement of charging stations for EVs. Optimization is carried out using a technique in which the emission term in the objective function is compounded by a penalty factor [17]. Additionally, the problem is equivalent to that of the flexible approach, which offers a trade-off operation. The energy producer must be able to produce enough energy and the CPP problem has to minimize the total usage of generating units as well as over the entire scheduled period while taking into account a variety of constraints. The general formulation is as follows in Eq. (3):
min \[F = \sum_{t=1}^{T} \sum_{i=1}^{n} (a_i) P_{i,t}^2 + (b_i) P_{i,t} + c_{i,t} + \sum_{t=1}^{T} \sum_{i=1}^{n} (\alpha_i) P_{i,t}^2 + (b_i) P_{i,t} + g_{i,t}\] (3)
where F is the problem function ($); T is total time; n is the number of energy producers; P is the scheduled power (MW); a, b, and c are the cost coefficients of the energy producer; and α, and are the emission coefficients of the energy producer.
Orca Algorithm
The orca, often referred to as the 'killer whale', consumes a variety of prey, often specializing in particular kinds of marine mammals like seals and other dolphin species. Orcas can be found in all of the world's waters, from tropical oceans to the far northern reaches of the Arctic and Antarctic [18]. The three unique hunting techniques used by orcas also highlight extreme population variance. Orca hunting techniques are inventive and sophisticated and have evolved physiologically in reaction to their prey [19]. While flipping over in the Ray Plucking Strategy and going into a paralyzed state known as tonic immobilization, which necessitates synchronization, orcas have uncovered a surprising vulnerability in stingrays. When using the Surfing Seals Strategy, orcas stay close to the coast while waiting for the ideal conditions related to tides, seals, and the coastline. The Wave Washing Strategy begins with a group of five to seven orcas cooperating to chip away at the margins of floating ice, restricting the seal's sanctuary and making escape more challenging.
The hunting activity in this strategy is particularly intriguing since it may be used for instruction, social learning, or even teaching younger group members how to hunt effectively. By choosing prey based on strength and speed before catching anything, hunting can be seen as a significant aspect of orca society. An artificial intelligence technique called the Orca Algorithm was inspired by this hunting method. Thus, the Orca Algorithm consists of a selection stage, a speeding stage, and an ambushing stage, as shown in Figure 1. Searching for a maneuver that will result in the desired outcome while speeding is an intelligent mechanism. The selection stage is used to choose the ideal target from all potential targets to catch the intended prey. In addition, the number of orcas, wave factor, prey number, and hunting cycle are other variables used by the Orca Algorithm.
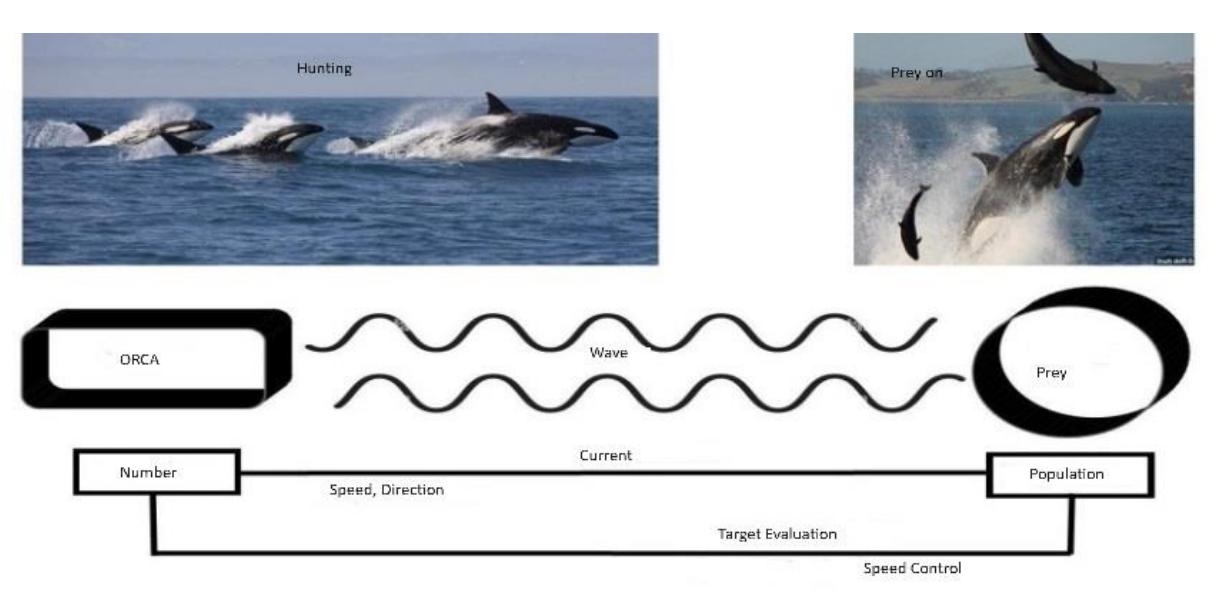
Model of orca hunting strategy.
System Model
In this work, the IEEE 62-bus system, which was updated to include a charging station with a load bus while multiple power plants are connected to it and EVs are integrated. The EV trips consist of one-way trips and twoway trips. Four trip patterns are distinguished: Mobility 1 covers work, business, and study strips; Mobility 2 covers service and shopping trips; Mobility 3 covers leisure trips; and Mobility 4 covers other trip purposes. The system should be controlled affordably as part of the power portion in conjunction with EV charging to solve the case problem [20].
Furthermore, operational limitations in this work forced the functional issue and solutions were sought for acceptable ranges of 95% power transfer capacity and 10% of total power loss. Additionally, the problem was restricted to 0.85 kg/kWh of emission and a compromised factor value of 0.5, which was bounded by upper and lower power limitations. Moreover, system loss and stability performance were neglected.
As already stated, each load bus in Figure 2 has both flexible and non-flexible loads, such as a power outlet for an electric vehicle charging station with a battery capacity of 35 kWh, vehicle usage at 0.175 kWh/km, power line charging at 3 kW/6 kW, and a cycle efficiency of 86 percent. Using the trip patterns, the routes were covered by both one-way and two-way trips, which were generated at random for the number of EVs per hour. Additionally, the Orca Algorithm mimics the orca's hunting strategy by utilizing methods referred to as phases, as shown in Figure 1. Technically, the Orca Algorithm goes through several stages that are related to the adoption of each part of the hunting strategy. These separate processes are based on: (1) a natural learning mechanism, i.e., using deep learning to find the appropriate natural mechanism, which is related to a key idea associated with the natural movements of the entity to be selected, where natural indicators become technical parameters; (2) adopting natural innovation, i.e., a step taken from the hunting strategy based on an intelligent concept that constructs models of natural learning mechanisms, with the models representing all of the natural mechanisms included in the whole structure; (3) computational model development, which is used for calculating the system in conjunction with several tools to get the final result. This step focuses on the hierarchy with pseudo-code for each stage, creating definitions during the whole compiling phase.
System model approach.
Figure 3 demonstrates the application of the Orca Algorithm to find the ideal combination of generating units to maintain energy reserves in the power system. The selecting phase is used for choosing the target, the speeding phase is used for locating a possible target, and the hunting phase is used for catching the desired target. The left side of the scheme focuses on the problem statement and data parameters for the system model and the problem case, which are limited by technical system requirements. The right side has all the procedures for determining the best solution while computing the system, representing the different phases of the Orca Algorithm.
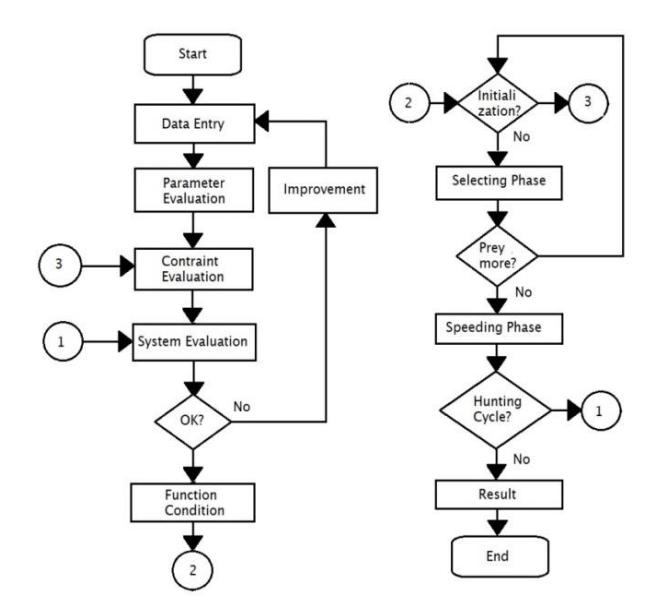
Application stages in the Orca Algorithm.
Result
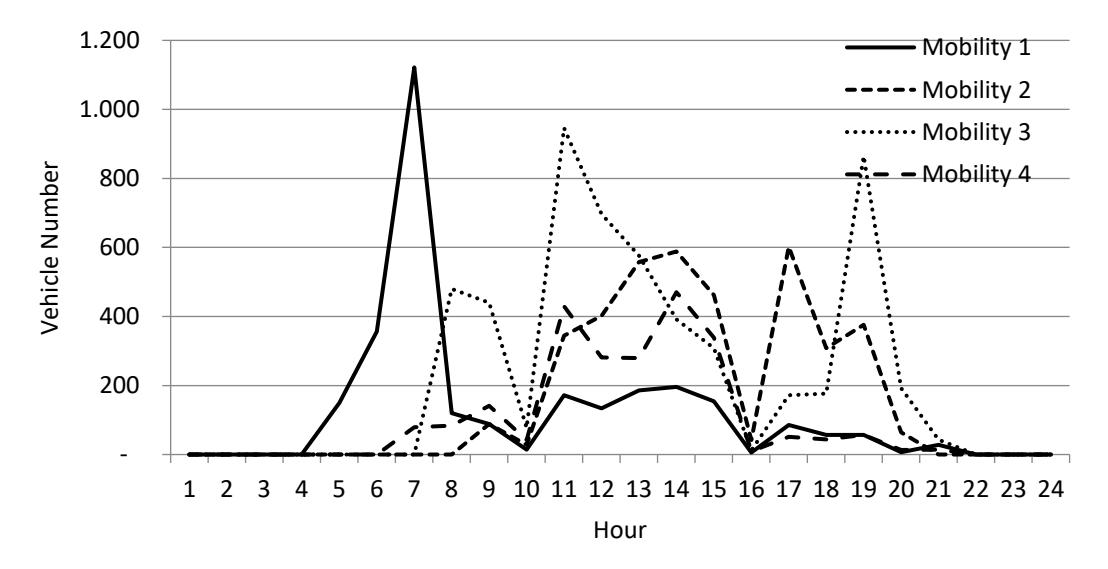
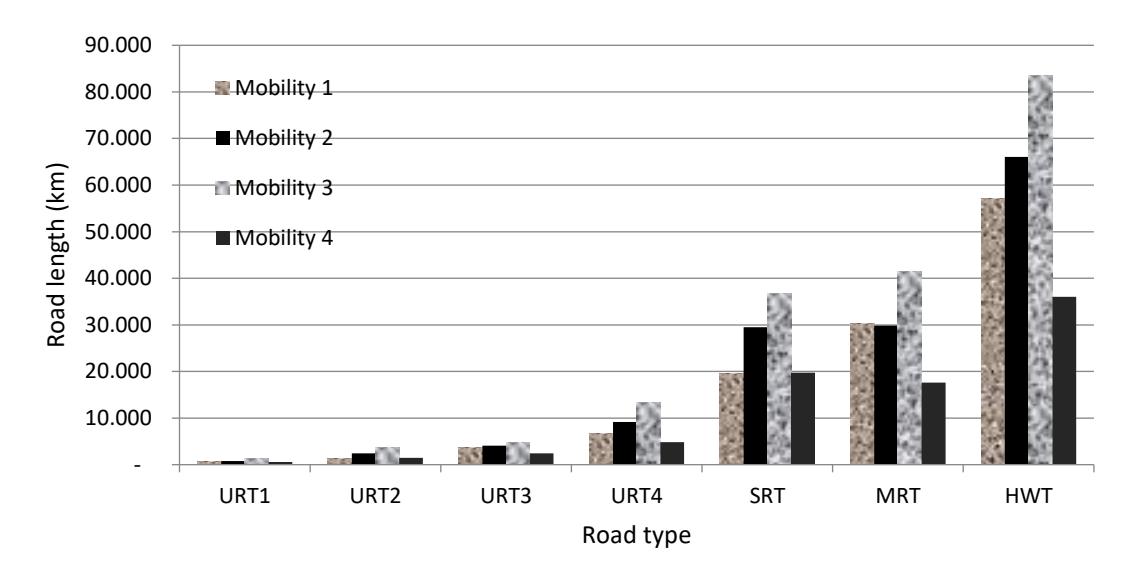
This study used the Orca Algorithm to search for the optimal power production, where the EV characteristics and impact are based on trip patterns. In addition, as mentioned in the previous section, the problem was run without consideration of power loss and stability performance [21]. Moreover, power production is associated with loads that vary hourly depending on energy user behaviors, while the driving patterns of the EVs are either one-way or two-trips. Inclusion of EVs in the system was used to calculate the best possible power output. This study was concerned with the flexible load associated with EVs, where the roads traveled are classified as Urban Road Type 1 (URT1), Urban Road Type 2 (URT2), Urban Road Type 3 (URT3), Urban Road Type 4 (URT4), Secondary Road Type (SRT), Main Road Type (MRT), and Highway Type (HWT). The trip patterns of the EVs are given in detail in Figure 4, while the mobility for 24 hours is provided in Figure 5. Figures 4 and 5 depict the driving patterns of a total of 14,504 EVs. Approximately 2,933 EVs traveled for work/business/study purposes, 3,862 EVs traveled for service/shopping activities, approximately 5,376 EVs traveled for leisure purposes, and 2,334 EVs travel for other reasons. Regarding the EV trips for various activities associated with one-way and twoway trips for route completion, Figures 6 to 9 show the mobility performance on the road.
Trip pattern characteristics.
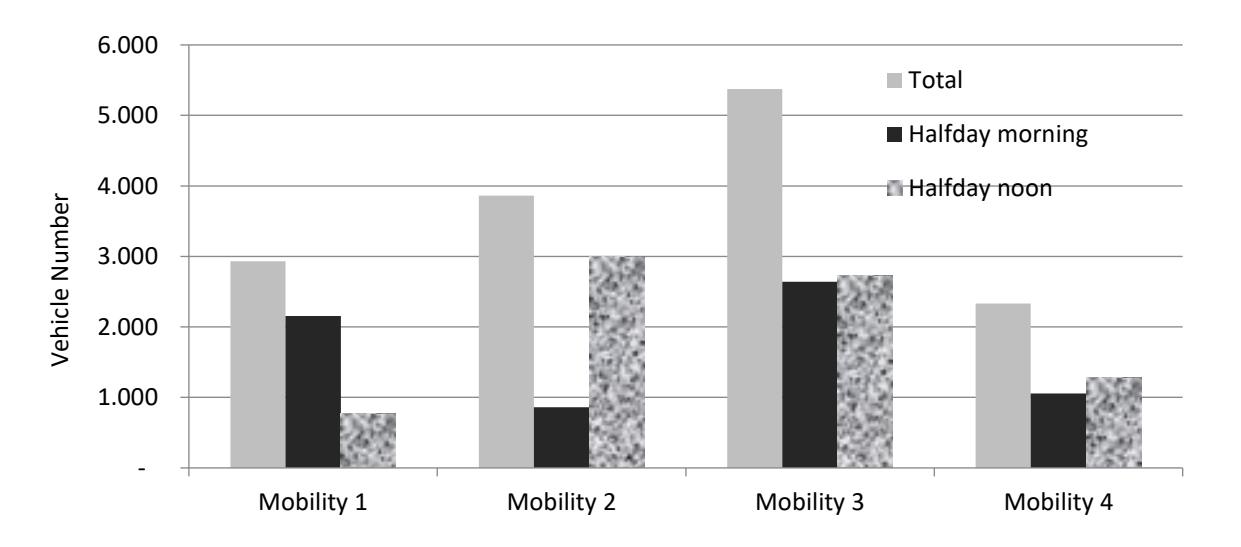
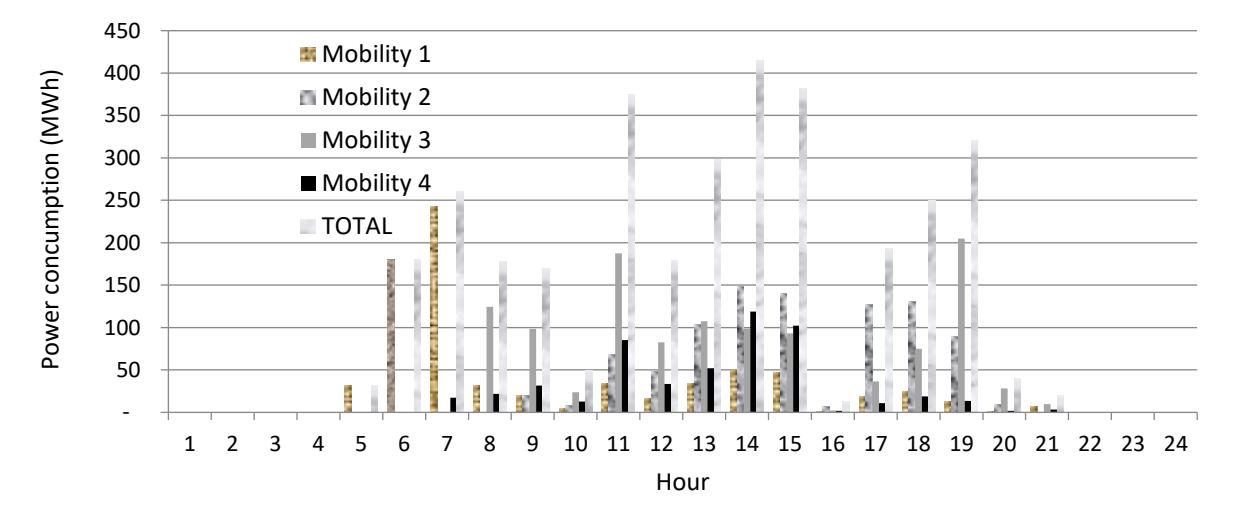
Figure 5 Vehicle mobility.
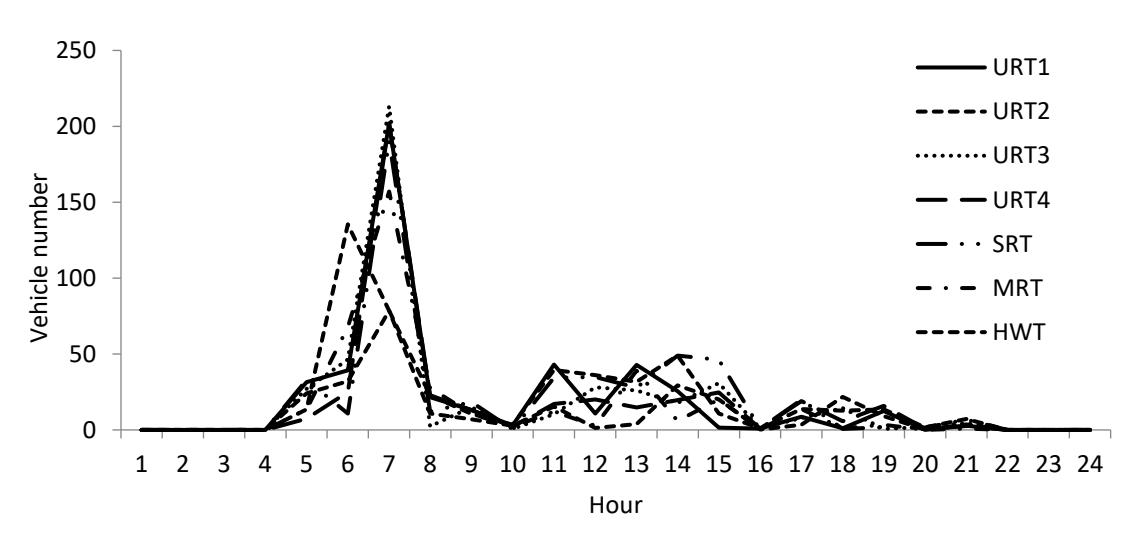
Figure 6 Driving characteristics for Mobility 1 on the road.
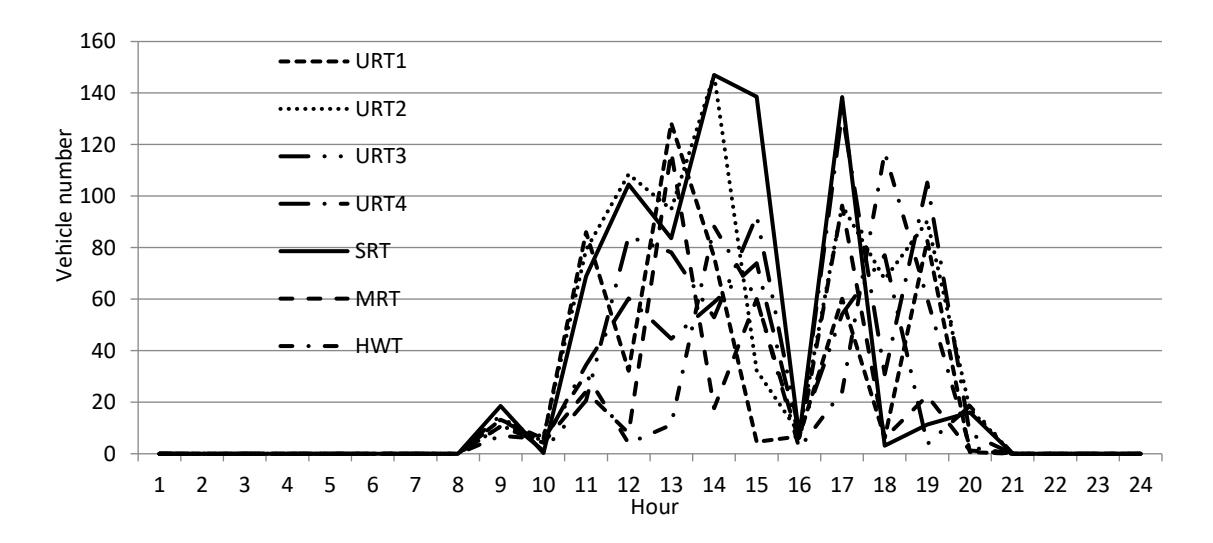
Figure 7 Driving characteristics of Mobility 2 on the road.
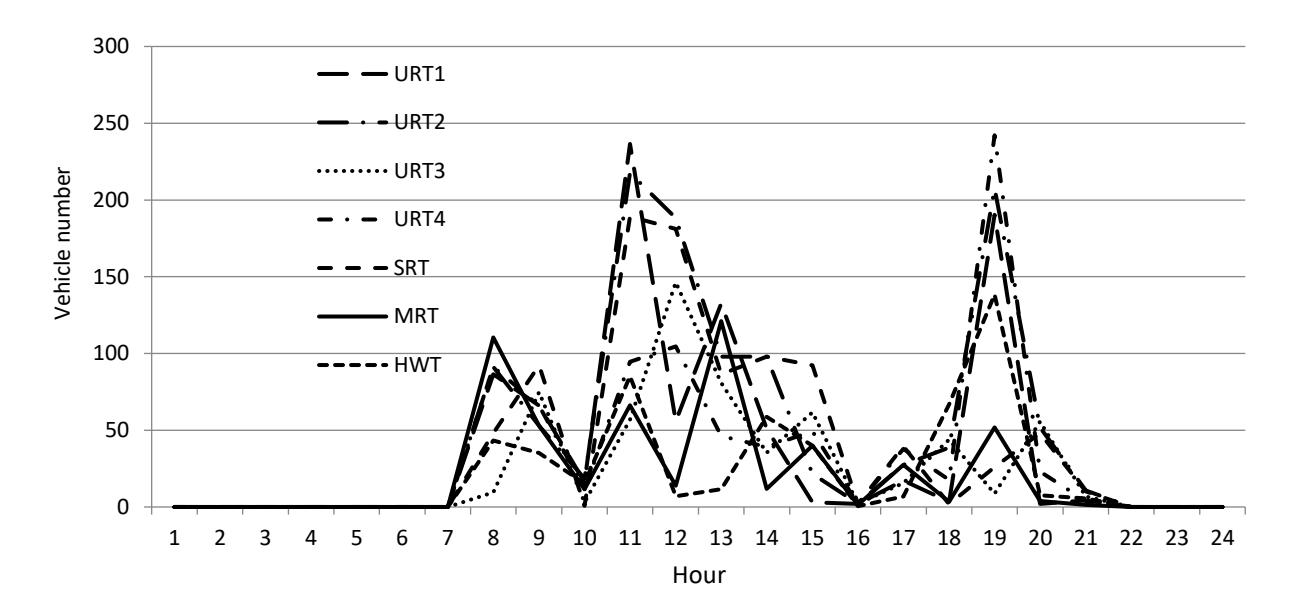
Driving characteristics of Mobility 3 on the road.
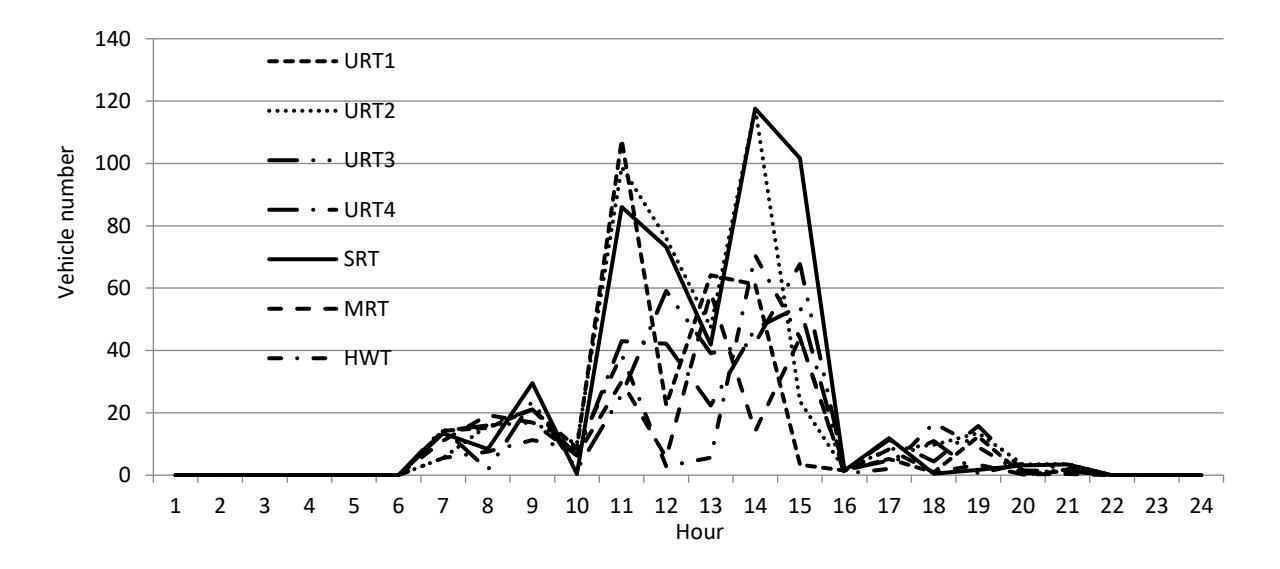
Driving characteristics of Mobility 4 on the road.
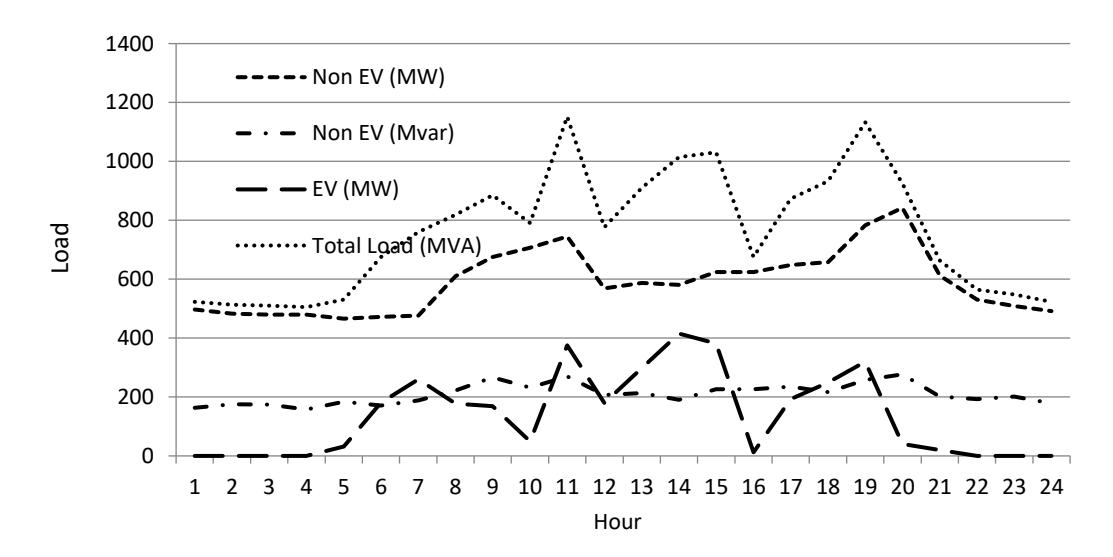
Table 1 shows the specifics of the EVs in terms of mobility. Technically, EVs are powered by a power system with varying energy usage via a charging station located anywhere when they need to be charged. The EV power consumption characteristics are shown in Figures 10 and 11, which depict one-way and two-way trips for mobility and road type, respectively. In these experiments, the EVs operated at 90% battery capacity to keep it healthy, and it should be minimally charged at 10% capacity when driving patterns are present. The EV performance is illustrated in Figure 12 for the different trip patterns in terms of driving mileage. Figure 13 depicts the hourly load profile of the system, which includes static, dynamic, and flexible loads. Considering demand variations, the total load should be serviced by all power outputs of coupled producing units. The system had a total demand of 17,504.3 MW, including 14,151.5 MW for non-flexible loads and 3,352.8 MW for EVs. This power production was also used for charging EVs. The EVs traveled 119,018 km in one whole day in Mobility 1, 141,799 km in Mobility 2, 184,614 km in Mobility 3, and 82,637 km in Mobility 4. These loads must be met by energy producers in the best possible combination for each CPP. Table 2 gives the details of the power balance during 24-hour operation for different CPP capacities.
Table 1 Mobility for 24 hours in terms of number of vehicles.
| One-way mobility | Two-way mobility | |||||||
|---|---|---|---|---|---|---|---|---|
| Time | Mobility | Mobility | Mobility | Mobility | Mobility | Mobility | Mobility | Mobility |
| 1 | 2 | 3 | 4 | 1 | 2 | 3 | 4 | |
| 1 | - | - | - | - | - | - | - | - |
| 2 | - | - | - | - | - | - | - | - |
| 3 | - | - | - | - | - | - | - | - |
| 4 | - | - | - | - | - | - | - | - |
| 5 | 135 | - | - | - | 15 | - | - | - |
| 6 | 324 | - | - | - | 32 | - | - | - |
| 7 | 516 | - | - | 39 | 606 | - | - | 40 |
| 8 | 86 | - | 317 | 77 | 34 | - | 163 | 7 |
| 9 | 58 | 63 | 233 | 99 | 30 | 25 | 207 | 42 |
| 10 | 10 | 28 | 40 | 24 | 4 | - | 37 | 18 |
| 11 | 169 | 213 | 766 | 348 | 3 | 131 | 180 | 82 |
| 12 | 62 | 173 | 453 | 189 | 72 | 229 | 244 | 93 |
| 13 | 123 | 296 | 329 | 159 | 63 | 262 | 248 | 120 |
| 14 | 80 | 347 | 176 | 310 | 116 | 241 | 216 | 160 |
| 15 | 83 | 416 | 305 | 213 | 71 | 46 | 3 | 125 |
| 16 | 3 | 38 | 7 | 8 | 3 | 4 | 5 | 1 |
| 17 | 59 | 536 | 141 | 44 | 27 | 66 | 31 | 7 |
| 18 | 38 | 228 | 160 | 42 | 19 | 80 | 16 | 2 |
| 19 | 36 | 226 | 346 | 45 | 20 | 150 | 519 | 11 |
| 20 | 4 | 42 | 96 | 12 | 2 | 22 | 96 | 1 |
| 21 | 17 | - | 40 | 12 | 11 | - | 3 | 3 |
| 22 | - | - | - | - | - | - | - | - |
| 23 | - | - | - | - | - | - | - | - |
| 24 | - | - | - | - | - | - | - | - |
Power consumption related to trip pattern.
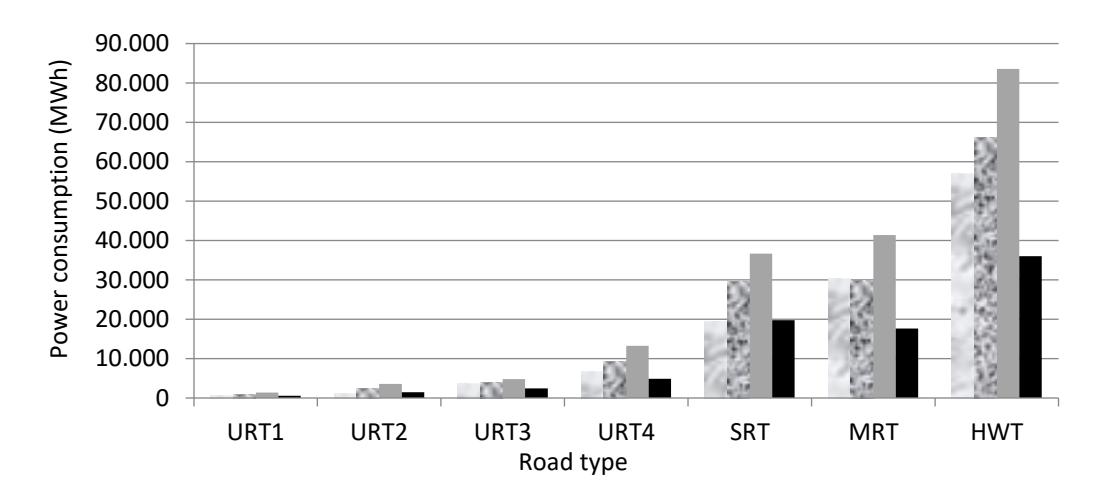
Power consumption on the road.
Trip pattern related to driving mileage.
Load demand characteristics.
| Hour | Total Load (MW) | Production (MW) | Hour | Total Load (MW) | Production (MW) |
|---|---|---|---|---|---|
| 1 | 497.0 | 522.1 | 13 | 884.8 | 931.7 |
| 2 | 483.1 | 514.1 | 14 | 996.3 | 1046.5 |
| 3 | 479.5 | 520.7 | 15 | 1005.6 | 1075.3 |
| 4 | 479.9 | 505.9 | 16 | 636.1 | 668.0 |
| 5 | 497.8 | 533.0 | 17 | 840.9 | 890.5 |
| 6 | 652.8 | 683.6 | 18 | 907.7 | 962.3 |
| 7 | 736.5 | 774.9 | 19 | 1103.8 | 1178.7 |
| 8 | 788.0 | 840.8 | 20 | 882.7 | 938.6 |
| 9 | 844.1 | 885.0 | 21 | 632.3 | 670.7 |
| 10 | 755.8 | 798.1 | 22 | 530.4 | 568.6 |
| 11 | 1119.9 | 1192.7 | 23 | 509.4 | 533.7 |
| 12 | 748.1 | 803.3 | 24 | 491.7 | 522.2 |
Table 2 Power balance procurement
Conclusion
With electric vehicles (EVs) integrated into the power system, the power producing units work in conjunction according to a committed power production plan that allocates power output based on load demand at a given time, which requires retaining stated operational limits to cover flexible loads over a 24-hour period. The integration of EVs as a flexible load into the power system has an impact on the system's operation related to trip patterns for mobility. The evaluation based on the Orca Algorithm showed that achieving appropriate power production depends on EV trip patterns, which lead to variation in hourly power consumption, with the power demand also depending on the different charging characteristics related to the various activities. Future implementation of EV integration will be our next focus.
Compliance with ethics guidelines
The authors declare that they have no conflict of interest or financial conflicts to disclose.
This article does not contain any studies with human or animal subjects performed by any of the authors.