
Introduction
Early building codes, while revolutionary at their inception, were primarily based on practical experience and lacked the rigorous scientific analysis characteristic of modern standards. With advancements in engineering and safety sciences, building codes have evolved significantly. A pivotal moment for Indonesia's structural design came with the adoption of ASCE (American Society of Civil Engineers) rules in 2002 [1], marking a transition to more comprehensive seismic analysis frameworks.
This shift reflects a fundamental change in philosophy on structural safety, moving from a focus on uniform hazard which considers site seismic hazard alone—to uniform risk, which also incorporates the collapse fragility curve. While neither approach is inherently superior, the adoption of uniform risk in the newer code signifies a notable evolution in seismic design philosophy.
The return periods prescribed by these codes directly influence the response spectrum used in seismic analyses. A comparison of the nominal response spectra for SNI 1726:2002 and SNI 1726:2019 reveals that the latter has larger values across all periods. Additionally, response modification factors significantly affect the nominal response spectrum.
Previous studies have explored the seismic load differences between SNI 1726:2012 and SNI 1726:2019 [2] and the design outcomes between these two standards [3].
Subianto and Sutriono [4] examined a hospital structure designed under SNI 1726:2002 against the 2019 standard. While previous studies have examined the transition from SNI 1726:2012 to SNI 1726:2019, this research focused on the more pronounced differences between SNI 1726:2002 and SNI 1726:2019, particularly regarding their return periods and
earthquake load philosophies. By concentrating on these distinctions, this study sought to provide a deeper understanding of how changes in standards may impact structural design.
This paper assessed the seismic performance of a forty-story office building designed according to SNI 1726:2002, utilizing a comprehensive Tier-3 evaluation method from ASCE 41-17. The study employed both non-linear static (pushover) and non-linear dynamic (time-history) analyses to investigate discrepancies in structural behavior and safety under the different codes. While the pushover method is increasingly prevalent in practice, the need for thorough evaluation using non-linear time history analysis (NLTHA) is underscored, especially with the recent publication of disaggregation maps by Indonesia in 2021, which facilitate the NLTHA procedure.
Methodology
The research process is visually depicted in Figure 1, outlining the key steps undertaken. Essential structural data, encompassing location, material specifics, and lateral systems of the structure, were gathered and compiled. The material and structural specifications served as the basis for establishing non-linear parameters for each structural element. Utilizing these parameters, the structure was then meticulously modeled.
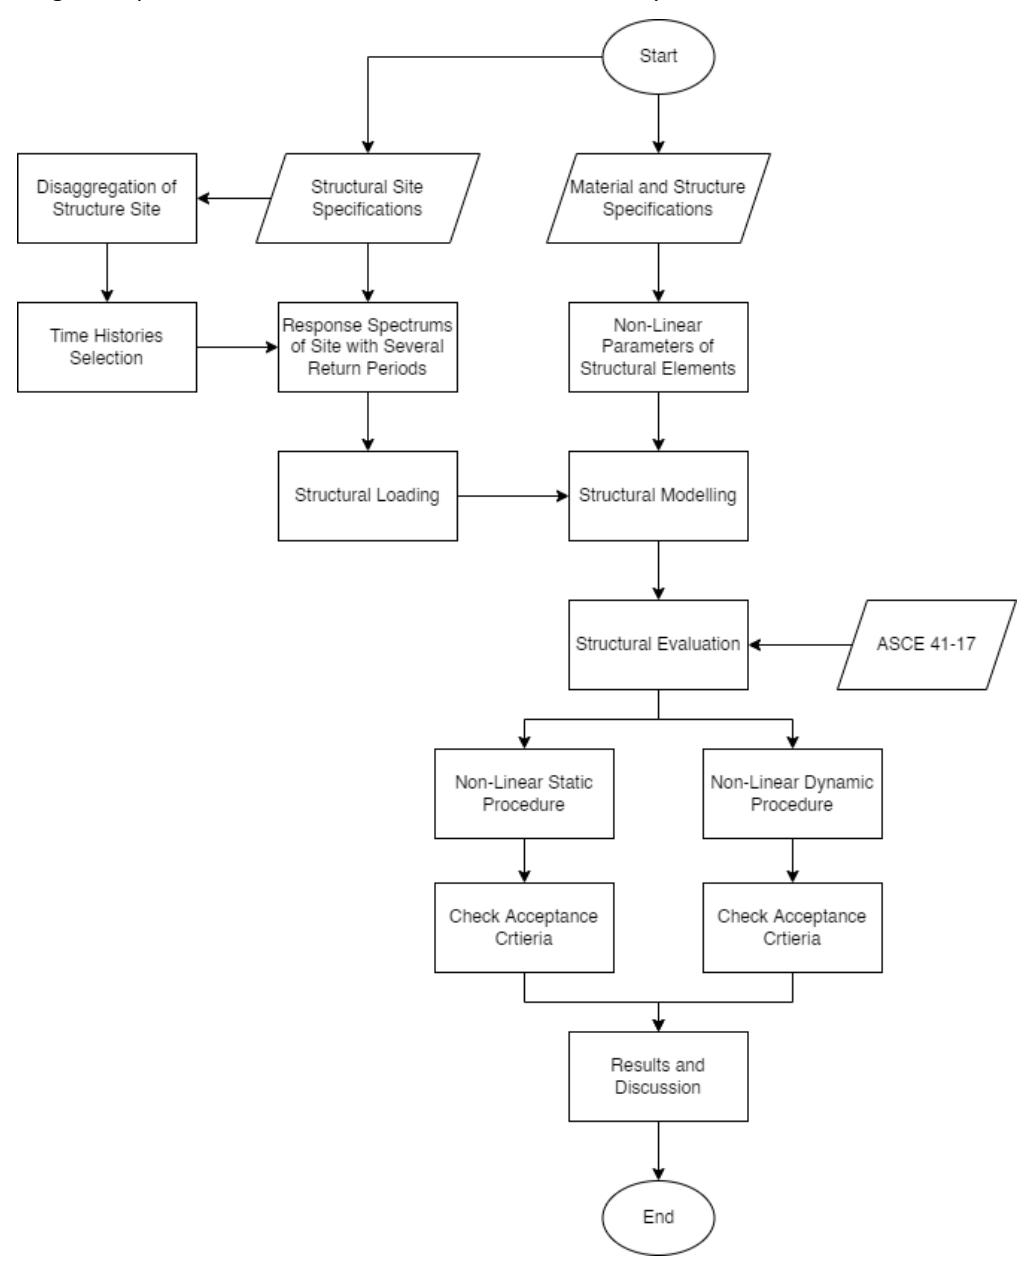
Proposed methodology.
The integration of non-linear analysis involved the precise definition of non-linear parameters. In this specific model, non-linear analysis modeling was executed through the strategic utilization of plastic hinge models. This approach, rooted in plastic hinge modeling, has proven its efficacy in assessing seismic requirements [5]. Plastic hinges were allocated to open frame terminations, while wall components were portrayed using fiber elements.
Conversely, the site-specific structural details guided the determination of response spectrums, crucial loading parameters for the subsequent pushover analysis. Disaggregation of the structure's location played a pivotal role in selecting pertinent time histories, which were then tailored to match target spectrums. These time histories, transformed into acceleration loads, formed the basis for non-linear dynamic analysis.
The assessment of the structure unfolded by subjecting the modeled structures to corresponding loads derived from both pushover and non-linear time history procedures, adhering to the ASCE 41-17 guidelines [6]. The evaluation of acceptance criteria was conducted for structural components under both pushover and non-linear time history analyses. The paper further delves into a comprehensive discussion of the performance of these two procedures.
Description of Model under Study
The structure under examination was a residential office building, specifically chosen for its office-like layout. The seismic lateral system of the building employs a dual system design following the guidelines in SNI 1726:2002. Comprising forty standard stories, the building reaches a total height of 140 meters, with each story spaced 3.5 meters apart. Engineered for the seismic conditions of Jakarta's region, situated in seismic zone 3 atop soft soil, the structure's initial mode exhibits a period of 3.51 seconds. Employing modal combination analysis, the assessment ensure that the ratio of participating mass surpasses 90%.
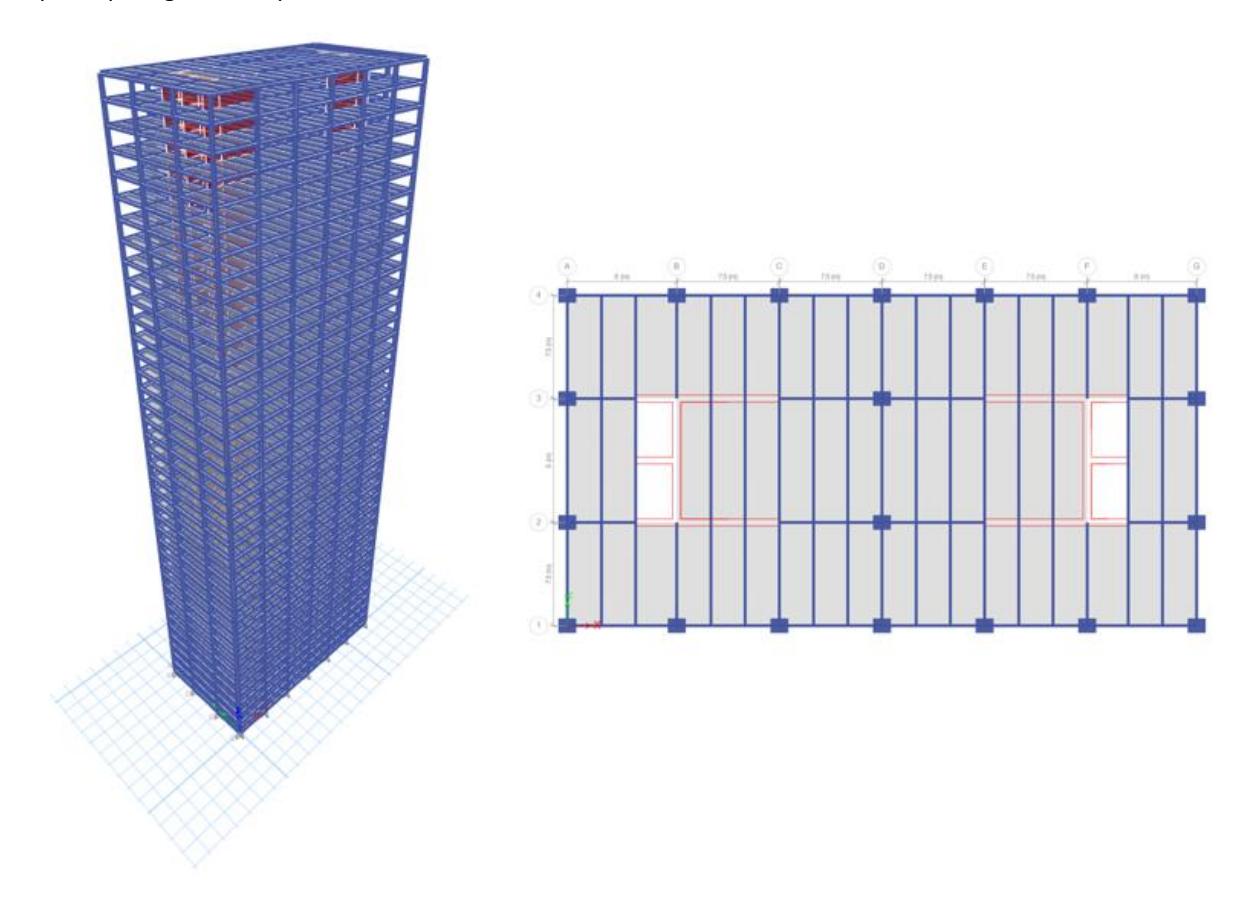
Structure model and layout.
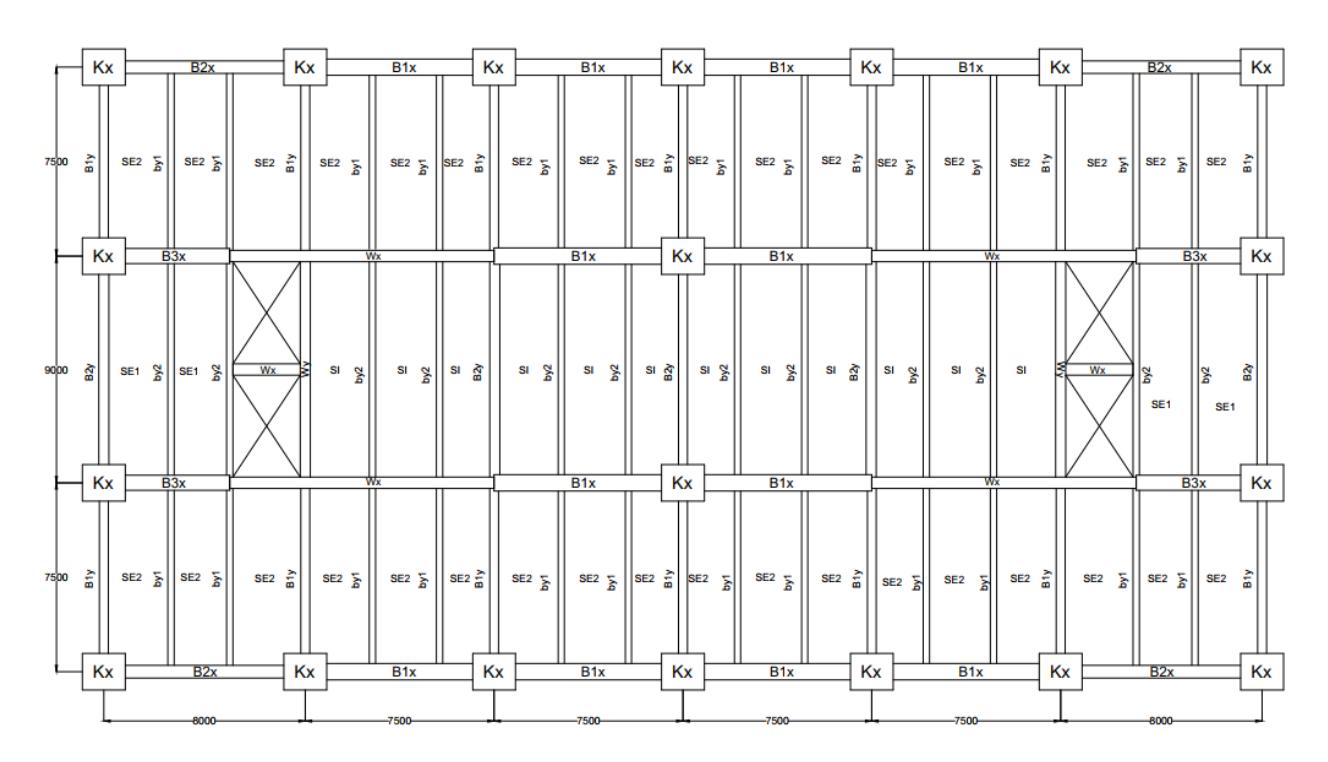
Typical layout of the structural elements.
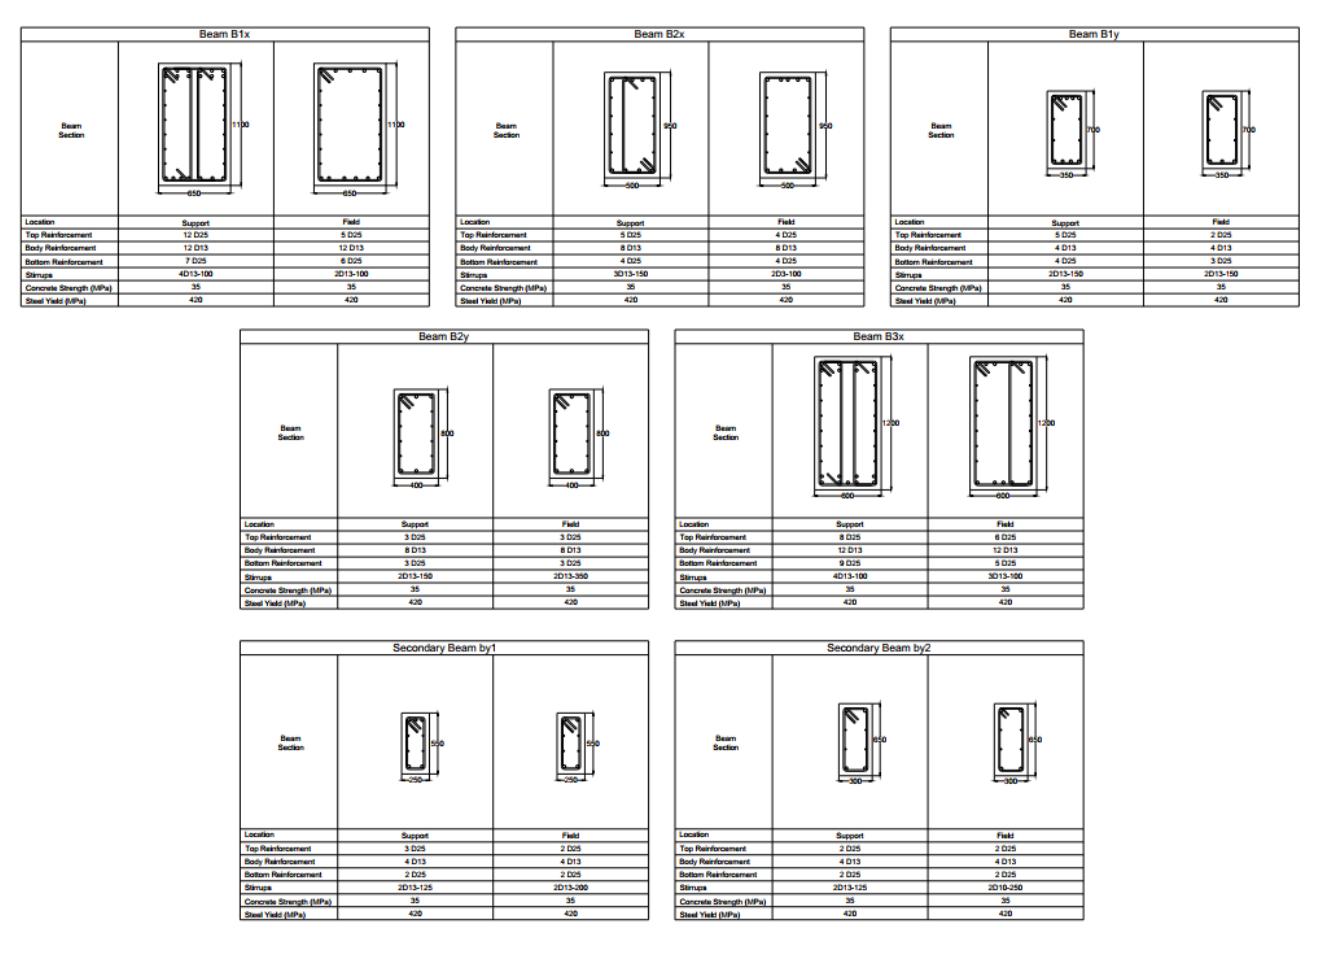
Beam dimensions and reinforcements.
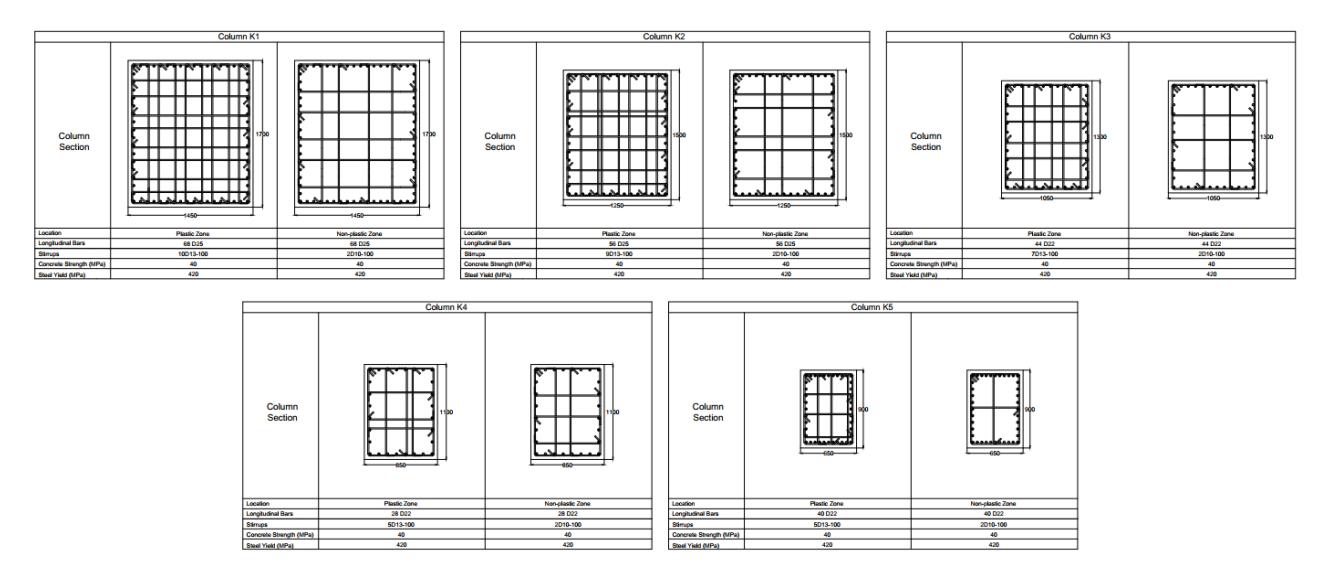
Column dimensions and reinforcements.
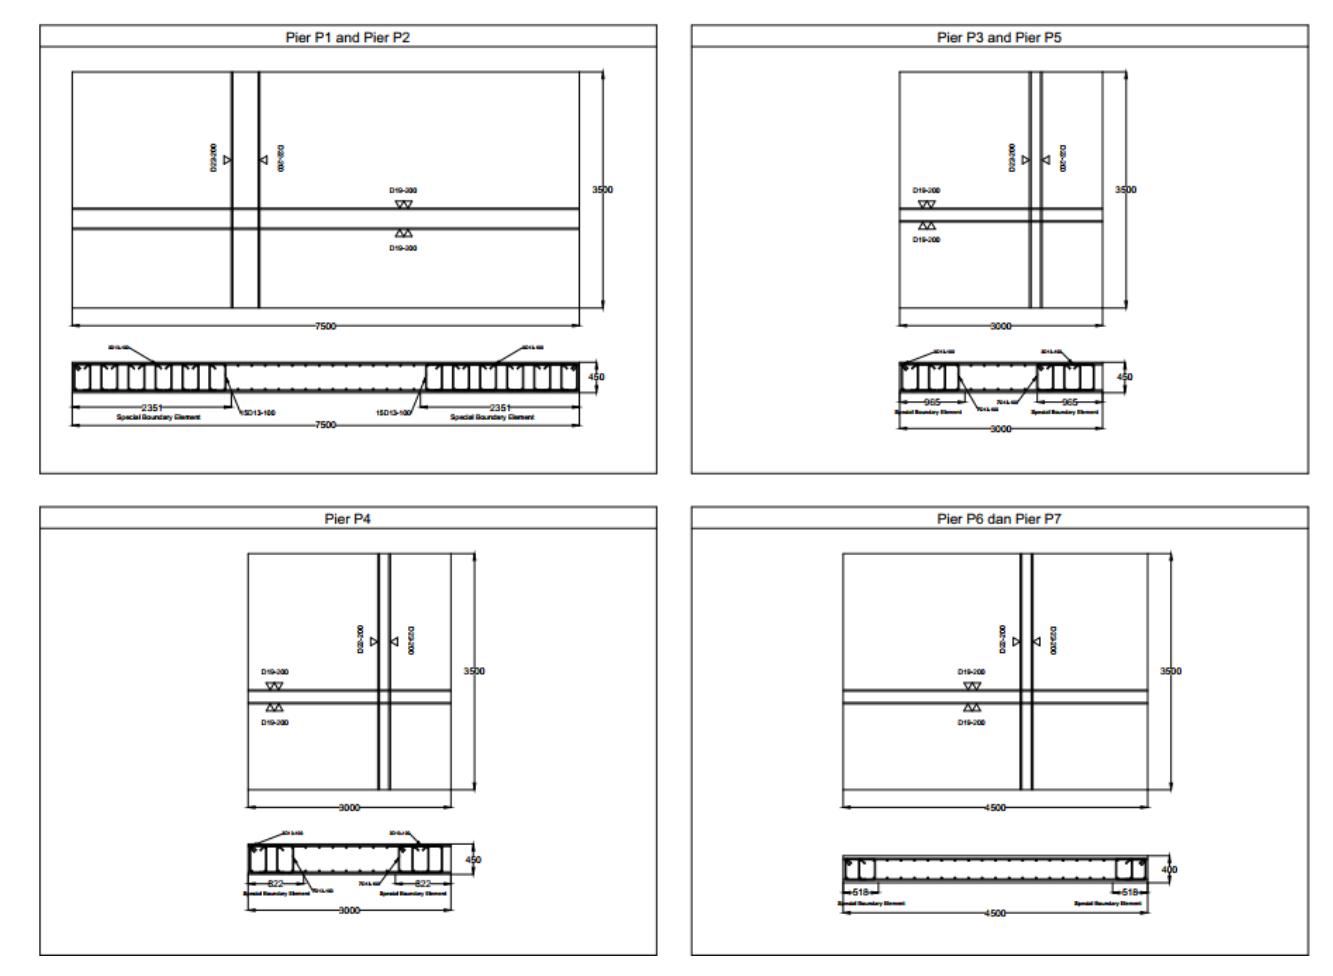
Shear wall dimensions and reinforcements.
Hinge parameter calculations were derived through sectional analysis, guided by the principles outlined in the ASCE 41- 17 guidelines. The behavior of unconfined and confined concrete material follows Mander's model [7], while typical steel stress-strain with strain hardening is used. In this context, the pre-yielding phase of each plastic hinge is considered completely rigid, devoid of any pre-yield deformations. The stress-strain properties used in formulating the plastic hinges following the Kent and Park model [8] can be seen in Figures 7 and 8.
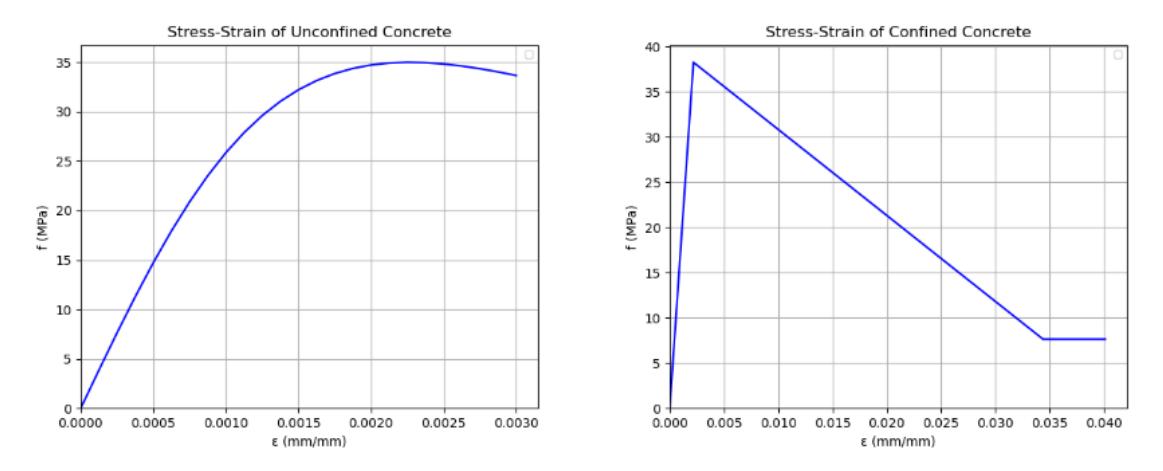
Stress-strain model of unconfined and confined concrete.
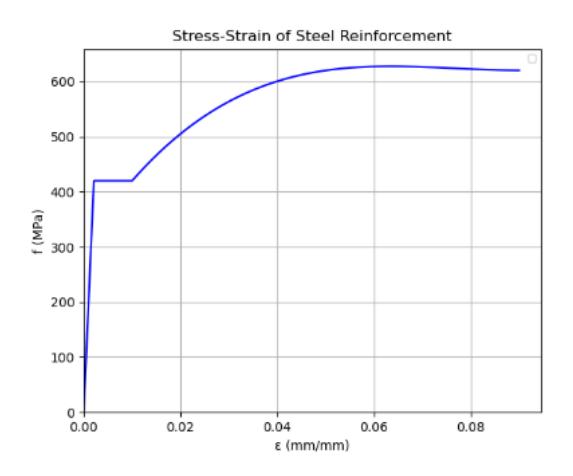
Stress-strain model of steel reinforcements
The representation of non-linear behavior varies: standard beam elements employ the moment deformation curve, while column elements adhere to the axial-moment deformation curve. A visual depiction of the plastic hinges incorporated into the model is presented in Figure 9.
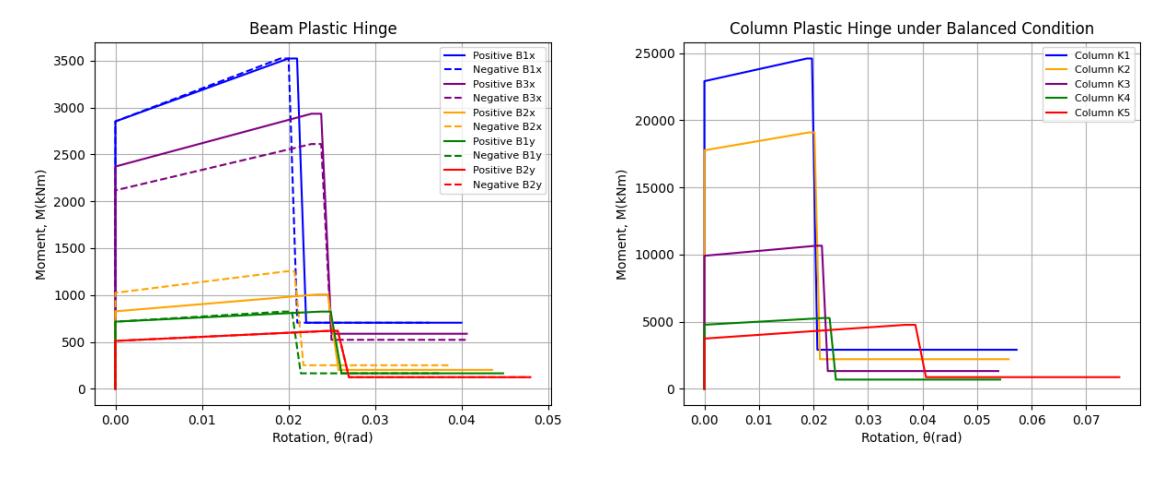
Plastic hinge parameters.
Seismic Loading
Figure 10 illustrates a comparison between the spectrum responses of the older and current codes. The graph highlights a noteworthy distinction: the design earthquake value of the 2002 code surpasses that of the 2019 code. However, it is important to acknowledge that nominal earthquake values, which are crucial for design considerations, come into play. Nominal earthquake values are derived from dividing the design earthquake spectrum by the response modification factor. While the 2002 code permits a response modification factor of 8.5, the 2019 code limits it to 7 [9]. Notably, Figure 10 emphasizes that the more recent code mandates a heightened nominal earthquake force across all periods, including the initial mode period.
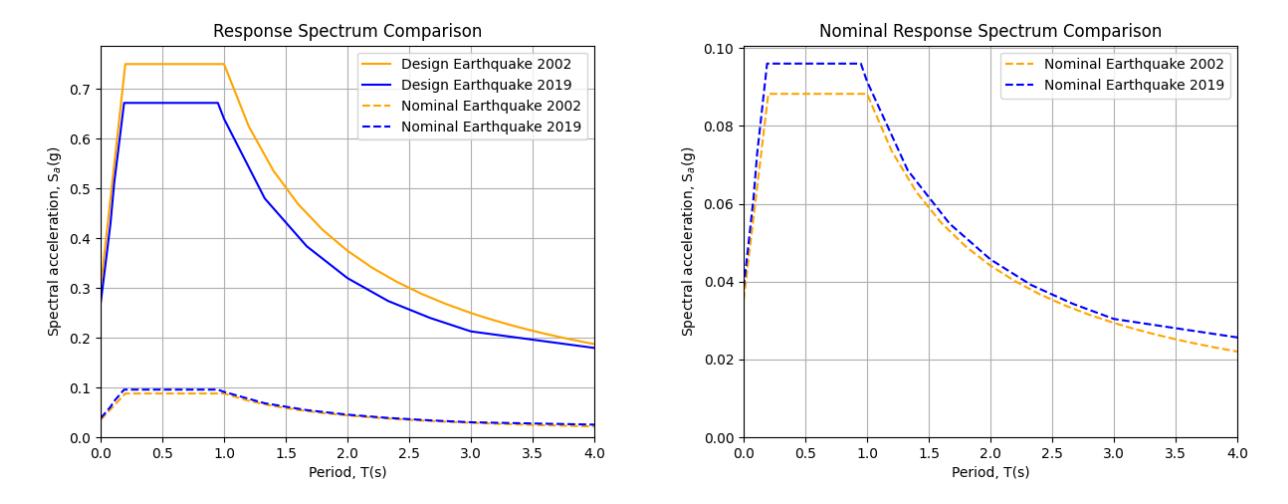
Response spectrum comparisons of design earthquakes and nominal earthquakes.
The ASCE 41-17 guidelines stipulate that the evaluation should encompass earthquake response spectrums spanning 225 years and 975 return periods. In alignment with the terminology of ASCE 41-17, this study adopted the designation BSE-1E for the 225-year return period and BSE-2E for the 975-year return period. These target spectrums were derived from a spectrum map issued by PuSGen, an organization focused on the study of earthquake phenomena in Indonesia and supported by local authorities [10]. A comparative examination in Figure 11 highlights the contrast between the acceptance criteria target spectrums of BSE-1E and BSE-2E and other prevailing response spectra. These target spectrums are directly used in the pushover analysis as demand spectrums.
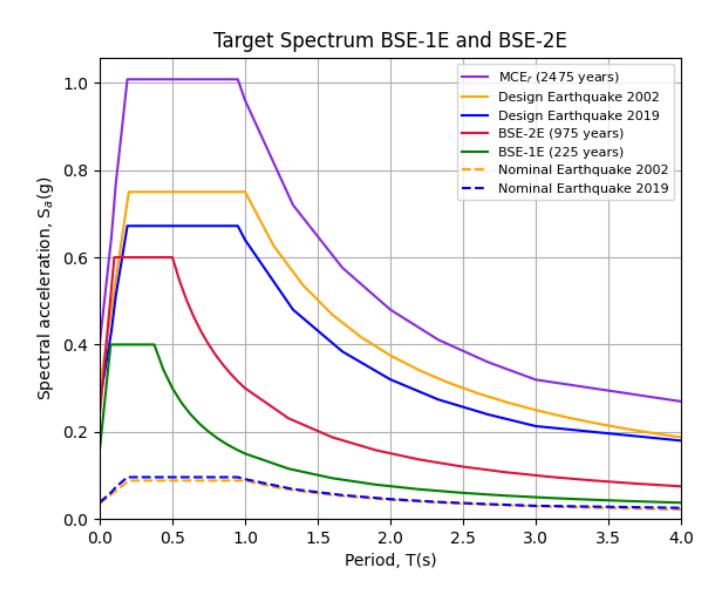
Target spectrum BSE-1E and BSE-2E compared with other target spectrums.
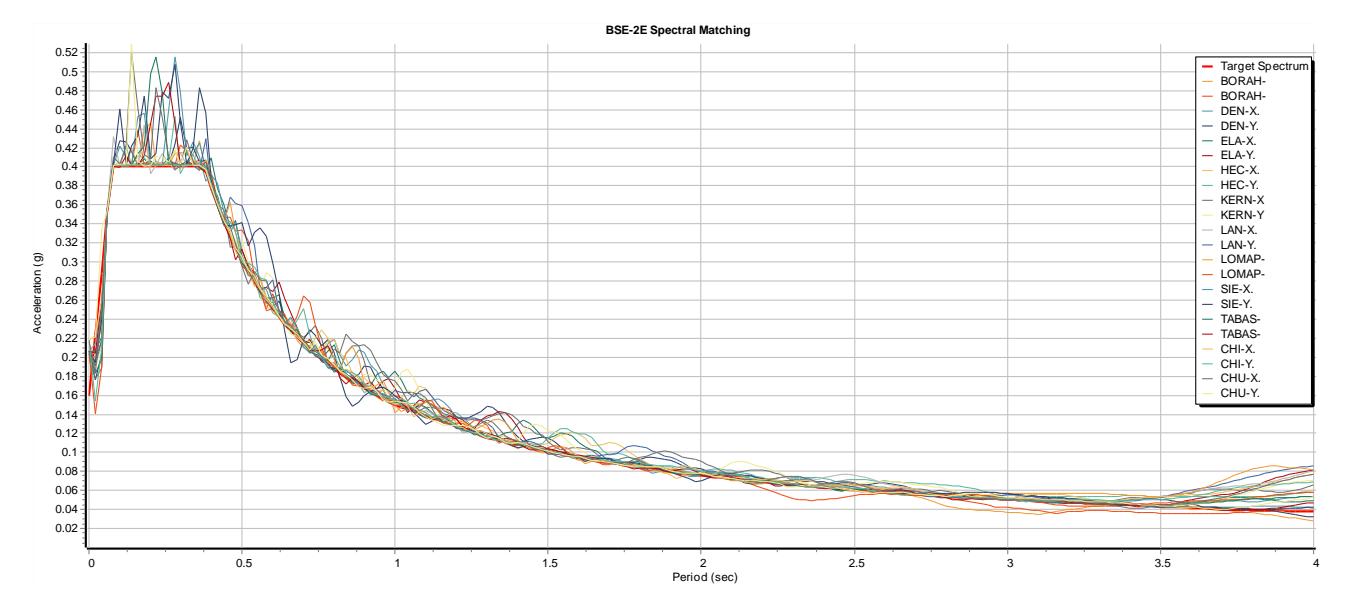
Conversely, non-linear time history analysis necessitates the use of time history records. In this study, real earthquake time histories were chosen, as they offer a more realistic representation and are readily accessible [11]. These selected time histories must then be adjusted to align with the target spectrums. Typically, two prevalent methods are employed for this purpose: spectral matching and amplitude scaling. This research used the spectral matching method, as preceding investigations have shown that spectral matching gives a more realistic result [12].
Within the framework of non-linear time history analysis, the target spectrums chosen were BSE-1E and BSE-2E. Based on Indonesia's latest earthquake disaggregation map, sets of magnitude and distance of earthquake sources were compiled [13]. These magnitude-distance pairs, presented in Table 1, guided the selection of eleven sets of ground motions. Thus, eleven pairs of ground motions conforming to the magnitude-distance pairs were selected. These eleven pairs were matched to the target spectrum with spectral matching. A visual representation of this alignment is depicted in Figure 12, showcasing the matching of chosen ground motions to their corresponding target spectrums.
Table 1 Magnitude and distance to earthquake center pairs.
| Mechanism | Magnitude | Distance (km) |
|---|---|---|
| Benioff | 7 - 7.6 | 230 - 200 |
| Shallow Crustal | 5.6 - 7 | 50 - 150 |
| Megathrust | 8.4 - 8.8 | 150 - 250 |
| All sources | 6.8 - 8.4 | 100 - 150 |
Spectral matching with BSE-1E as target spectrum
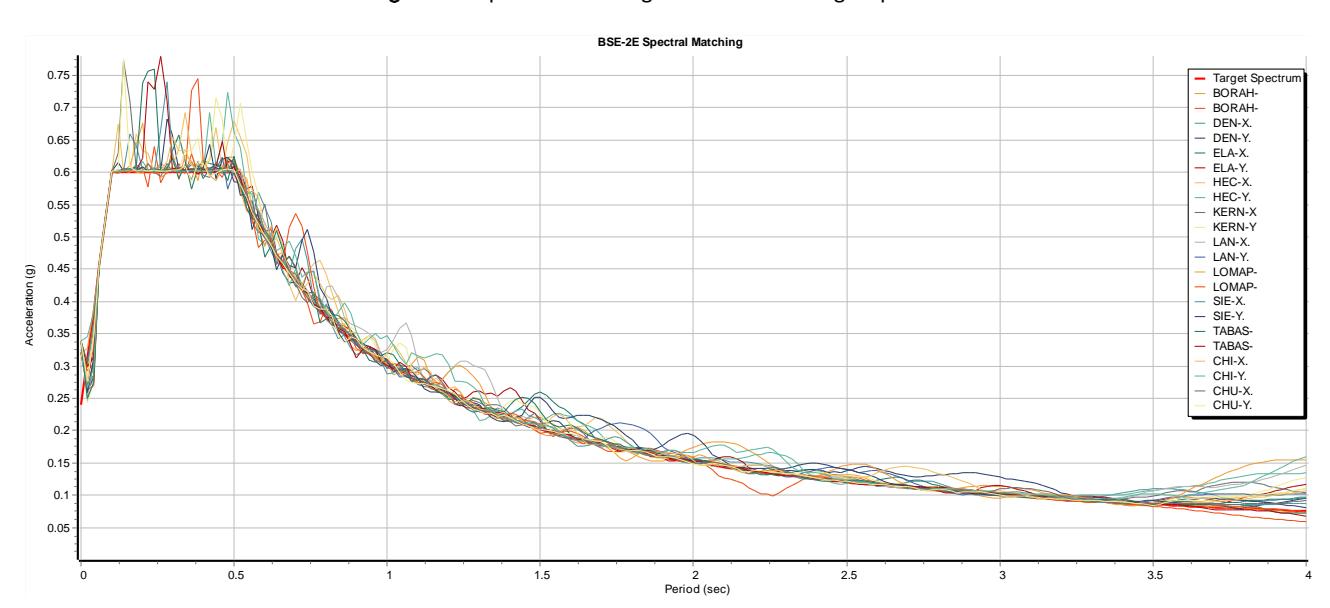
Spectral matching with BSE-2E as target spectrum.
Acceptance Criteria for Seismic Evaluation
The seismic performance evaluation, adhering to ASCE 41-17, is based on the load-to-capacity ratio for all structural elements resisting earthquake forces. Existing structures must undergo evaluation based on two performance goals. The structure evaluated has risk category I with Life Safety Structural Performance for BSE-1E and Collapse Prevention Structural Performance for BSE-2E as the performance goals. The assessment of the structure necessitates employing the systematic Tier 3 procedure outlined in ASCE 41-17. Given the structure's multi-story nature, more straightforward analyses like Tier 1 and Tier 2 are not feasible for evaluation.
Acceptance criteria are categorized into two distinct groups, targeting different structural elements: deformationcontrolled and force-controlled elements. Deformation-controlled elements encompass elements whose acceptance criteria hinge on their deformations, predominantly revolving around rotation. In contrast, acceptance criteria for forcecontrolled elements center around ensuring that the actual applied force remains within the predetermined capacity limit. Force capacities can typically be evaluated with shear hinges in the model; however, in this study such forcecontrolled behaviors were checked independently outside of the computer model to streamline the analysis time. Deformation capacities, on the other hand, undergo inspection through pushover and non-linear time history analyses, collectively providing a comprehensive assessment.
Pushover Analysis
The adopted static non-linear procedure is a pushover analysis with the control point at the highest floor of the model. The lateral force distribution follows an inverted triangular shape, which effectively reflects the significant lateral forces on a forty-story rectangular structure during seismic events, where inertia and height are critical. This method allows for a thorough evaluation of the structure's capacity to resist lateral forces, providing insight into its seismic performance and ensuring compliance with relevant safety codes.
Figure 14 illustrates the pushover curves employing BSE-1E as the demand spectrum, while Figure 15 showcases the pushover curves with BSE-2E as the demand spectrum. In both figures, the left side demonstrates pushover in the xdirection, while the right side portrays pushover in the y-direction. An intriguing observation emerged from the pushover results: certain beams do not meet the Collapse Prevention acceptance criteria, which was particularly evident when evaluating with BSE-2E as the demand spectrum. It is reasoned that the beams failing is caused by a sudden change of stiffness in the structure. Specifically, the beams in question are situated within floors characterized by dimensional changes in the surrounding columns, occurring between story 6 and story 10 (at a height of 21 to 35 meters), as well as between story 12 and story 18 (at a height of 42 to 63 meters). To provide visual clarity, Figure 16 offers an illustrative representation.
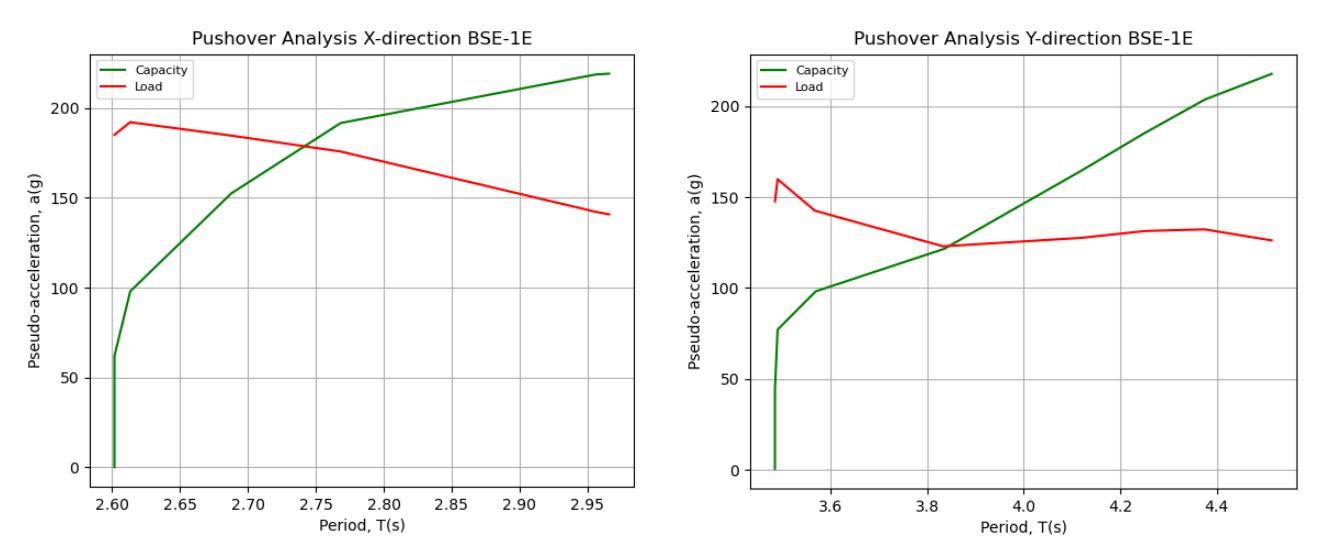
Pushover analysis with BSE-1E as the demand spectrum.
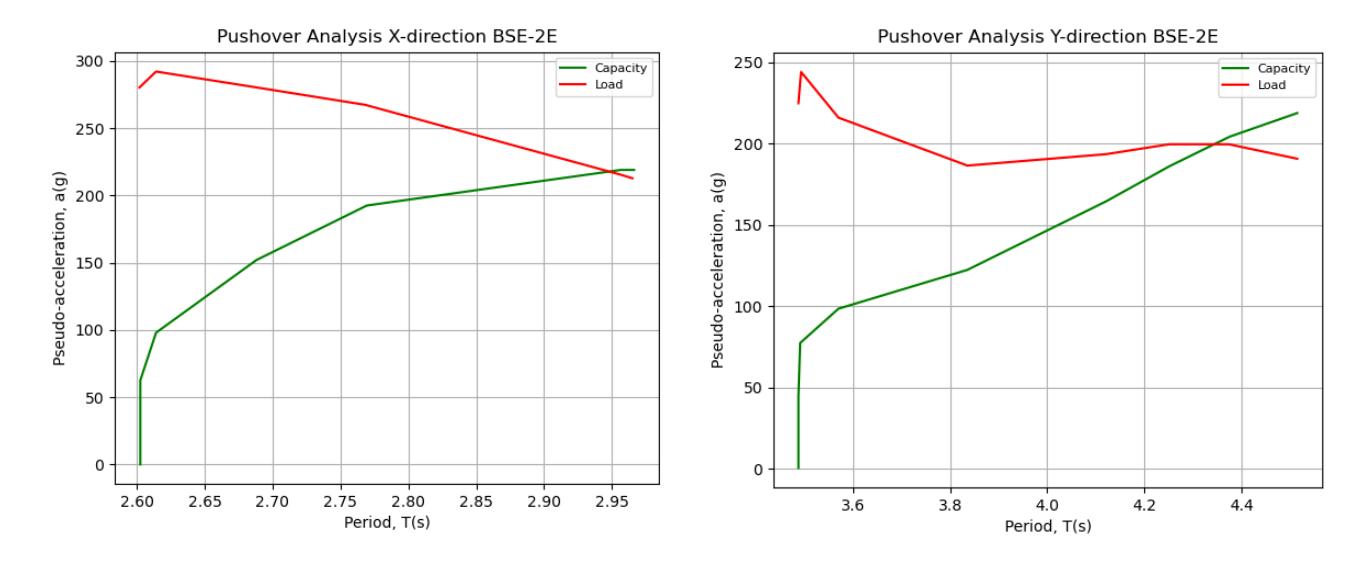
Pushover analysis with BSE-2E as the demand spectrum.
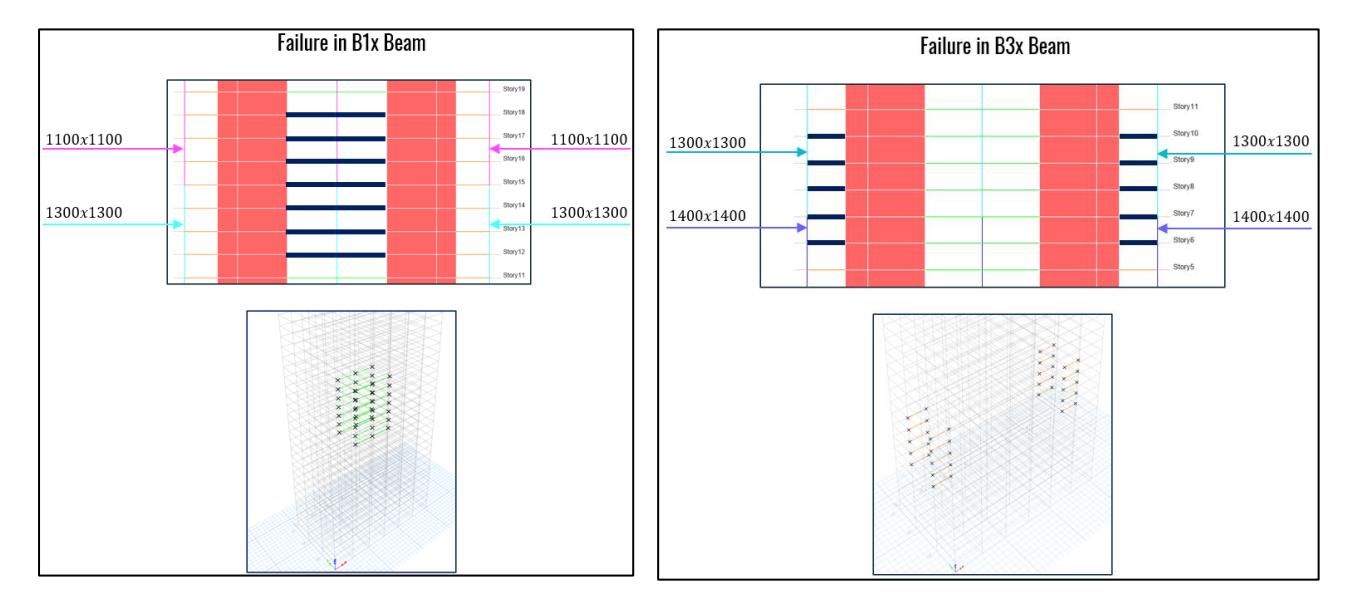
Beams not fulfilling the acceptance criteria.
Non-Linear Time History Analysis
The non-linear time history analysis did not agree with the pushover analysis result. It was discovered that the open frames in the structure do not undergo severe performance deterioration. The results are shown in terms of the ratio of the deformation to the corresponding acceptance criteria deformation.
BSE-1E Ground Motions
The objective for BSE-1E ground motions is to ensure Life Safety. An examination of the results revealed that both beams (Figure 18) and columns, as well as shear walls (Figure 20), meet the acceptance criteria. None of the ground motions induce deformations in the structure surpass the Life Safety deformation limit. Remarkably, the least non-linear behavior is found in the negative action of beams.
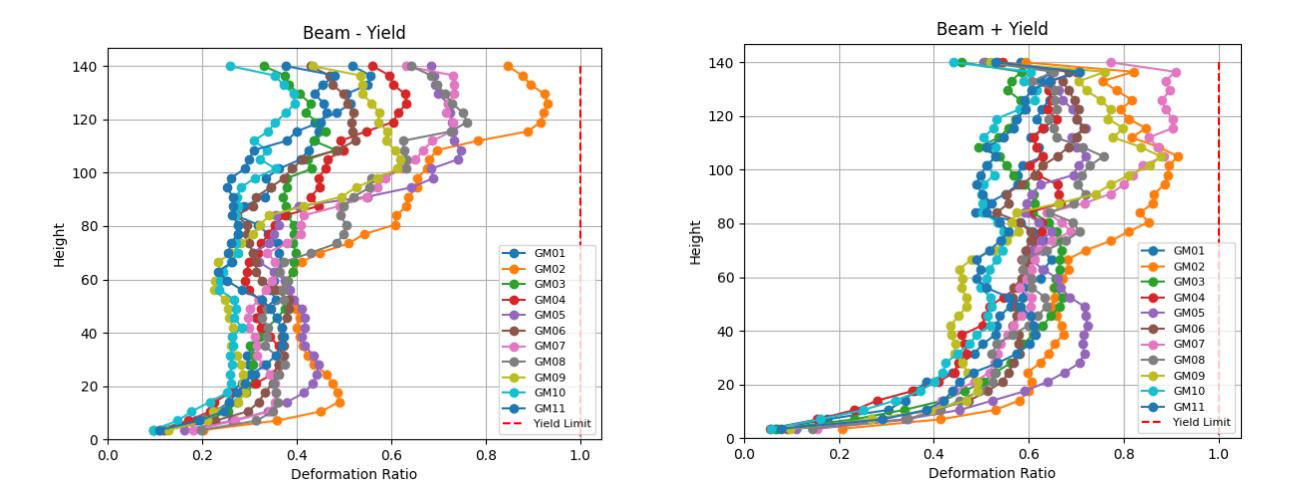
Maximum deformation ratio against yielding with BSE-1E ground motion, negative action of beam (left) and positive action of beam (right).
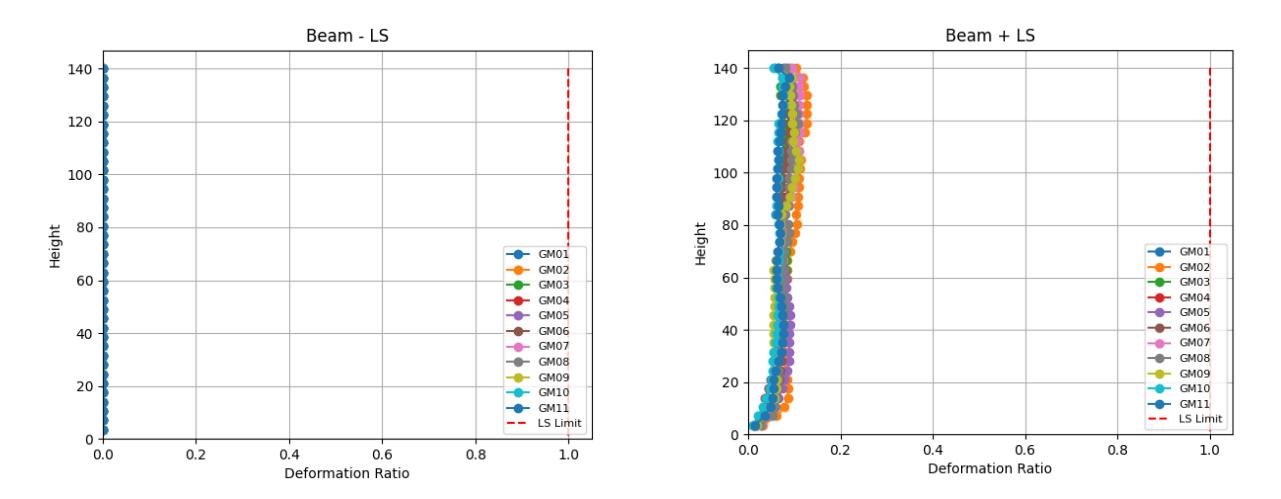
Maximum deformation ratio against Life Safety with BSE-1E ground motion, negative action of beam (left) and positive action of beam (right).
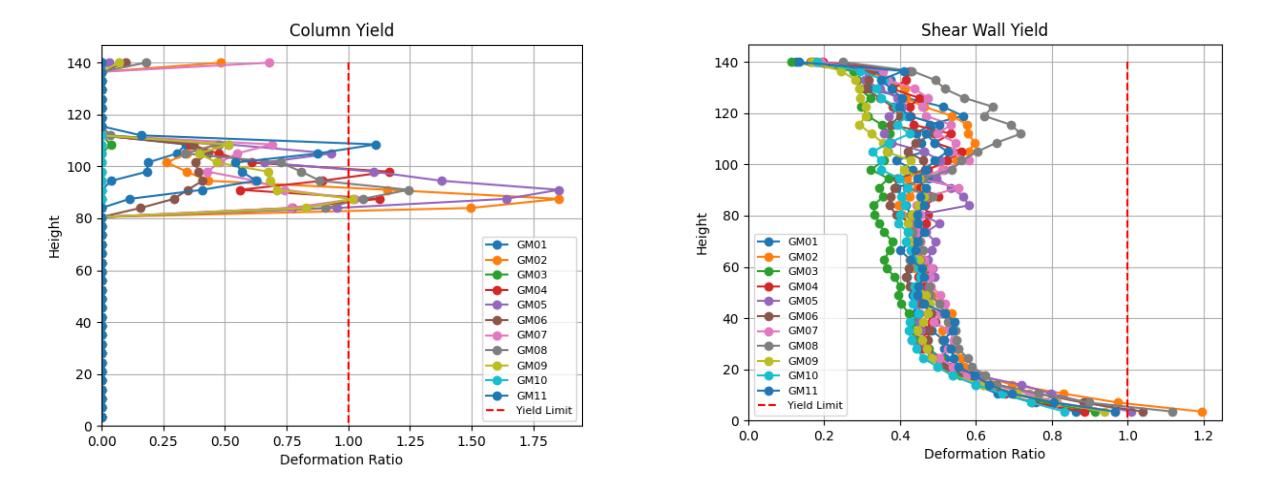
Maximum deformation ratio against yielding with BSE-1E ground motion, column (left) and shear wall (right).
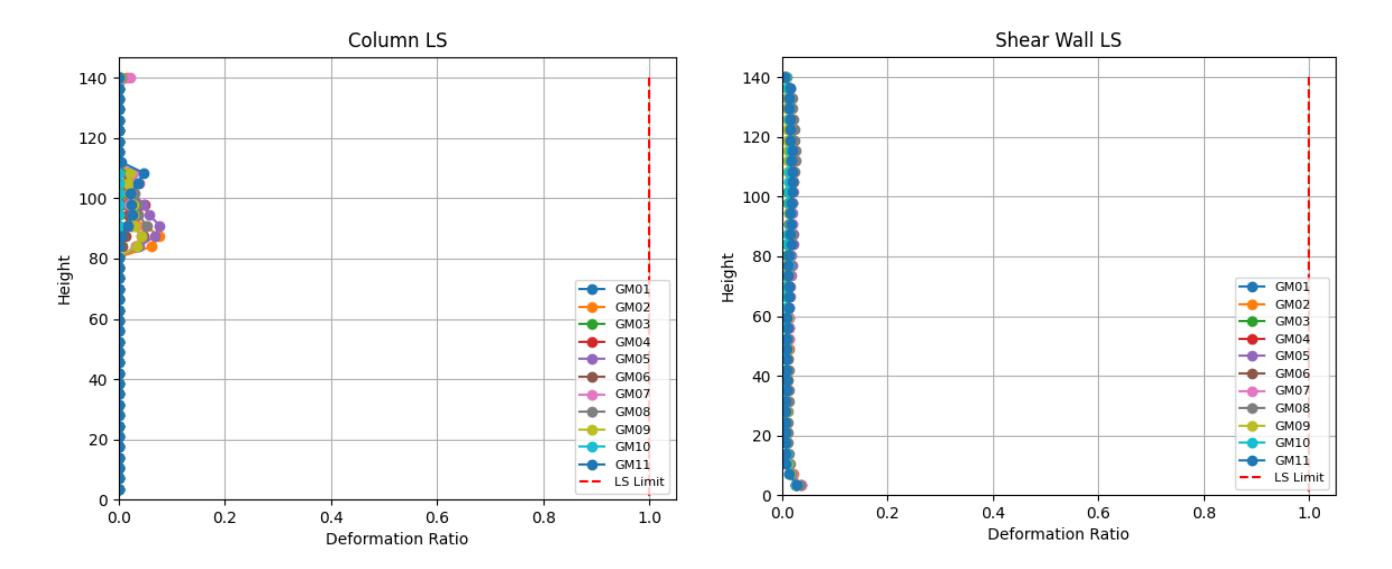
Maximum deformation ratio against Life Safety with BSE-1E ground motion, column (left) and shear wall (right).
BSE-2E Ground Motions
Shifting focus to BSE-2E ground motions, the aim is to achieve Collapse Prevention. A close analysis demonstrated that beams (Figure 22), columns, and shear walls (Figure 24) all satisfy the acceptance criteria. In contrast to the outcomes for BSE-1E ground motions, ground motion 02 leads to columns approaching 60% of the deformation limit abruptly at a height of 60 m. Despite this, it is worth noting that the negative action of beams still exhibits the least non-linear behavior. Importantly, no ground motions result in deformations exceeding the Collapse Prevention deformation limit for the structure.
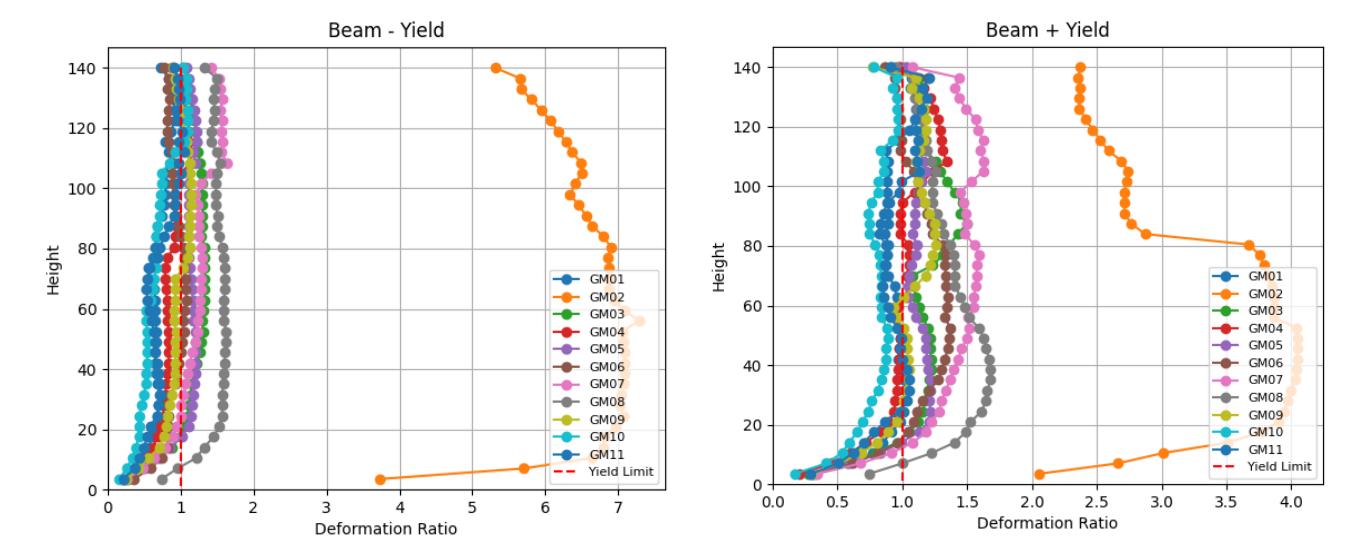
Maximum deformation ratio against yielding with BSE-2E ground motion, negative action of beam (left) and positive action of beam (right).
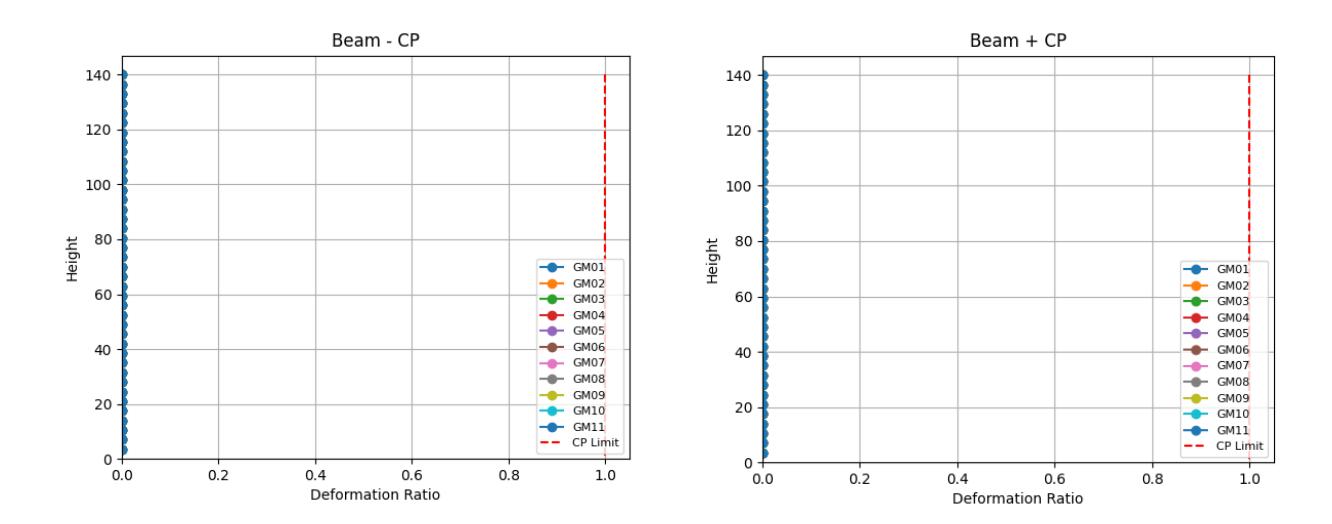
Maximum deformation ratio against Collapse Prevention with BSE-2E ground motion, negative action of beam (left) and positive action of beam (right).
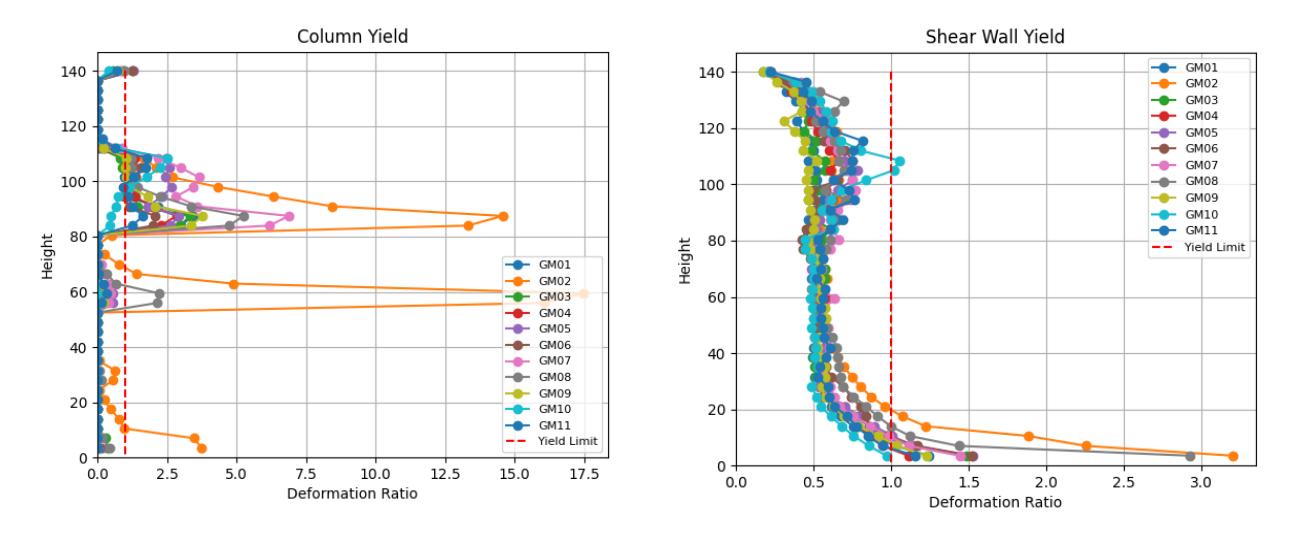
Maximum deformation ratio against yielding with BSE-2E ground motion, column (left) and shear wall (right).
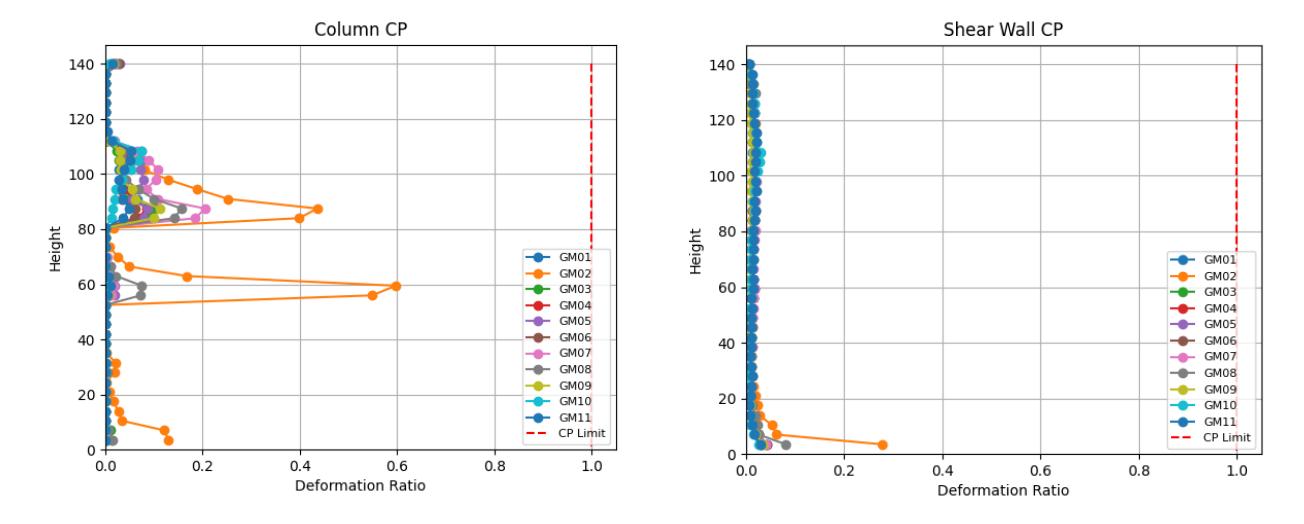
Maximum deformation ratio against Collapse Prevention with BSE-2E ground motion, column (left) and shear wall (right).
Discussions
This study used pushover and non-linear time history analysis, two types of non-linear analysis techniques, to evaluate a high-rise building that was initially designed in accordance with the 2002 versions of SNI 2847 and SNI 1726. The pushover analysis revealed that the beams located between stories 6 to 10 and 12 to 18 do not meet the Collapse Prevention (CP) criteria under the BSE-2E earthquake load. However, the non-linear time history analysis, which used ground motions spectrally matched to the BSE-2E response spectrum, showed that all structural components remain within the Collapse Prevention criteria, though a column at approximately 60 meters (around story 17) comes close to this threshold.
The differences between these two methods can be attributed to the constraints of pushover analysis, which largely captures first-mode effects and uses a simpler loading pattern. This is consistent with earlier studies, such as those by Fajfar (2000) [14] and Chopra and Goel (2004) [15], which highlight the potential limitations of pushover analysis in systems where higher-mode effects are important.
These results suggest that while pushover analysis can serve as a preliminary tool, it may not always be reliable for evaluating structures designed to older codes, particularly when checked against updated performance standards. This highlights the importance of using more detailed dynamic analyses, especially for high-rise buildings that may be sensitive to higher-mode effects and other dynamic interactions.
The potential of multi-mode pushover analysis to increase the precision of static analysis techniques should be investigated in future studies. The disparities between static and dynamic studies might be reconciled by including higher modes, especially for high-rise structures that are sensitive to higher-mode impacts but show few irregularities.
Conclusion
The purpose of this study was to determine if a typical high-rise building built in accordance with the 2002 versions of SNI 2847 and SNI 1726 complies with the updated 2019 performance standards by utilizing pushover analysis and nonlinear time history analysis. The findings demonstrated that while the pushover analysis indicated potential failures in beams across stories 6 to 10 and stories 12 to 18 under the BSE-2E demand spectrum, the non-linear time history analysis showed that all structural elements met the Collapse Prevention (CP) criteria, although with some critical points observed at higher stories.
Significant differences between the two analytic techniques were found in the study, indicating that although the static pushover strategy is frequently employed in practice, it may not always yield accurate results for structures with highermode effects. By including dynamic sequences and ground motion effects, the non-linear time history analysis provided a more thorough evaluation of structural performance.
By showing the limitations of pushover analysis when comparing structures built to older codes to new criteria, these findings advance the discipline. This study recommends that more sophisticated analysis techniques, including multimode pushover analysis or non-linear time history analysis, should be taken into consideration for precise seismic performance evaluation, especially for high-rise buildings. This study confirms the necessity of reviewing design procedures to make sure structures meet contemporary performance-based standards, especially in areas with high seismic risk.
Future research should focus on developing enhanced pushover analysis techniques that incorporate higher-mode effects. This can contribute to the refinement of existing models and design practices, ultimately leading to safer, more resilient structures. By proposing more comprehensive assessment methods, this research paves the way for improved structural analysis models that bridge the gap between simplified static approaches and complex dynamic analyses.
Compliance with ethics guidelines
The authors declare that they have no conflict of interest or financial conflicts to disclose.
This article does not contain any studies with human or animal subjects performed by any of the authors.