
Introduction
Structures are designed to safely withstand various types of loads they may encounter over a specified lifetime. During this period, it is necessary to anticipate and mitigate the risks of structural failure. One form of failure that may occur in structures, particularly in steel structures, is fatigue failure. Fisher et al.[1] define fatigue as the process of initiation and growth of cracks under the action of repetitive loads. Fatigue is regarded as the primary cause of failure in steel structures, as Kuhn et al.[2] stated that fatigue ranks third in the frequency of cause of all recorded damages in steel structures and first among bridge structures, at 38.3%. The American Society of Civil Engineers (ASCE) Committee on Fatigue and Fracture Reliability [3] states that about 80% to 90% of failures in steel structures are related to fatigue and fracture.
The purpose of this study was to conduct a fatigue evaluation of Rumpiang Bridge. The bridge spans the Barito River and is located on a national road in Barito Kuala Regency, South Kalimantan. The bridge has been in operation since 2008 and consists of three spans, with the main span featuring a 200-meter-long steel truss arch structure. According to the structural design regulation in Indonesia [4], the bridge falls under the category of long-span or special bridges with a design life of 100 years. Considering the remaining service life of the bridge and its location within a developing area with high potential for traffic growth in terms of both load and volume, it is crucial to address the fatigue aspect of the bridge. This is in line with the assertion made by Leander [5] that one of the circumstances warranting a fatigue life assessment is an increase in traffic load.
Fatigue assessment relies on two main parameters: stress ranges and the number of load cycles. A stress range is defined as the difference between the maximum and minimum stresses experienced during a load cycle, which in the context of bridge structures is induced by the passages of vehicles. Fatigue design in most codes, including SNI 1725:2016 [6] and AASHTO LRFD Bridge Design Specification 2020 [7], is generally based on a stress range value generated by a design
truck, often referred to as a fatigue truck. A 50-ton fatigue truck in SNI and an HL-93 truck in AASHTO represent the variety of trucks of different types and weights in actual traffic. Both trucks take the form of a three-axle truck with a constant spacing of 5 meters and 30 feet, respectively, between their second and third axles. The three-axle fatigue truck represents 4-axle and 5-axle semi-trailer trucks (the second axle of the fatigue truck represents the rear axle of a tractor truck and the third axle of the fatigue truck represents the trailer axle), which are responsible for most of the fatigue damage to bridges, as stated by Moses et al.[8].
However, traffic characteristics can vary significantly in different locations. According to a study conducted by Bowman et al. [9], the use of a fatigue truck in the analysis may lead to an overestimation or an underestimation of the loading effect under actual conditions. Therefore, it is recommended to utilize weight-in-motion (WIM) data collected at or near the bridge site to estimate the fatigue load effect. Iatsko et al. [10] state that WIM data provide an excellent opportunity to study the effects of actual traffic loads on bridges, as they gather information about vehicle types, loads, and axle configurations of vehicles passing over the bridge, which can be used to perform more accurate fatigue damage calculation on the bridge. The American Association of State Highway and Transportation Officials Manual for Bridge Evaluation (AASHTO MBE) 2018 [11], which provides procedures for bridge assessment, also emphasizes the use of WIM data to estimate stress ranges for fatigue analysis of bridge.
Methodology
Data
Structural modeling of the Rumpiang Bridge was conducted using the MIDAS Civil 2022 software based on the as-built drawing obtained from the National Road Implementation Agency for South Kalimantan Region. Since the WIM data at the bridge site was unavailable, an alternative data source was utilized for simulating traffic loads. The chosen alternative was the WIM station on Prof. Dr. Ir. Sutami Road in Lebak Regency, Banten which exhibits traffic characteristics similar to those of the bridge location, particularly in terms of traffic volume and vehicle speed. The WIM data was collected over a seven-day period, commencing from December 12th, 2022 to December 18th, 2022, through the website https://indonesia.siwim.com.
The year 2022 was used as the starting year for calculating the remaining fatigue life, as the WIM data collected during that year was utilized. For traffic projection purposes, the growth rate was determined through statistical analysis of vehicle data in South Kalimantan from the years 2008 to 2017, sourced from the Central Bureau of Statistics. The projection of future traffic, in terms of the number of load cycles parameter, until the end of the bridge's service life was computed using non-linear regression, similar to the approach employed by Fu et al. [19] for predicting the growth of traffic flow. This approach is based on the assumption that current and past conditions can be used to make predictions about the future. It was also used to estimate the number of load cycles that occurred from the start of operation in 2008 up to the present day.
Traffic Load Simulation & Stress Analysis
The traffic loads applied to the bridge, whether in the form of single vehicles or groups of vehicles, were determined based on the headway, calculated from the time stamp and vehicle speed parameters recorded in the WIM data. This headway was calculated to consider the multi-presence effect. Vehicles passing on the bridge simultaneously were regarded as a single load cycle, as illustrated in Figure 1.
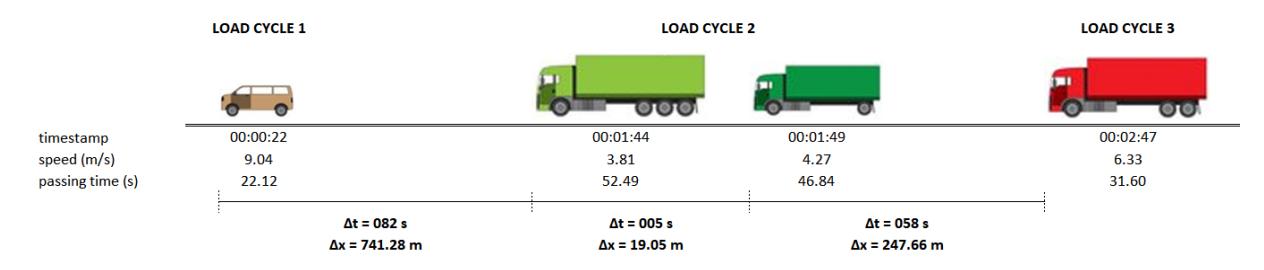
Determination of vehicle sequence in load cycles.
The axle loads and spacing between axles, both within a single vehicle and between vehicles in a load cycle, were input into the structural modeling in MIDAS as moving loads. Stress analysis was conducted using the nominal stress approach, defined by Russo et al. [20] as the uniform stress away from the attachment and can be calculated using simple principles of the strength of materials. The stress range parameter was determined based on the maximum stress range value from the stress history generated by each load cycle, disregarding any secondary stress ranges, as illustrated in Figure 2.
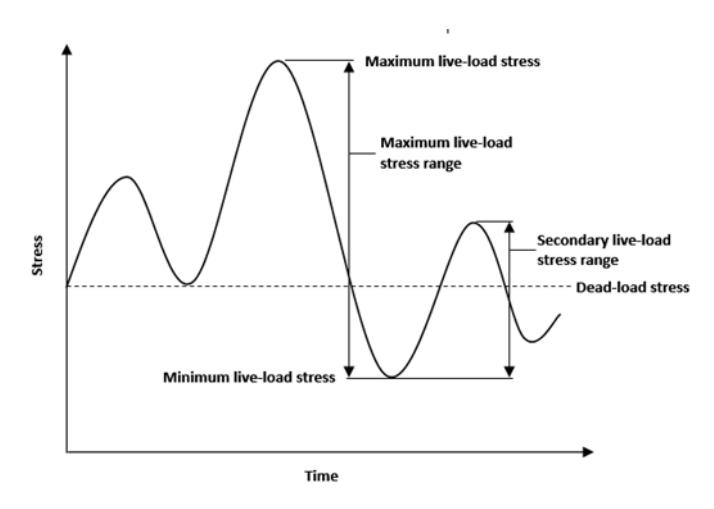
Typical stress history on a bridge element.
This approach for determining load cycles and the resulting stress range values, referred to as the peak cycle counting by Aghoury [21], was employed due to its simplicity as compared to other approaches, such as the more complex rainflow cycle counting created by Downing and Socie [22]. The stress range value used for fatigue calculation was computed based on the tensile portion of the maximum stress range. Subsequently, the effective stress range value that represents all load cycles was calculated using Eq. (1):
\[\Delta f_{eff} = \left(\sum \gamma_i \Delta f_i^3\right)^{\frac{1}{3}} \tag{1}\]
Fatigue Evaluation
The fatigue evaluation in this study was performed using the common stress-life method, which represents a relationship between the constant amplitude stress range and number of cycles to fatigue failure in the form of an S-N curve [23]. The evaluation was conducted by comparing three different approaches, referencing the AASHTO MBE 2018 [11] provisions, the RSNI T-03-2005 [4] provisions and using the cumulative fatigue damage method, respectively.
In fatigue evaluation, the stress range limit is determined by considering the level of traffic represented by the number of cycles, defined as fatigue resistance. Fatigue resistance is the maximum stress range that can be sustained without failure of the detail for a specified number of cycles [7]. Therefore, the safety factor of fatigue calculation is the ratio of the fatigue resistance established based on the detail category to the stress range generated by the load.
In accordance with AASHTO MBE 2018 [11], the calculation of the remaining fatigue life was simplified and carried out using Eq. (2):
\[Y = \frac{\log \left[\frac{R_R A}{365n[ADTT_{SL}]_{PRESENT}[\Delta f_{eff}]^3}g(1+g)^{a-1}+1\right]}{\log(1+g)}\](2)
The calculation of fatigue life using the RSNI T-03-2005 [4] was performed by plotting the effective stress range values on the S-N curve shown in Figure 3. The obtained number of load cycles causing failure from this S-N curve was then compared with the cumulative projected number of load cycles to determine the remaining fatigue life of the bridge.
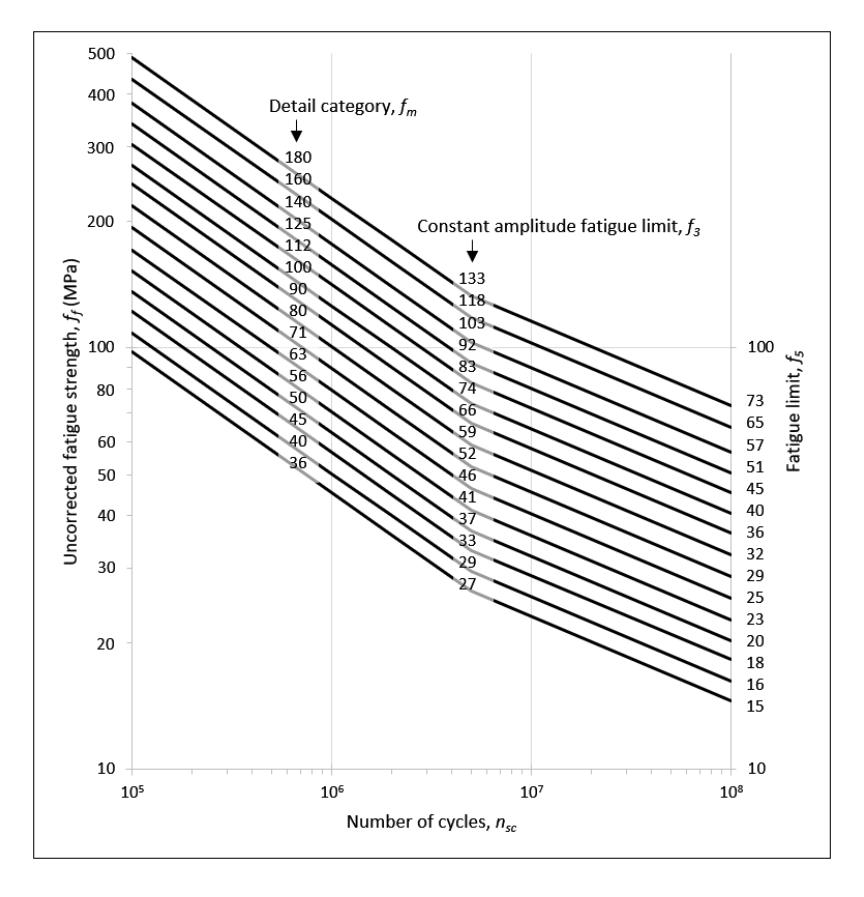
S-N curve in RSNI T-03-2005.
The cumulative fatigue damage method was developed based on Miner's linear damage rule [24], which assumes that the damage fraction caused by a particular stress range level is a linear function of the number of cycles that occurs at that stress range, as written in Eq. (3). Fatigue life is achieved when the total damage reaches a value of 1.
\[\sum \frac{n_i}{N_i} = 1 \tag{3}\]
Result and Discussion
Over the seven-day period of WIM data a total of 13,338 vehicles were recorded. To consider the multiple-present effect, the vehicles in the WIM data were arranged into vehicle sequences based on the headway, as illustrated in Figure 1, resulting in a total of 5,937 load cycles as shown in Table 1. Vehicle classification based on the regulation of the Indonesia Directorate General of Highway is presented in Table 2.
Table 1 Vehicle statistics from WIM data and count of load cycles.
| Vehicle class | Number of | Number of | |||||||||||
|---|---|---|---|---|---|---|---|---|---|---|---|---|---|
| Day | 2 | 3 | 4 | 5a 5b 6a | 6b | 7a | 7b | 7c | vehicles | Load cycles | |||
| 1 | 186 | 23 | 387 | 0 105 0 | 793 | 393 | 137 49 | 2,073 | 919 | ||||
| 2 | 95 | 19 | 326 | 0 | 93 | 0 | 676 | 311 | 154 62 | 1,736 | 777 | ||
| 3 | 129 | 23 | 380 | 0 | 93 | 0 | 761 | 354 | 154 61 | 1,955 | 912 | ||
| 4 | 177 | 12 | 406 | 0 109 0 | 788 | 405 | 115 54 | 2,066 | 900 | ||||
| 5 | 135 | 18 | 334 | 0 | 95 | 0 | 734 | 400 | 143 74 | 1,933 | 832 | ||
| 6 | 157 | 8 | 377 | 0 111 0 | 699 | 309 | 146 73 | 1,880 | 817 | ||||
| 7 | 209 | 15 | 296 | 0 | 94 | 0 | 510 | 379 | 119 73 | 1,695 | 780 | ||
| Total 1,088 118 2,506 0 700 0 4,961 2,551 968 446 | 13,338 | 5,937 | |||||||||||
| Table 2 Vehicle classification. |
|---|
| Vehicle class | Definition |
|---|---|
| 2 | Passenger cars |
| 3 | Minibuses and minivans |
| 4 | Pick-up trucks and vans |
| 5a | Small buses |
| 5b | Large buses |
| 6a | 2-axle 4-tire trucks |
| 6b | 2-axle 6-tire trucks |
| 7a | 3-axle trucks |
| 7b | Trailer trucks |
| 7c | Semi-trailer trucks |
Vehicle statistics for South Kalimantan from 2008 to 2017, as shown in Table 3, were used to establish an exponential regression model. Using the regression function, as shown in Figure 4, a traffic growth rate of 10.06% was determined.
Table 3 Vehicle statistics for determining the growth rate (source: Central Bureau of Statistics).
| Year Passenger cars | Buses | Cargo vehicles Motorcycles | Total number of vehicles | ||
|---|---|---|---|---|---|
| 2008 | 131,161 | 82,704 | 144,858 | 905,412 | 1,264,135 |
| 2009 | 148,449 | 88,226 | 145,924 | 1,009,358 | 1,391,957 |
| 2010 | 155,611 | 91,620 | 151,550 | 1,143,986 | 1,542,767 |
| 2011 | 165,445 | 91,789 | 160,342 | 1,293,943 | 1,711,519 |
| 2012 | 181,179 | 92,055 | 171,274 | 1,476,514 | 1,921,022 |
| 2013 | 192,953 | 92,275 | 182,379 | 1,675,773 | 2,143,380 |
| 2014 | 199,383 | 121,249 | 234,321 | 1,880,110 | 2,435,063 |
| 2015 | 215,154 | 121,601 | 236,664 | 1,906,056 | 2,479,475 |
| 2016 | 249,889 | 137,980 | 265,448 | 2,049,005 | 2,702,322 |
| 2017 | 278,994 | 138,268 | 280,868 | 2,256,937 | 2,955,067 |
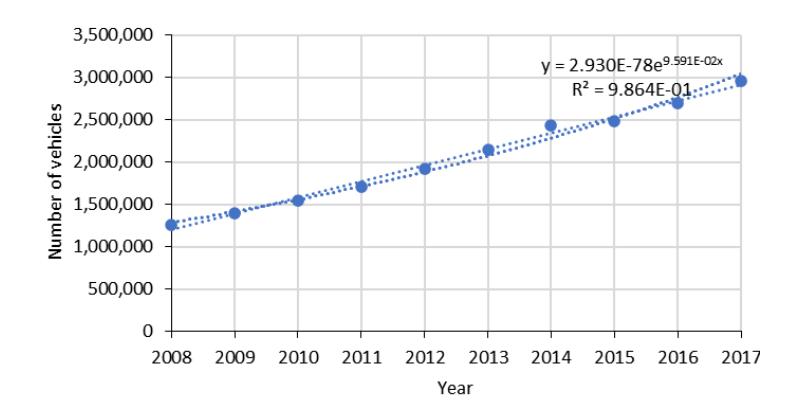
Non-linear regression of vehicle data.
The total number of load cycles for the existing year, 2022, was calculated by multiplying the seven-day period load cycles from the WIM data by 52 weeks, resulting in 308,724 load cycles. The 10.06% growth rate was applied to estimate the number of load cycles occurred since 2008 and to project future load cycles. The number of load cycles for 2022 acted as the reference point for this projection.
It is unrealistic to project traffic growth indefinitely into the future, because traffic volume tends to be self-limiting [8]. In this study, the upper limit of this projection was determined by two parameters: the maximum traffic volume and the maximum number of load cycles.
- 1. According to the WIM data, the average daily traffic volume for the year 2022 was 1,908 vehicles per day. AASHTO LRFD 2020 [7] limits the average daily traffic to 20,000 vehicles per lane per day under normal traffic conditions. With a growth rate of 10.06%, this maximum traffic of 20,000 vehicles per day was projected to be reached by the year 2047.
- 2. Assuming that vehicles crossing the bridge simultaneously constitute one load cycle, the maximum number of load cycles can be determined based on the average travel time for a vehicle to cross the bridge. From the WIM data, the average vehicle speed recorded was 7.21 m/s, resulting in a travel time of 27.75 seconds needed to cross the bridge. This travel time serves as the duration of one load cycle, so the maximum number of load cycles was calculated as follows:
maximum load cycles = \[(1 \text{ cycle})/(27.75 \text{ s}) = 3,114 \text{ cycles/day} = 1,136,511 \text{ cycles/year}\] (4)
With a growth rate of 10.06%, this maximum number of 1,136,511 load cycles per year will be reached by the year 2036.
Based on these calculations, it was established that the projection upper limit will be reached by the year 2036. The number of load cycles per year and its cumulative value are shown in Figures 5 and 6, respectively.
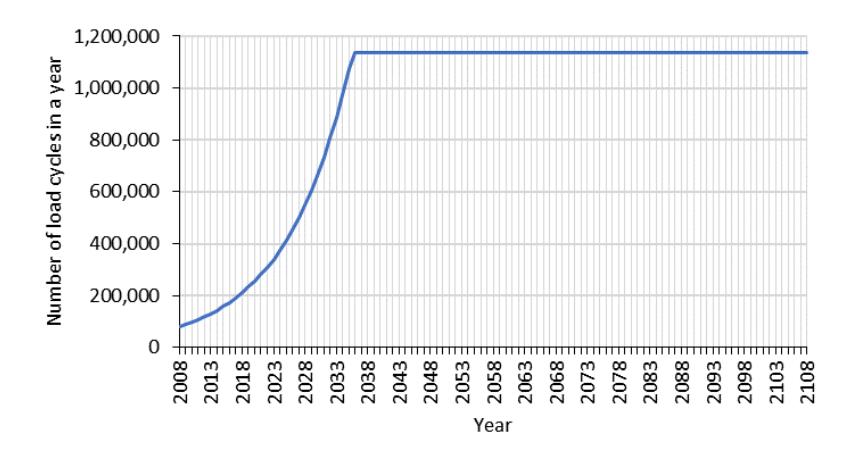
Projected number of load cycles per year.
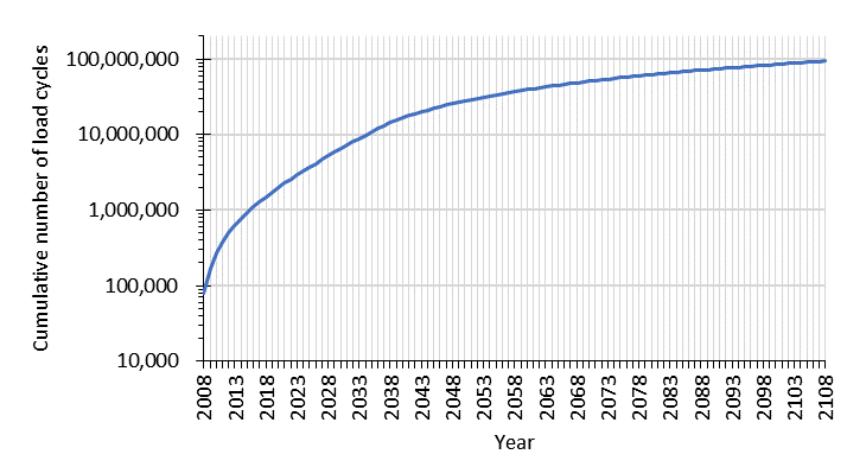
Cumulative number of load cycles projection.
The nominal stresses in all bridge elements resulting from each load cycle, derived from the WIM data, were obtained through structural analysis using the MIDAS Civil software. A summary of the stress values and stress range values in the structural elements with the highest effective stress range values, subsequently referred to as critical elements, for each structural element type is presented in Table 4.
The bridge structural model in MIDAS Civil and the location of critical elements are shown in Figure 7. The arch structure (top chords, bottom chords, verticals, and diagonals), main girders, cross girders, and stringers were modeled as beam
elements with rigid connections between elements. Hangers and wind-bracings were modeled as truss elements. Among all critical elements, the cross-girder element exhibited the highest maximum stress range value of 171.30 MPa and the highest effective stress range value of 75.31 MPa. The stress history of this cross-girder resulting from the load simulation for each day of the seven-day period of WIM data is shown in Figure 8.
| Element | Material | Stress (MPa) | Stress range (MPa) | ||||||||
|---|---|---|---|---|---|---|---|---|---|---|---|
| No | Type | Section | Grade | Fy (MPa) Fu (MPa) | DL | DL+LL Max DL+LL Min | Max | Min Effective | |||
| 208 | Top chord | H 600.614.10.30 | SM490Y | 365 | 490 | 71.60 | 95.20 | 65.30 | 28.10 0.00 | 8.60 | |
| 36 | Bottom chord | H 600.460.10.30 | SM490Y | 365 | 490 | 137.00 | 197.00 | 127.00 | 67.00 0.00 | 25.81 | |
| 88 | Vertical | H 600.260.8.11 | SS400 | 245 | 400 | 26.00 | 123.00 | -45.00 | 123.00 0.30 | 49.27 | |
| 116 | Diagonal | H 600.260.8.11 | SS400 | 245 | 400 | 13.80 | 98.90 | -62.00 | 98.90 0.30 | 38.62 | |
| 352 | Main girder | IWF 1500.590.15.25 SM490Y | 365 | 490 | 28.60 | 57.70 | -36.50 | 57.70 0.20 | 26.30 | ||
| 699 | Cross-girder | IWF 1150.300.12.20 SM490Y | 365 | 490 | 21.00 | 187.00 | 15.60 | 171.30 0.60 | 75.31 | ||
| 791 | Stringer | IWF 496.199.9.14 | A572-50 | 345 | 450 | 30.70 | 52.90 | -1.82 | 45.10 0.10 | 18.93 | |
| 472 | Hanger | Double L 120.120.12 | SS400 | 245 | 400 | 41.47 | 147.10 | 38.40 | 108.41 0.32 | 42.83 | |
| 1074 Bottom wind-bracing | PIPE 168,3.7,11 | A53 | 240 | 415 | 0.54 | 40.39 | -37.62 | 40.39 0.14 | 12.40 | ||
| 2429 | Cross wind-bracing | PIPE 168,3.7,11 | A53 | 240 | 415 | 12.54 | 50.76 | -17.12 | 50.76 0.16 | 22.10 | |
| 2493 | Tie wind-bracing | T 75.150.7.10 | SM490Y | 365 | 490 | 4.06 | 8.24 | -12.76 | 8.24 | 0.06 | 4.26 |
DL stress: stress on the bridge element due to dead load and superimposed dead load (pavement and sidewalk).
DL+LL stress: stress on the bridge element due to dead load, superimposed dead load, and live load.
Bridge structural model and location of critical elements.

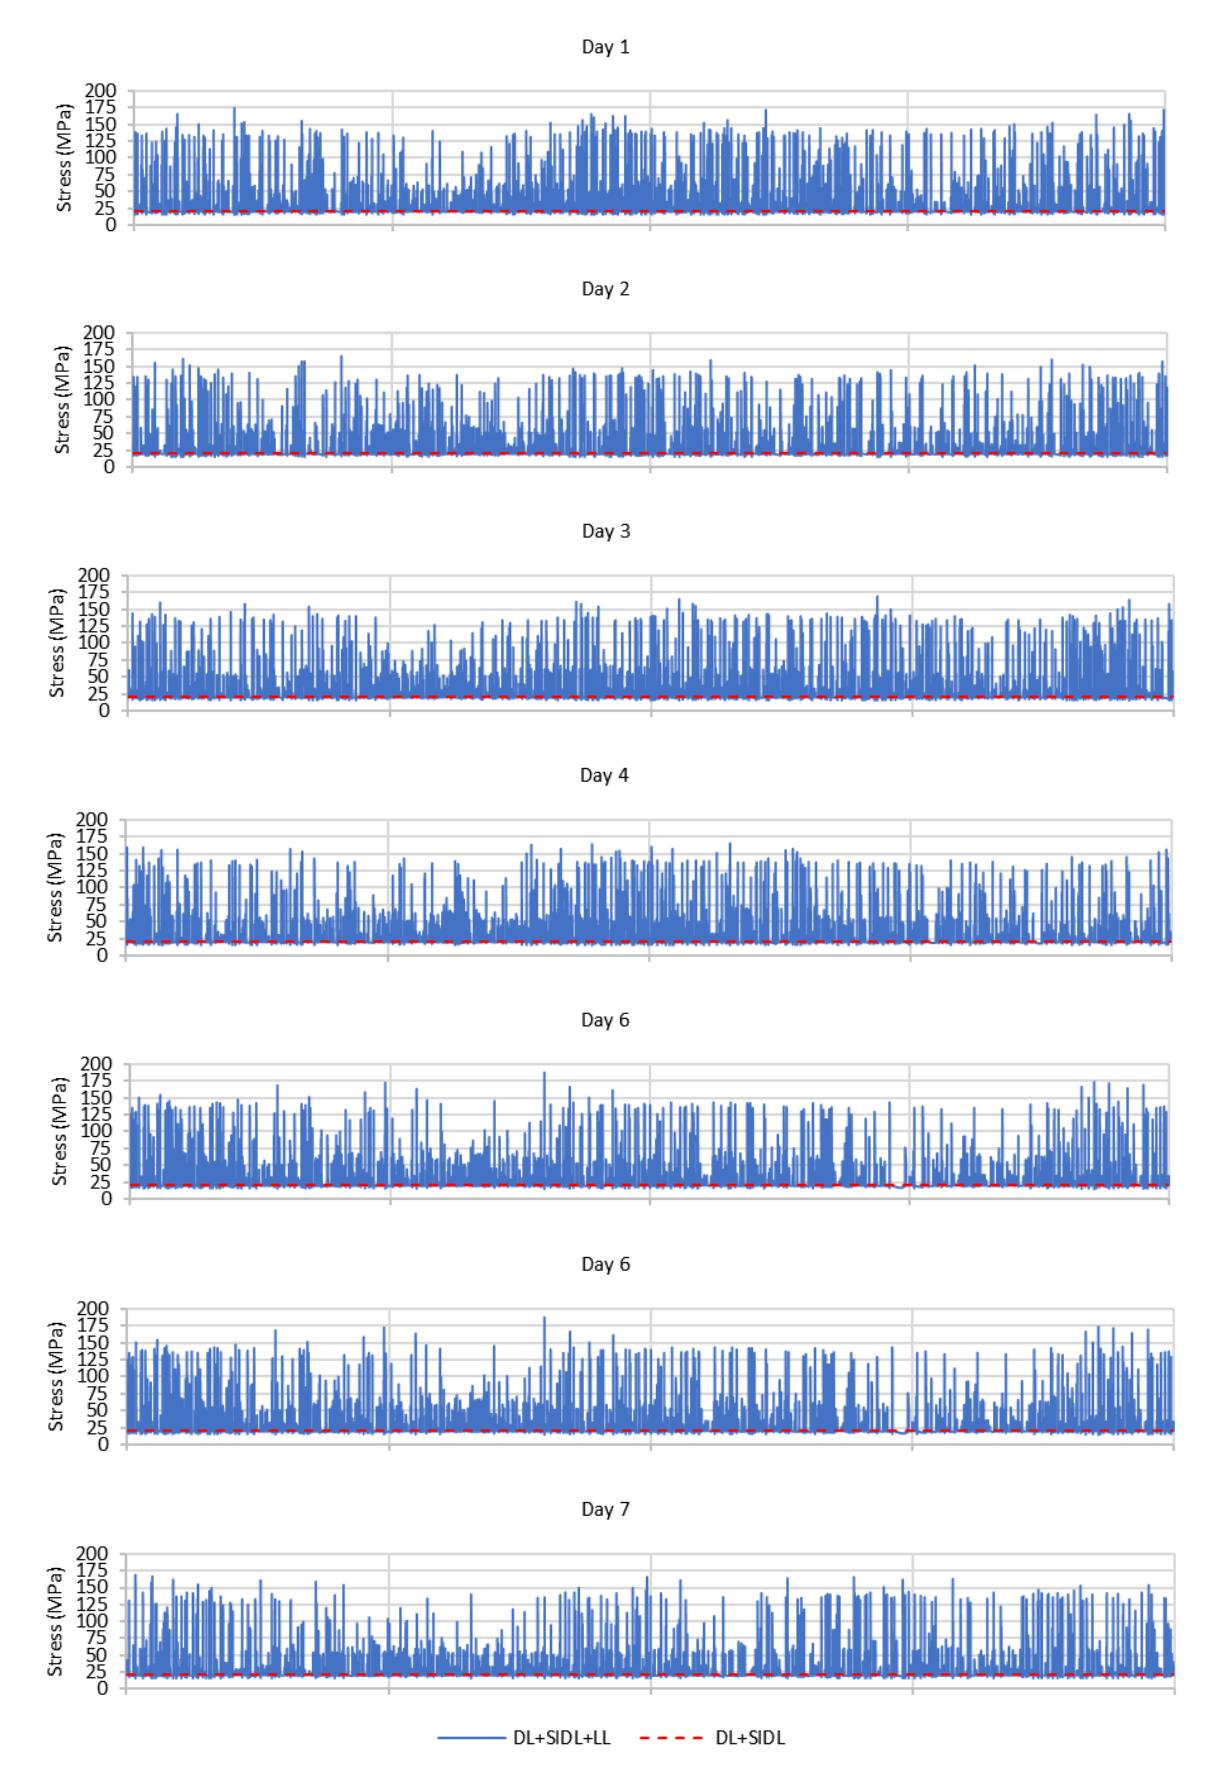
Stress histories of the cross-girder element.
Fatigue evaluation related to shear stresses was not considered in this study, as the stress ranges resulted from the shear stresses in all the bridge elements were lower than the fatigue limit. The maximum stress range value of 171.30 MPa and the effective stress range value of 75.31 MPa on the cross-girder were significantly greater than the stress ranges calculated based on code requirements. A 50-ton design truck in accordance with the SNI 1725:2016 [6] fatigue limit state produced a stress range value of 61.9 MPa, while an HL-93 truck used in the Fatigue I and Fatigue II load combinations of AASHTO LRFD 2020 [7] resulted in stress range values of 94.9 MPa and 43.4 MPa on the cross-girder, respectively. These results indicate that the actual traffic loads represented by the WIM data are significantly heavier than the design truck provisions in both codes, suggesting a more conservative fatigue evaluation.
Fatigue Life of AASHTO MBE 2018
AASHTO MBE 2018 [11] specifies that finite fatigue life calculations only need to be conducted for details with maximum stress ranges exceeding the constant amplitude fatigue threshold (CAFT). This threshold is determined based on the detail category of the assessed element. Detail categories group details or components with the same fatigue resistance. According to Table 6.6.1.2.3-1 of AASHTO LRFD 2020 [7], the bridge elements are generally considered as built-up sections or elements with mechanically fastened joints and fall under detail category B with a threshold value of 110.3 MPa. Except for stringer elements with re-entrant corners as well as bottom and cross wind-bracing elements with complete joint penetration groove welded butt splices, which are classified under detail category C with a threshold value of 68.9 MPa.
The maximum stress range value can be taken as 2.2 (\(\Delta f_{eff}\)) or determined based on the largest value resulting from WIM data loading. Based on the maximum stress range value for critical elements, only the vertical and cross-girder elements have a finite fatigue life. The remaining fatigue life of each element was calculated using Eq. (2). AASHTO MBE 2018 [11] categorizes fatigue life into four levels: the minimum expected fatigue life, evaluation 1 fatigue life, evaluation 2 fatigue life, and mean fatigue life. Each level represents a different probability of occurrence with values of 98%, 84%, 67%, and 50%, respectively. The resistance factor \(R_R\) is determined based on the considered fatigue level. Detail category constants are determined based on the assessed element's detail category. For detail category B, the constant is 39.3 x \(10^{11}\) MPa³, and for detail category C, the constant is \(14.4 \times 10^{11}\) MPa³.
The value of n is determined based on the type of element under consideration. For longitudinal members such as simple span girders or trusses, and transversal members with spacing greater than 20 ft, the value of n is 1. The growth rate was established at 0.1006, while the average number of cycles per day obtained from WIM data, which is 849 cycles per day, was taken as the average daily truck traffic value. The remaining fatigue life of the vertical and cross-girder elements for each fatigue life level are displayed in Table 5. Based on the information provided in Table 5, the bridge's fatigue life is determined by the cross-girder element, which has a remaining fatigue life of 25 years for the minimum fatigue level, suggesting that fatigue failure would occur in the year 2047.
| Element | Fatigue life (years) | |||||||
|---|---|---|---|---|---|---|---|---|
| No | Туре | Minimum fatigue life | Evaluation 1 fatigue life | Evaluation 2 fatigue life | Mean fatigue life | |||
| 88 | Vertical | 38.0 | 40.7 | 43.4 | 45.1 | |||
| 699 | Cross-girder | 25.4 | 27.9 | 30.5 | 32.1 | |||
Table 5 Fatigue life of the bridge elements based on AASHTO MBE 2018 method.
Fatigue Life of RSNI T-03-2005
Fatigue life calculations referencing RSNI T-03-2005 [4] were conducted using the S-N curve presented in Figure 3. The stress range values for each critical element were plotted on the S-N curve to determine the number of cycles causing fatigue failure. The detail categories are grouped based on fatigue resistance at two million cycles and the bridge elements are generally considered as elements with bolted connections and fall into the detail category 140. Only bottom wind-bracing and cross wind-bracing elements fall into a different category, namely detail category 50.
Category detail 140 has a fatigue limit of 57 MPa, while category detail 50 has a fatigue limit of 20 MPa. Based on the provisions, only cross-girder and cross wind-bracing elements have effective stress range values greater than the fatigue limit and need to be evaluated for fatigue. The results of the fatigue life calculations for cross-girder and cross wind-bracing elements are presented in Table 6. Based on the information provided in Table 6, the fatigue life of the bridge is determined by the cross-girder with an effective stress range of 75.31 MPa. Plotting it on the S-N curve showed a 22.10 correlation of fatigue failure at \(2.48 \times 10^7\) cycles, which will be reached by the year 2048 based on the cumulative number of cycles projection in Figure 6, or equivalent to a remaining fatigue life of 26 years.
| Element | Effective stress | Number of cycles | Year of | Remaining fatigue life (years) | ||
|---|---|---|---|---|---|---|
| No | Туре | range (MPa) | causing failure | fatigue failure | ||
| 699 | Cross-girder | 75.31 | 2.48 x 10⁷ | 2048 | 26 | |
Table 6 Fatigue life of the bridge elements based on the RSNI T-03-2005 method.
\(6.07 \times 10^7\)
Fatigue Life of Cumulative Damage Method
Cross wind-bracing
Fatigue life calculations using the cumulative fatigue damage method were carried out on the cross-girder element, which determines the fatigue life of the bridge in the two previous methods. This method cumulates the damage fractions caused by each stress range occurring in each load cycle using Eq. (3). The value of \(n_i\) was determined based on the number of cycles of each stress range interval, while the value of \(N_i\) was determined based on the plot results of the median value of each stress range interval on the S-N curve in Figure 3.
All stress ranges occurring in the cross-girder element are displayed in the histogram shown in Figure 9. Cumulative fatigue calculations were performed for each year using the number of cycles resulting from the projection, where the number of cycles for each interval was determined proportionally to the total number of cycles based on the stress range histogram. The results of the fatigue life calculations indicated that a cumulative fatigue damage value of 1 will be reached in the year 2038, equivalent to a remaining fatigue life of 16 years, and the current cumulative fatigue damage is 0.179. The value of cumulative fatigue damage from year to year for the cross-girder element is presented in Figure 10.
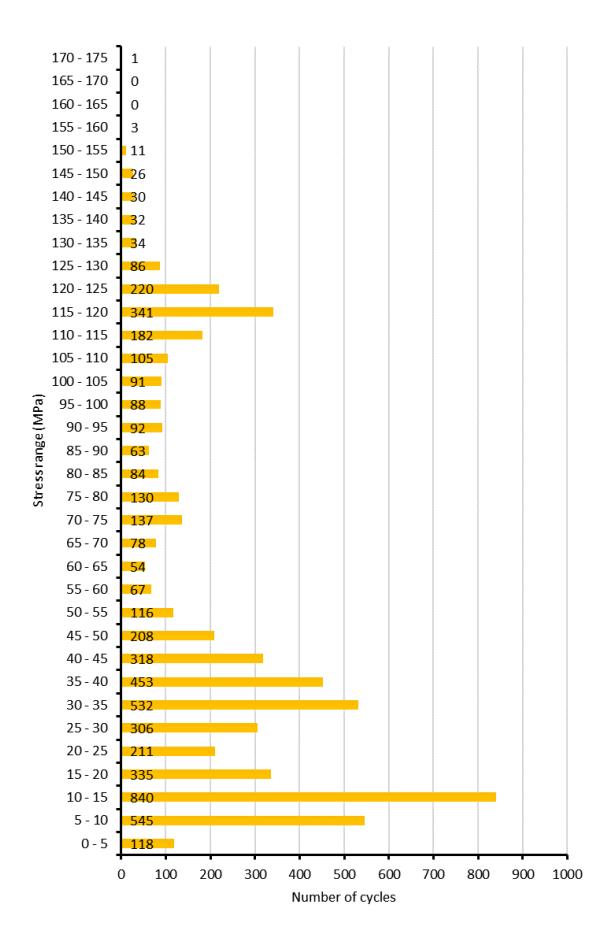
Figure 9 Stress range histogram of the cross-girder element.
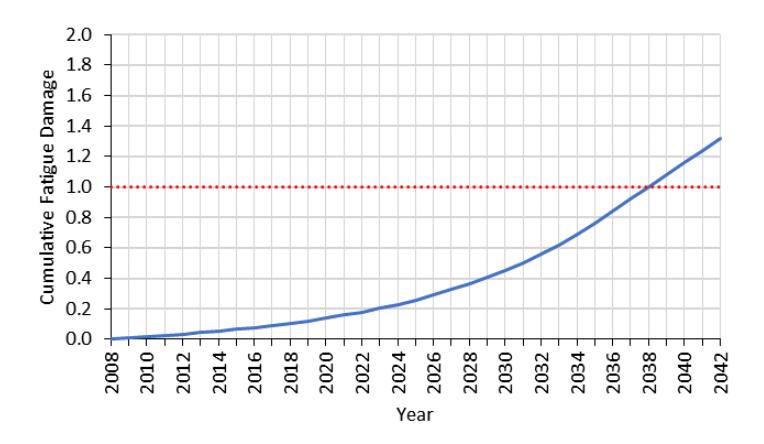
Fatigue damage accumulation on the cross-girder element.
Load Restriction Simulation
The fatigue damage in bridge structures is primarily caused by heavy vehicles. In the WIM data used in this study, 35.02% of recorded vehicles were considered as overloaded, with 38.73% of them, or 13.58% of the total number of vehicles, exceeding the allowed maximum axle load of 10 tons by more than 100%, as shown in Figure 11.
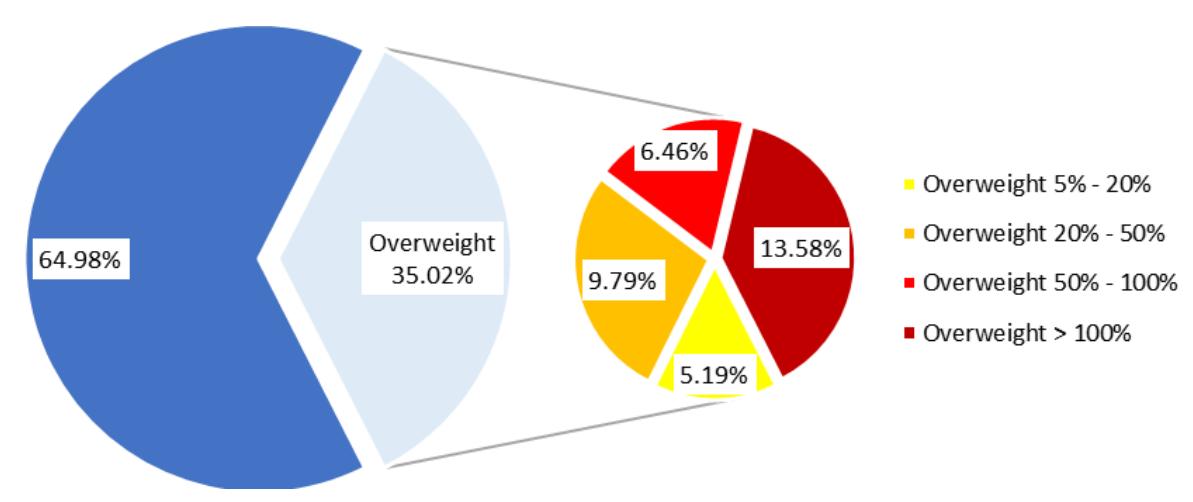
Overloaded vehicle statistics of the WIM data.
The maximum axle load recorded in the seven-day period of WIM data was 22.15 tons, but the maximum stress range value of 171.30 MPa in the cross-girder element resulted from a three-axle (comprising the fourth, fifth, and sixth trailer axles of a 6-axle semi-trailer truck) with an average axle load of 21.92 tons. This three-axle can therefore be regarded as an axle with a load of 65.76 tons, or nearly three times the 22.5-ton axle load of the 50-ton fatigue truck, generating a stress range value of 61.9 MPa.
The structural analysis results showed that all the load cycles resulting in stress ranges exceeding 110 MPa involved trucks with tandem axles, each of which exceeded the permitted load by more than 100%, or trucks with triple axles, each of which exceeded the permitted load by more than 50%. It was also found that all these load cycles contributed to 78.54% of the fatigue damage in the cross-girder element. This indicates a significant contribution of heavy vehicle traffic to the fatigue damage of the bridge.
One of the measures that can be taken when fatigue evaluation of a bridge results in an inadequate remaining life is to implement traffic restrictions on the bridge. Thus, in this study, a simulation of vehicle load restrictions was conducted to determine their influence on the fatigue life of the bridge. This simulation involved two scenarios of maximum vehicle loads. The vehicles used were two types of three-axle trucks weighing 41 tons and 26 tons, as presented in Table 7. These trucks were arranged in a convoy along the bridge, assuming a distance of 3 meters between each truck, to determine the stress range in the elements of the bridge.
| Table 7 Trucks for load restriction simulation. |
|---|
| Vehicle weight | Vehicle dimension | ||||||||||
|---|---|---|---|---|---|---|---|---|---|---|---|
| Truck Number of axles Axle Config | GVW | Axle-1 | Axle-2 | Axle-3 | Length | Width | Front overhang | Rear overhang | Axle spacing | ||
| (kg) | (kg) | (kg) | (kg) | (mm) | (mm) | (mm) | (mm) | (mm) | |||
| 41T | 3 | 1-2-2 | 41,000 4,100 18,450 18,450 8,245 | 2,545 | 1,400 | 1,200 | 4,145 1,500 | ||||
| 26T | 3 | 1-2-2 | 26,000 2,600 11,700 11,700 8,600 | 2,490 | 1,280 | 1,940 | 4,030 1,350 | ||||
Fatigue life calculations from this simulation were performed on the cross-girder element using the cumulative fatigue damage method. It was shown that the two restriction scenarios with maximum truckloads of 41 tons and 26 tons produced stress range values on the cross-girder element of 100.2 MPa and 64.5 MPa, respectively. Load cycles resulting in a stress range exceeding these values after the year 2022 were eliminated, consequently reducing the accumulation of fatigue damage as shown in Figure 12. The results of fatigue life calculations indicated that enforcing maximum vehicle loads of 41 tons extends the estimated remaining fatigue life by 10 years and enforcing a maximum vehicle load of 26 tons results in an estimated fatigue life that exceeds the design life of the bridge.
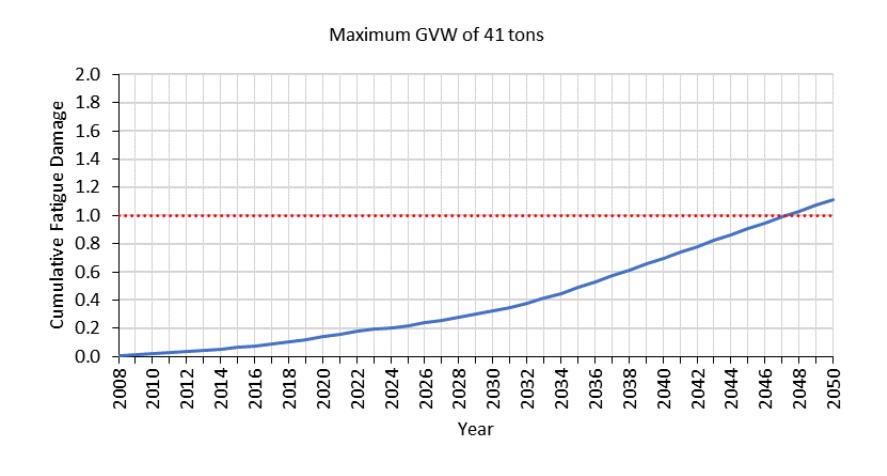
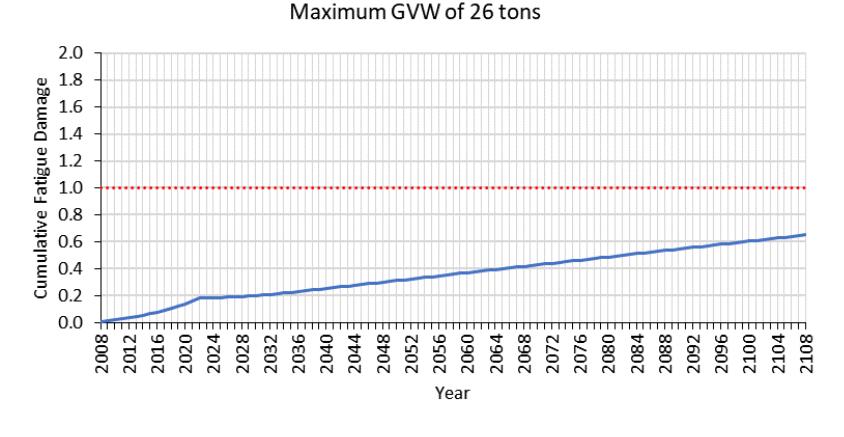
Fatigue damage accumulation of the cross-girder element with load restrictions.
Fatigue evaluation of Rumpiang Bridge, located in South Kalimantan, was conducted using WIM data from Banten due to the unavailability of a WIM station at the bridge location. With a total of 13,338 vehicles recorded over a seven-day period of WIM data, averaging 1,905 vehicles per day, the traffic volume from the WIM data was slightly higher than the annual average daily traffic of 1,722 vehicles per day acquired from traffic counting on the road segment on the actual bridge's location. From the perspective of traffic load, it was difficult to compare the actual vehicle weight statistics without WIM data at the bridge location. However, the traffic in Banten, being a more densely populated area than South Kalimantan, should have heavier traffic. The placement of a WIM station in Banten among the few stations available in Indonesia should explain the heavy traffic present at the location.
The use of WIM data from a different location than that of the bridge presents two possibilities: overestimation or underestimation of the fatigue life of the bridge. In this study, the higher number of cycles and higher vehicle load
obtained from the WIM data consequently resulted in a shorter remaining fatigue life of the bridge than it may actually be. Generally, using WIM data from a location that indicates a higher traffic volume and traffic load in fatigue evaluation will yield a more conservative result regarding fatigue life. When the evaluation results in an adequate remaining fatigue life, it ensures that the bridge has a low risk of fatigue failure under the actual traffic. However, when the fatigue life is short, as observed in this study, evaluation with actual WIM data from the bridge's location is needed to conclude whether the bridge has insufficient fatigue performance and whether traffic load restriction or other preventive measures are necessary.
Conclusions
Based on the conducted traffic load simulation, Rumpiang Bridge is prone to fatigue. A relatively short fatigue life is estimated for the cross-girder element, with the shortest fatigue life resulting from the analysis using the cumulative damage method. This short fatigue life may be conservative, as the bridge design satisfies the fatigue design requirements in the codes. The fatigue susceptibility is primarily due to the overloaded traffic indicated in the utilized WIM data.
In evaluating fatigue life, the study also referred to both the AASHTO MBE 2018 and RSNI T-03-2005 standards, which involve two different approaches: one utilizing a direct formula and the other using a graphic plot. Despite the differences in methodology, the results from both standards produced comparable fatigue life estimates. However, the cumulative fatigue damage method is recommended for periodic fatigue evaluations of existing bridges, as it provides a quantitative overview of the bridge's fatigue damage and accommodates changes in assumptions regarding vehicle loads and traffic conditions over time.
Fatigue evaluation of bridges is highly influenced by the determination of applied loads and the number of cycles. In this study, WIM data from a different location were utilized due to the unavailability of data at the actual location. The use of data obtained from the bridge site would result in more accurate fatigue evaluation. However, in the absence of actual traffic data, the utilization of available WIM data from different locations of WIM stations in Indonesia, which are mostly positioned in heavy traffic areas, can still be employed for a preliminary evaluation of existing bridges, especially those facing issues with overloaded vehicles and therefore susceptible to fatigue.
The traffic restriction simulations performed in this study demonstrate the significance of reducing vehicle loads to minimize fatigue risks on bridges. When fatigue life assessments are conducted based on actual traffic information, such simulations could serve as a basis for implementing load restrictions in the field.
Nomenclature
= Detail-category constant
= Average daily truck traffic in a single lane = Present age of the bridge detail in years
= Dead load
= Estimated annual traffic-growth rate expressed in decimal
= Steel yield strength = Steel ultimate strength
= Live load
= Number of stress-range cycles that would cause failure at a particular stress range
= Number of stress-range cycles per truck passage
= Number of stress-range cycles that take place at a particular stress range
= Resistance factor = Fatigue life in years
= Percentage of cycles at a particular stress range
∆ = Effective stress range
∆ = The particular stress range in stress range histogram
∆ = Headway in duration ∆ = Headway in distance
Compliance with ethics guidelines
The authors declare that they have no conflict of interest or financial conflicts to disclose.
This article does not contain any studies with human or animal subjects performed by any of the authors.