
Introduction
In 2016, an earthquake of magnitude 7.8 struck Kaikoura, New Zealand, causing the rupture of twelve main faults and five previously unmapped ones in a single event, which raised questions about the movement mechanics [1]. More recently, in February 2023, two significant earthquakes of magnitudes 7.8 and 7.6 occurred in the East Anatolian Fault region, Turkey-Syria, resulting in damage to buildings and rupture of at least two major fault lines [2]. These earthquakes showed a detailed rupture with significant movement in the form of a strike-slip fault and a unique geometric shape (Figure 1). The unique geometries observed in the Kaikoura and Turkey-Syria earthquakes have raised questions about the mechanics of fault movement and the underlying physical processes. Rather than on the arcuate shape of megathrusts [3], this study focused on the fault rupture of the actual earthquakes. Analysis of these events is crucial for a better understanding of earthquake dynamics and for improving seismic hazard assessment in the future, which is currently mostly focused on straight lineament shapes [4].
In this study, we applied principles of dynamics, physics mechanics, and rupture concepts to quantitatively describe the geometry of the arc-shaped and straight-lined ruptures in the Kaikoura and Turkey-Syria earthquakes. By simplifying the ruptures into lines and arcs, we were able to measure the length, radius, and degree of the circles that made up the arc shapes and analyzed the movement along the fault lines. Compared to previous concepts of fault studies based on features of morphology [5-9], this methodology provides a way to understand faulting mechanisms combined with physics mechanics through Newton's law of dynamics [10-12]. This method represents a pioneering approach to
earthquake behavior prediction, utilizing a simplified two-dimensional (2D) model of the strike-slip fault and the geometry of the fault ruptures. However, it does not account for the heterogeneous geological background (e.g. variation of fault geometry and crustal heterogeneity) and real strain accumulation measurements.
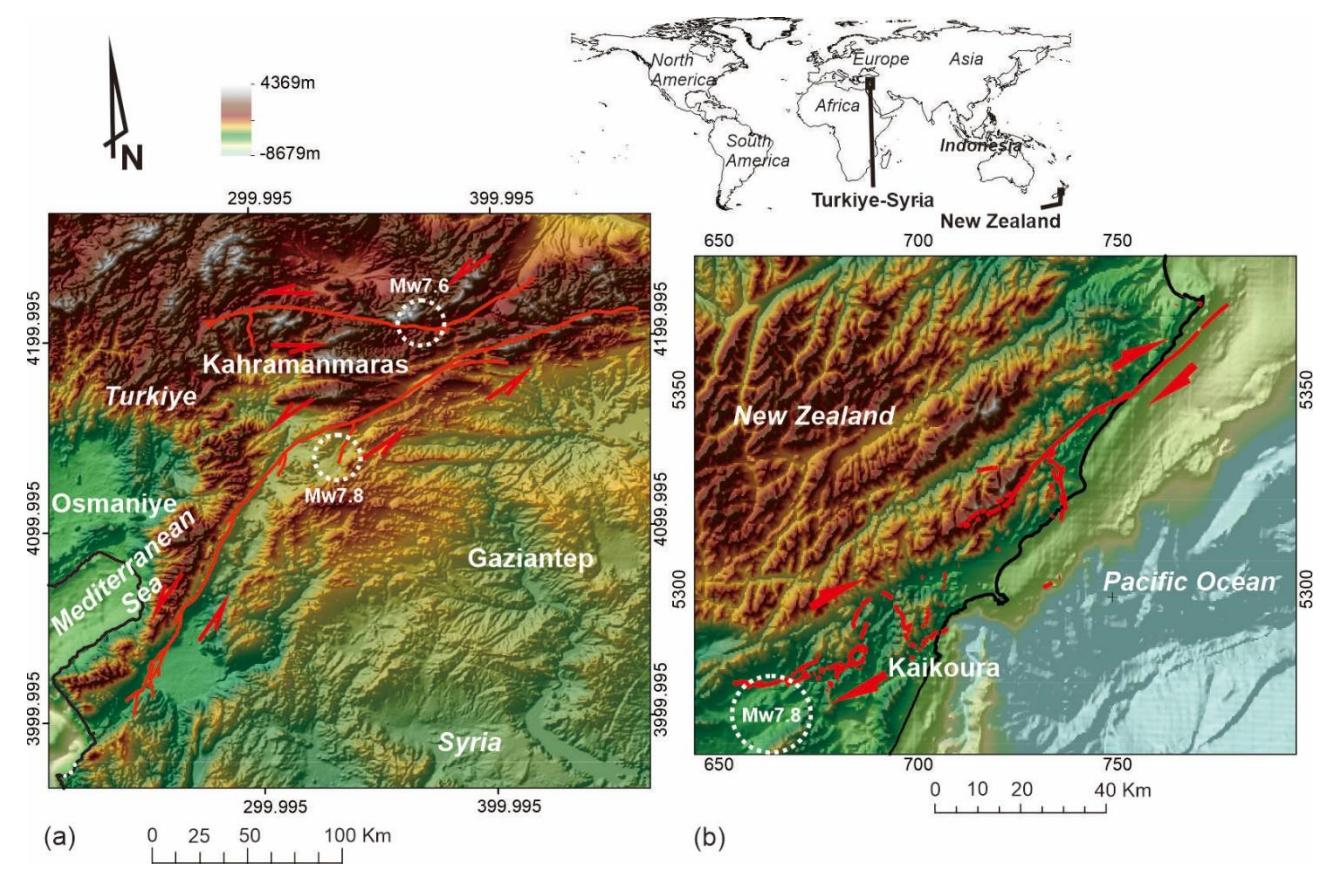
Fault rupture maps with a) the East Anatolian Fault rupture of the 2023 Turkiye-Syria Mw7.8 and Mw7.6 [2] earthquakes, and b) the Kaikoura Fault rupture of the 2016 Mw7.8 earthquake [1]. The topographic data were sourced from the GEBCO databases [13].
Background
Focal Mechanism, Slip and Vector Force on Strike-slip Faults
In seismology, a strike-slip fault earthquake is identified by its symmetrical quarter quadrant of a beach ball focal mechanism (Figures 2a and 2b), indicating a movement of the fault that first involves a pull-dilatation motion, followed by a push-compression motion [14]. This movement is shown by the fault slip caused by pressure vector P and tension vector T on Plate A and Plate B (Figure 2b). According to theory, this vector distribution has the biggest vectors as diagonal lines in each quadrant (Figures 2c and 2d) [15]. The perpendicular/normal vector (N – hereinafter referred to as normal vector) is in the center of each side, calculated based on the geometry and trigonometry of a triangle, as well as the radius of the diagonal quadrant as an arc (Figures 2d and 2e) [11]. The P, T, and N vectors have the same values and a contrary orientation.
However, in the case of a rupture occurring in an arc shape (Figure 3a), the distribution of vectors is expected to be different from that of a straight line. The breakdown of the vectors for an arc-shaped rupture is based on the geometry of a circle, as shown in Figure 3b. An arc shape has a length, degree of circle, radius, and a normal vector in the center of the arc shape. The distribution of vectors for this type of rupture is currently unknown. The objective of this paper was to identify the distribution of these unknown vectors and the characteristics of the continuation of fault rupture as both a line and an arc in actual earthquake rupture lines. The CADs of Figures 2 and 3 are available as electronic supplement 1 (e-supplement1).
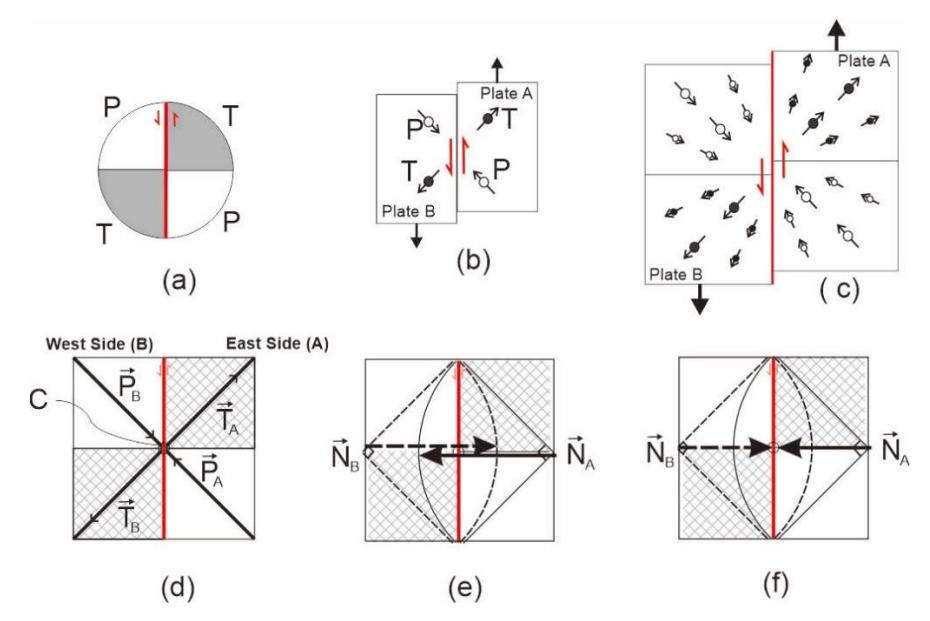
Modified model from Cox and Hart [15] of a strike-slip fault earthquake and the vector distribution as a simple straight line circuit, showing (a) the focal mechanism quadrant of compression P and tension T, (b) the slip on the plate, and (c) the slip vector distribution of motion pull-dilatation and push-compression. (d) Vector P and T on Plate/Side A and Plate/Side B, while C is the center where the major vector points meet. (e) The perpendicular/normal vector in this circuit for each plate/side. The geometric arc shape is interpreted from the distance of the diagonal of each quadrant as the radius of a circle. For straight lines, Vector N is the equal and contrary for each plate/side. The arc shape trace is imaged as a representation of the amount of friction that is absorbed by the fault. (f) Simplified image of the line circuit, with the perpendicular line to the isosceles triangle of the fault line [11]. Both sides have the same values for vector length but opposite directions.
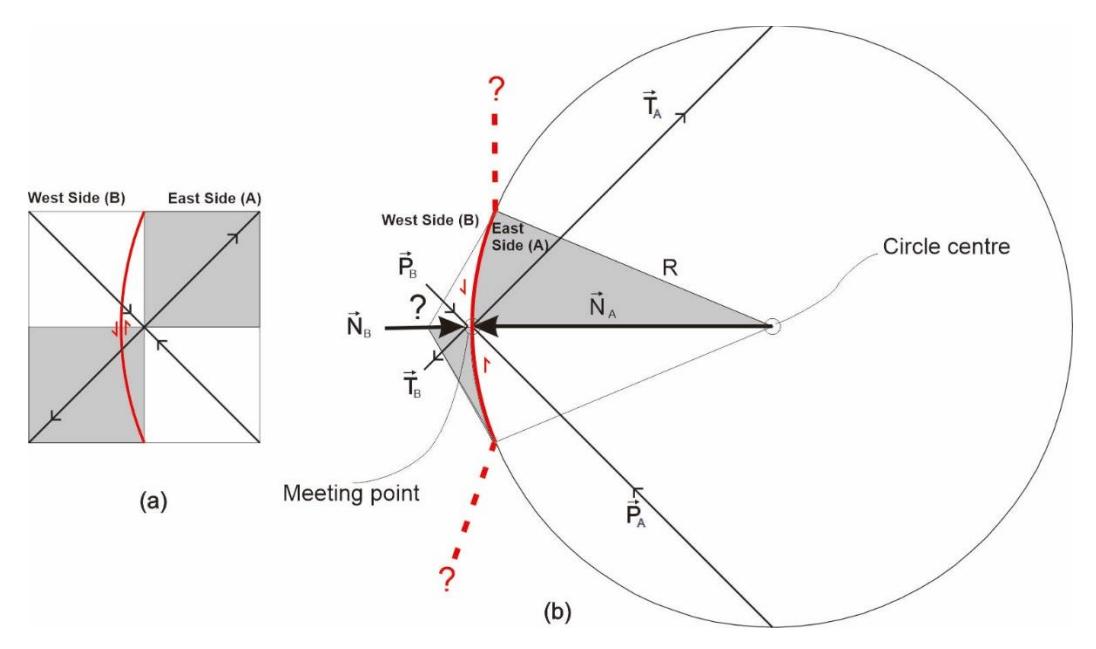
Strike-slip fault with an arc shape, showing (a) the original fault rupture as a straight line with vector forces, with the original major vectors not corrected for arc shape ruptures. (b) The arc parameters as part of a circle. An arc shape has an arc-length, arc-radius, and circle-center of the arc. The main vector (NA) of the arc shape, based on its geometry, is the force from the circle's center to the middle of the arc-length. Vectors T and P of Side A can also measure the base of the full circle of the arc fault. Vectors on Side B are unknown, as is the continuation of the fault line.
Floating of a Part-Circle Rigid Body above the Asthenosphere
The present study aimed to comprehend the behavior and kinematics of fault ruptures in the earth's crust. In a 2D model, the arc shape has a radius, length, degree of circle, and a northing degree (Figure 4). In a 3D model, the arc shape is represented as a homogeneous layer floating above the viscous asthenosphere, adhering to the laws of buoyancy and isostasy of the crust [16-18]. The shape moves with a very small slip compared to the length of the arc shape (deltaL). In this case, the gravitational force can be ignored and the movement vector as plate interaction is dominant.
Part of a circle in (a) a 2D model, with length, radius, center of circle, center of length, degree of circle, and northing degree. (b) In this 3D model, the shape is represented as a floating body above the asthenosphere, which is fluid. It has a length L and a small movement of DeltaL, which is similar to the slip of an earthquake.
Gears, Double Twin Ribbons in Arc and Line Circuit
In the context of dynamics engineering and Newton's laws [19], the interaction of shapes can be likened to gears held in place by a small gear and tightened to a wall with springs and a counterweight. In the concept of gear mechanics, gears change the force direction without changing the force value [12]. In this paper, an engineering concept is proposed that involves double twin ribbons in the line and arc face, which are tightened by springs under steady conditions (Figure 5). The solid red and blue dashed lines represent the twin ribbons. It is assumed that there is no self-friction between the ribbons and that the friction is generated by the pressure of the springs. If the circuit moves the same DeltaL length of the red and blue ribbons, the weight of the forces must exceed the friction of the normal forces.
Circuit of force in an angular ABC setup. Circuit illustration of double ribbons (solid line – red and dashed line – blue) with the weight F on the straight lines and the arcs. The red line has a gear that changes the force's orientation. The double ribbons move with the same length (slip) and the same weight.
Methods
The digital data sets of the ruptures from the Kaikoura earthquake and the Turkiye-Syria earthquake were plotted using the Universal Transverse Mercator (UTM) metric projection system in computer-aided design (CAD) software. The Kaikoura rupture was plotted using UTM59S and the Turkiye-Syria rupture was plotted using UTM37N. Simple lines and arcs were used to trace the ruptures. Lines were defined by start and end coordinates, while arcs were defined by start and end coordinates, circle center coordinates, length, radius, and the triangle-degree of the circle. All simplifications of the ruptures, measurements, numbering, and other relevant details are shared in an electronic supplement as CAD DWG files. Two main vectors were identified: one vector along the fault rupture and the other one as a normal vector. Normal vectors for lines are represented by triangles with a 90-degree angle at the line, while normal vectors for arc shapes are based on the center line of a pizza slice shape. Vector calculations were performed by copying/moving the lines sequentially based on direction, resulting in a total line from the first coordinate to the last coordinate.
Results
Kaikoura Earthquake Ruptures
The Kaikoura rupture consisted of eight simplified fault shapes, including six arcs and two lines (see Figure 6). Each arc and line shape has triangle lines representing the normal vectors. The start, end, center, length, and degree percentage of the full circle for each shape are provided in Table 1. In general, the degrees of the circle range from 33 to 239 degrees, which means they represent about 9% to 66% of a full circle. The major vector lines are numbered 1, with a length of 34.5 km, and 7, with a length of 39 km. The straight line, or line shape, assumes an ideal strike-slip fault with a 90-degree angle and 25% of a full circle. The total length of the lines and arcs is 178.2 km.
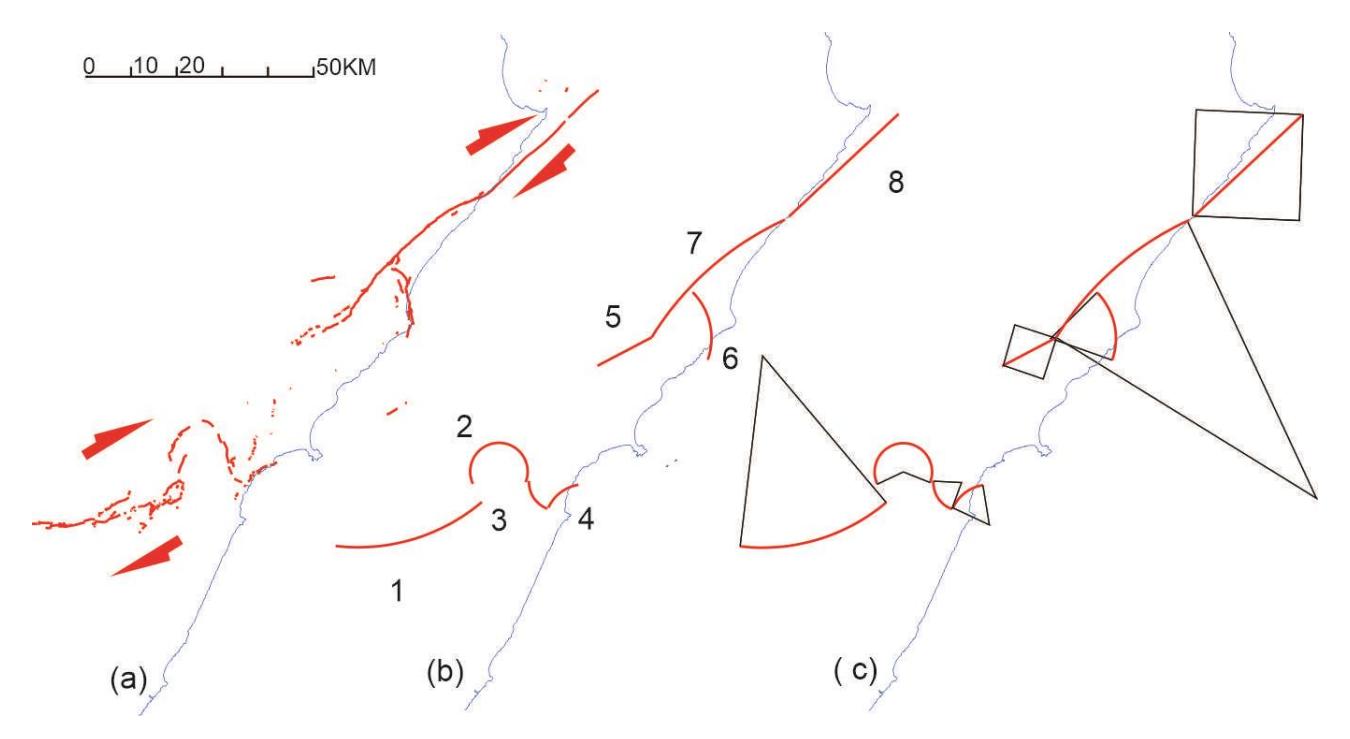
a) Rupture of the Kaikoura earthquake. (b) Eight simplified red lines to characterize the rupture as straight lines and arcs under CAD. (c) Black lines represent the area of the perpendicular vector.
(a) Black arrows are perpendicular/normal vectors – N. (b) Simplified rupture lines of the Kaikoura earthquake.
| Table 1 | Kaikoura rupture simplification geometry as straight lines (Line) and arcs. |
|---|
| Shape | Coord Start | Coord End | Coord Curve Centre | Length (meter) | Degree of Circle | ||||
|---|---|---|---|---|---|---|---|---|---|
| Х | Υ | х | Υ | Х | Υ | Degree | % Full circle | ||
| Arc | 655,146.3915 | 5,278,450.4525 | 687,284.6313 | 5,288,109.1985 | 660,083.8891 | 5,320,318.8725 | 34,514.1 | 47 | 13.1 |
| Arc | 686,972.7533 | 5,289,516.1190 | 696,942.5965 | 5,292,494.5530 | 691,077.8174 | 5,293,842.0622 | 25,034.7 | 239 | 66.4 |
| Arc | 627,646.6880 | 5,292,794.1850 | 701,706.7510 | 5,286,660.7500 | 703,854.7170 | 5,292,493.1173 | 7,871.0 | 73 | 20.3 |
| Arc | 701,929.8746 | 5,286,935.8632 | 708,529.1820 | 5,291,940.2220 | 709,971.3311 | 5,283,184.9710 | 8,616.8 | 56 | 15.6 |
| Line | 712,728.1880 | 5,318,058.1090 | 724,634.7785 | 5,324,301.6380 | NA | NA | 13,444.3 | 90(line default) | 25 (line default) |
| Arc | 736,986.4195 | 5,319,384.5210 | 733,660.3460 | 5,334,241.7170 | 723,458.9233 | 5,324,157.0280 | 16,049.0 | 64 | 17.8 |
| Arc | 724,679.3010 | 5,324,347.9460 | 754,070.1635 | 5,350,345.8010 | 781,921.3984 | 5,289,039.0221 | 39,655.6 | 33 | 9.2 |
| Line | 754,836.8320 | 5,350,838.7201 | 778,963.8580 | 5,373,401.0620 | NA | NA | 33,032.9 | 90(line default) | 25 (line default) |
| 178,218.3 | |||||||||
Figure 7 describes the distribution of normal vectors for the Kaikoura rupture. For straight lines (notations 5 and 8) the normal vectors are based on 90-degree triangles, following the conceptual idea in Figure 2. Table 2 provides detailed information on the start and end coordinates, position side, radius, and northing degree. Figure 7b shows the vector lines along the ruptures. The red lines and arcs represent the fault rupture and the simplified shape, while the black arrows indicate the perpendicular/normal vector, or N. The total vector length on the north side is 104.6 km, with a direction vector of N321°E. On the south side, the total vector length is 63.5 km, with a direction vector of N156°E. The CAD shape analysis of the Kaikoura earthquake is available as e-supplement2.
Table 2 Perpendicular vector of Kaikoura rupture.
| Vector Side | Coord Start | Coord End | Radius (meter) | Northing Degree | ||
|---|---|---|---|---|---|---|
| X | Y | X | Y | |||
| North side | 660,083.8891 | 5,320,318.8725 | 672,217.9675 | 5,279,944.2813 | 42,158.5516 | 163 |
| South side | 691,077.8174 | 5,293,842.0622 | 689,385.5879 | 5,299,588.9024 | 5,990.8107 | 344 |
| NA | 703,854.7170 | 5,292,493.1173 | 698,672.0131 | 5,289,062.3963 | 6,215.3251 | 236 |
| South side | 709,971.3311 | 5,283,184.9710 | 704,609.8392 | 5,290,255.2340 | 8,873.2302 | 323 |
| North side | 715,559.7188 | 5,327,133.1688 | 718,681.4833 | 5,321,179.8735 | 6,722.1379 | 152 |
| South side | 721,803.2478 | 5,315,226.5783 | 718,681.4832 | 5,321,179.8735 | 6,722.1379 | 298 |
| NA | 723,458.9233 | 5,324,157.0280 | 737,457.1184 | 5,327,290.7974 | 14,344.6846 | 77 |
| South side | 781,921.3984 | 5,289,039.0221 | 737,408.1869 | 5,339,456.7950 | 67,256.0616 | 319 |
| South side | 778,181.5159 | 5,350,056.3781 | 766,900.3450 | 5,362,119.8911 | 16,516.4513 | 137 |
| North side | 766,900.3450 | 5,362,119.8911 | 755,619.1741 | 5,374,183.4041 | 16,516.4513 | 313 |
| South side | 104,660.7 | m ; | 321 | S | ||
| North side | 63,576.6 | m ; | 156 | N |
Turkiye-Syria Earthquake Ruptures
The 2023 Turkiye-Syria earthquake event consisted of two events: the first was a major earthquake of Mw7.8, and the second was a major earthquake of Mw7.6. We describe them as two separate events. The first event occurred in the southern part close to the Mediterranean Sea and can be simplified to a rupture shape of eight lines and arcs (see Figure 8 and Figure 9). Figure 8a shows the fault rupture during the first Turkiye-Syria earthquake event, simplified with line and arc shapes in Figure 8b. For all shapes we present attributes in the form of normal force vectors (Figure 8c and Figure 9a); in the case of straight lines (notations 1 and 3), this is derived with 90-degrees triangles. Figure 9b shows the strike slip vectors along the main fault ruptures, including start, end, and center coordinates, length, and degree of the circle. The total length is 395 km. The normal vectors include the start and end coordinates, radius, and northing degree. The south side has a total length of 257.3 km with a direction of N327°E, while the north side has a length of 256.8 km and a direction of N143°E.
(a) Fault rupture during the first Turkiye-Syria earthquake event. (b) Simplification of lines and arcs under CAD. (c) With normal/perpendicular force rectangles for each shape.
(a) Perpendicular/normal vectors. (b) Strike slip vectors along the fault ruptures.
The second event's rupture geometry can be simplified to two lines (notations 11 and 13) and three arcs (notations 9, 10, and 12; Figure 10). The fault rupture of the second event of the Turkiye-Syria earthquake is shown in Figure 10a, with the simplified rupture as lines and arcs in Figure 10b. The arc shape circular attributes are shown in Figure 10c and the normal vectors of the rupture segments in Figure 10d. Figure 10e shows the vectors along the main fault ruptures, and Figure 10f shows the vectors along the fault ruptures and normal vectors. The parameters for these shapes are similar to those of the first fault. All of the data is presented in Tables 3 and 4. CAD analysis files are available as esupplement3 for the first event and e-supplement4 for the second event.
(a) Fault rupture of second event of the Turkiye-Syria earthquake. (b) Simplified rupture as lines and arcs. (c) With perpendicular/normal triangles. (d) With perpendicular/normal vectors. (e) Main fault slip. (f) With the original fault rupture.
Table 3 Turkiye-Syria rupture simplification as lines and arcs on the first earthquake event (Fault-1) and the second earthquake event (Fault-2).
| Number | cl | Coord Start | Coord End | Coord Curve Centre | Degree of Circle | |||||
|---|---|---|---|---|---|---|---|---|---|---|
| Number Si | Shape | х | Υ | х | Υ | Х | Υ | Length (meter) | Degree | % Full circle |
| FAULT-1 | ||||||||||
| 1 | Line | 245,323 | 4,005,718 | 293,079 | 4,112,737 | NA | NA | 117,191 | 90(line default) | 25 (line default) |
| 2 | Arc | 295,070 | 4,113,985 | 341,662 | 4,155,312 | 357,043 | 4,091,043 | 64,850 | 56 | 15.6 |
| 3 | Line | 341,662 | 4,155,312 | 334,563 | 4,133,371 | NA | NA | 23,060 | 90(line default) | 25 (line default) |
| 4 | Arc | 330,614 | 4,151,960 | 382,549 | 4,185,483 | 293,610 | 4,266,279 | 62,517 | 30 | 8.3 |
| 5 | Arc | 406,810 | 4,184,939 | 375,832 | 4,179,457 | 397,873 | 4,145,171 | 32,297 | 45 | 12.5 |
| 6 | Arc | 408,103 | 4,196,712 | 375,098 | 4,178,662 | 421,868 | 4,132,344 | 38,150 | 33 | 9.2 |
| 7 | Arc | 437,196 | 4,209,968 | 406,195 | 4,196,131 | 386,498 | 4,281,906 | 34,163 | 22 | 6.1 |
| 8 | Arc | 437,814 | 4,210,147 | 461,093 | 4,212,872 | 454,412 | 4,169,153 | 23,722 | 31 | 8.6 |
| TOTAL LENGTH | 395,951 | |||||||||
| FAULT-2 | ||||||||||
| 9 | Arc | 281,077 | 4,207,758 | 336,069 | 4,211,534 | 312,483 | 4,152,697 | 57,025 | 52 | 14.4 |
| 10 | Arc | 300,266 | 4,195,636 | 301,239 | 4,215,274 | 321,881 | 4,204,408 | 20,296 | 50 | 13.9 |
| 11 | Line | 351,234 | 4,208,327 | 336,069 | 4,211,534 | NA | NA | 15,501 | 90(line default) | 25 (line default) |
| 12 | Arc | 351,956 | 4,208,147 | 390,734 | 4,209,650 | 369,881 | 4,246,674 | 40,300 | 54 | 15.0 |
| 13 | Line | 418,403 | 4,230,073 | 386,760 | 4,207,580 | NA | NA | 38,823 | 90(line default) | 25 (line default) |
| TOTAL L | ENGTH | 171.945 | ||||||||
| Table 4 | Perpendicular vector of Turkiye-Syria earthquake for the first earthquake event (Fault-1) and the second |
|---|---|
| earthquake event (Fault-2). |
| N | Vt c!-l- | Coord | l Start | Coo | rd End | Radius (meter) | Northing Degree | |
|---|---|---|---|---|---|---|---|---|
| Number | Vector Side | х | Υ | х | Υ | • | ||
| FAULT-1 | ||||||||
| 1A | South side | 269,201 | 4,059,227 | 322,710 | 4,035,349 | 58,596 | 294 | |
| 1B | North side | 215,691 | 4,083,105 | 269,201 | 4,059,227 | 58,596 | 114 | |
| 2 | South side | 357,043 | 4,091,043 | 313,192 | 4,140,481 | 66,084 | 318 | |
| 3A | North side | 349,083 | 4,140,792 | 338,112 | 4,144,342 | 11,530 | 108 | |
| 3B | North side | 327,142 | 4,147,891 | 338,112 | 4,144,342 | 11,530 | 288 | |
| 4 | North side | 293,610 | 4,266,279 | 358,774 | 4,165,325 | 120,159 | 147 | |
| 5 | South side | 397,873 | 4,145,171 | 390,771 | 4,185,307 | 40,759 | 360 | |
| 6 | South side | 421,868 | 4,132,344 | 390,284 | 4,190,095 | 65,824 | 331 | |
| 7 | North side | 386,498 | 4,281,906 | 422,369 | 4,201,541 | 88,007 | 156 | |
| 8 | South side | 454,412 | 4,169,153 | 449,270 | 4,213,080 | 44,226 | 353 | |
| South side | 257,323.2 | m; | 327.0 | NW | ||||
| North side | 256,885.6 | m; | 143.0 | SE | ||||
| FAULT-2 | ||||||||
| 9 | South side | 312,483 | 4,152,697 | 308,141 | 4,215,936 | 63,388 | 356 | |
| 10 | South side | 321,881 | 4,204,408 | 298,583 | 4,205,562 | 23,327 | 273 | |
| 11A | North side | 342,048 | 4,202,347 | 343,652 | 4,209,930 | 7,750 | 12 | |
| 11B | South side | 345,255 | 4,217,513 | 343,652 | 4,209,930 | 7,750 | 192 | |
| 12 | North side | 369,881 | 4,246,674 | 371,527 | 4,204,213 | 42,493 | 178 | |
| 13A | South side | 413,828 | 4,203,005 | 402,581 | 4,218,826 | 19,411 | 325 | |
| 13B | North side | 391,335 | 4,234,648 | 402,581 | 4,218,826 | 19,411 | 145 | |
| South side | 95,386.0 | m ; | 170.0 | S | ||||
| North side | 66,825.6 | m; | 337.0 | N | ||||
Discussion
Kaikoura Earthquake Ruptures compare to Turkiye-Syria Earthquake Ruptures
The Kaikoura earthquake was a multi-fault rupture with variations in unique shapes such as circles, arcs, and lines. The circular movement is a clear and obvious movement that does not follow the major fault system in this region [1,20- 24]. Simplifying the fault rupture of the Kaikoura Mw 7.8 earthquake, the lines and arcs of this rupture have eight units, while the first event of the Turkiye-Syria rupture has eight units, and the second event (Mw 7.6) has five units (Figure 11a).
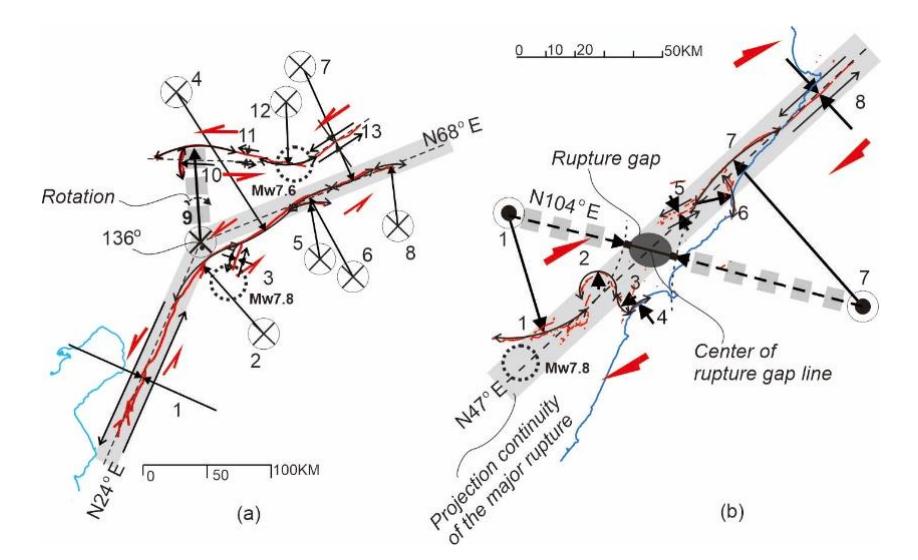
(a) Vector distribution of the Turkiye-Syria earthquake. The first event had a bend rupture about 136 degrees (N24°E and N68°E). Vector number 9 (second earthquake) had its start point on the bending angle of the first earthquake. Possibly the slip of the first event rotated this vector and triggered the rupture of the second earthquake. (b) Vector distribution of the Kaikoura earthquake. It has a major interpreted line from the major rupture number 8 with orientation N47°E. The major normal vector of arc number 1 and number 7 is projected as a straight line (N104°E) with a rupture gap in the center. Dotted circles are represented as moving up under the right-hand rule. Crossed circles are represented as moving down under the right-hand rule. The dotted circles and crossed circles represent the rotation under the right-hand rule.
The first event of the Turkiye-Syria rupture changed in orientation by ~137 degrees from SW to NE (N24oE and N68oE). Vector number 9 (second earthquake) had a start point on the bending angle of the first earthquake. Slip geodetic models showed that major slip occurred in vector number 4 (first event) and vector number 9 (second event) [25]. Possibly the slip of the first event rotated this vector and triggered the rupture of the second earthquake. Our findings are in agreement with Mei et al. [25], in which the Turkiye-Syria earthquakes are called a doublet.
The ratio of arc length vectors and the degree of the circle show that the Turkiye-Syria rupture had double the maximum arc length of the Kaikoura rupture (Figure 12). The total length of the normal vector diagram per side for each event shows that the first earthquake in the Turkiye-Syria event had the same value, at about 257 km, different from Kaikoura, which had a difference of about 40 km between both sides, and the second Turkiye-Syria event with a difference of 28.5 km (Figure 13).
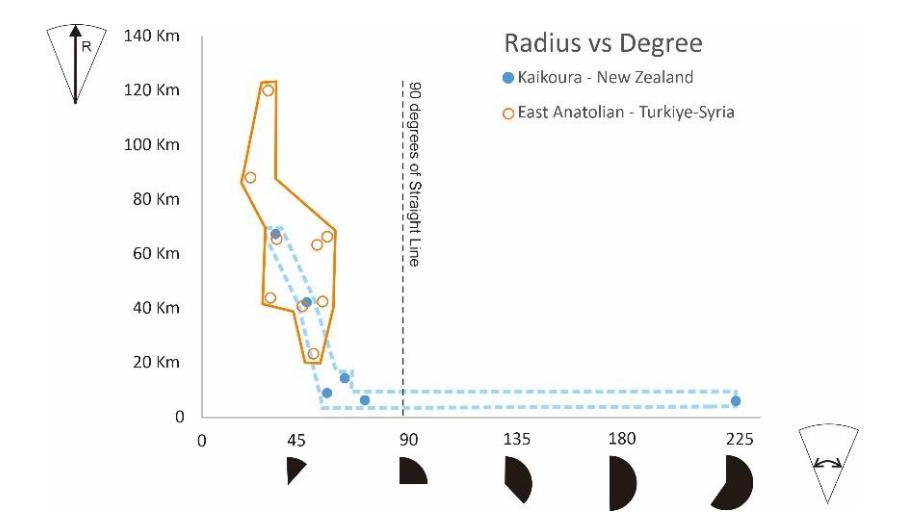
Graph of distribution of radius and arc shape degrees for both the Kaikoura earthquake and the Turkiye-Syria earthquake. The 90-degree line is the boundary of the straight-line rupture from the geometry analysis. The Turkiye-Syria earthquake rupture had arc shapes with arc-radius values of ~20-120 km and degree of circle values of ~20-60 degrees. The Kaikoura earthquake rupture had arc-length values of ~8-60 km and degree of circle values of ~30-60 degrees, with one exception of ~240 degrees.
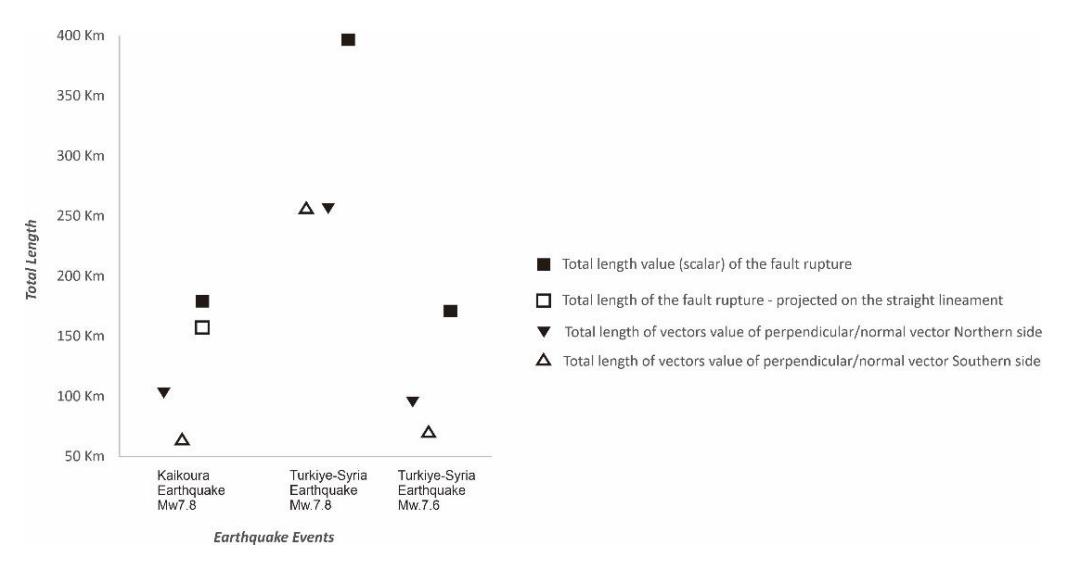
Graph of the total length of the Kaikoura earthquake Mw7.8 event, and the Turkiye-Syria Mw7.8 (first event) and Mw7.6 (second event) earthquakes. Triangles indicate the total perpendicular/normal vector for each side of the fault. Black solid squares represent the total length of the rupture. White squares indicate the length of the fault based on the straight lineament of the major part of the Kaikoura rupture.
The total length of the rupture vector for the first Turkiye-Syria event is about 400 km. The Turkiye-Syria earthquake rupture has arc shapes with a range of arc-radius values between ~20 and 120 km, and a degree of circle between ~20 and 60 degrees. The Kaikoura earthquake rupture has arc-lengths of ~8 to 60 km and a degree of circle between ~30 and 60 degrees, whereas one arc has a degree of circle of 240 degrees. The major normal vector circular projection (arc number 1 and number 7) of each side of the Kaikoura earthquake has a meeting point as a straight line with an N104oE orientation and a rupture gap in the center of those vectors (Figure 11b). The detailed rupture gap line of those vectors is 16.3 in length (between point X = 716775.6236, Y = 5305764.1677 and point X = 700920.5462, Y = 5309834.7077). The center of rupture gap line meets the projection continuity of the major rupture (N47oE trend line). It is obvious that the arc shapes of both earthquake events have different characteristics, possibly due to the geological setting.
Arc Shape for Crustal Mechanics and Seismic Hazard
Earthquake studies are a combination of geology and seismology approaches [9]. Geology studies the movement of faults based on landscape deformation, while geophysics, seismology, geodetics, and satellite imagery capture detailed rupturing, deformation, and shaking waves of a particular earthquake [5,26]. Fault ruptures are usually simplified as straight-line lineaments in seismic hazard studies [4,25,27-29].
Such studies mainly focus on the product of movement and not so much on the cause of the movement, following the laws of physics mechanics. The principles of Newton's laws of motion are triggered by force, which is an invisible value. The force vector on the crust is also studied by the product of the force as an earthquake. In this study, we tried to link the shape of the ruptures, represented by lines and arcs, to understand crustal mechanics.
Lines and arcs represent force vectors on the earth's crust and as such they are meaningful elements in the study of fault ruptures. The Earth's lithosphere can be considered as a floating material above the asthenosphere, which suggests that, to a first order, the gravitational law and the mass of the crust can be ignored within the context of our study. In this paper, we propose to measure the vector force based on the geometry of lines and arcs. There are two main vectors: the first is the vector along the fault rupture and the second is the normal vector (perpendicular to the fault rupture). Normal vectors are measured based on the arc shape attribute.
The Turkiye-Syria and Kaikoura earthquake ruptures show a different range of arc shape parameters. The Kaikoura earthquake rupture has a straight-line lineament as a single earthquake movement with a wide corridor of ~10 Km. Curiously, the total length of the straight-line lineament is smaller than the arc shape total length. It is possible that earthquakes with arc shapes produce bigger magnitudes. Our study suggests that, mechanically, the two Turkiye-Syria earthquake ruptures were possibly linked to the bending lineament point location.
Further research may focus on the link between arc-shapes and line-shapes with dislocation laws/concepts in material science. For example, the circuit of force on the atomic scale can appear both as screw and/or edge dislocation behavior [10]. Additionally, the layering atom also follows the rule of a Thompson tetrahedron circuit [11].
In this study, we applied several simplifications in our methodology. Further research to explore the controls of geological backgrounds, such as fault motions, geometry, crustal variations, geomorphological features (such as volcanoes, depression basins, anticlines, hot springs, horse tails structure, and others), on earthquake rupture behaviors are required. A massive comparison of earthquake ruptures worldwide would also help in better understanding the geologic control on the geometry of earthquake ruptures.
Conclusions
Lines and arcs provide a convenient way to describe the geometric characteristics of fault ruptures and allow an appropriate representation of force vectors on the Earth's crust. In this paper, we used such an approach to measure the vector forces based on the geometry of lines and arcs. We examined the strike-slip fault ruptures of the 2016 Mw7.8 Kaikoura earthquake in New Zealand and the 2023 Mw7.8 and Mw7.6 East Anatolian Fault earthquakes in Turkey-Syria, using simplified line and arc shapes with specific radius, length, and angle measurements. Comparing the two events, we found that the Kaikoura earthquake had a lower ratio radius-degree than the Turkey-Syria earthquakes. Detailed interpretation revealed that the Kaikoura earthquake was produced by pressure from the radius arc vector from the south-east and north-west, following the continuation of the north-easternmost fault rupture.
This indicates that the main fault vector followed this fault trend. In contrast, the Turkey-Syria earthquakes showed two independent circuit systems, with the first event having a total force vector of about 256 km and an orientation of northwest to south-east. The second event of the Turkiye-Syria earthquake had a different total force vector, at 66 km to the north and 95 km to the south. These findings suggest that the Kaikoura earthquake fault rupture was a one-circuit system, while the Turkey-Syria earthquakes had independent circuit systems for each event.
The methodology presented in this paper enables the creation of a clear and detailed representation of fault ruptures, allowing for a better understanding of the fault's behavior and kinematics as lines and arcs in strike-slip faults. Normal vectors can be seen as a new parameter to understand the behavior of arc shapes of fault ruptures. This method can be applied to other earthquake events and may provide valuable insight into the mechanics of fault movement, the underlying physical processes and improve seismic hazard assessments.
Data and Resources
All data used in this paper came from published sources listed in the references. The authors declare no competing interests. Electronic supplementary are available in four files of CAD data with the link https://data.brin.go.id/dataset.xhtml?persistentId=hdl:20.500.12690/RIN/PTUBLJ . 1) e-supplement1 – CAD analysis on the strike-slip fault. Lines were defined by start and end coordinates, while arcs were defined by start-end coordinates, circle center coordinates, length, radius, and the triangle-degree of the circle. 2) e-supplement2 – CAD analysis on the Kaikoura earthquake rupture. The Kaikoura fault rupture plotted using the Universal Transverse Mercator (UTM) metric projection system – UTM59S. 3) e-supplement3 – CAD analysis on the first event of Turkiye-Syria earthquake rupture. The Turkiye-Syria fault rupture was plotted using the Universal Transverse Mercator (UTM) metric projection system – UTM37N. 4) e-supplement4 – CAD analysis on the second event of the Turkiye-Syria earthquake rupture.
Acknowledgements
We would like to express our gratitude to Badan Riset Inovasi Nasional (BRIN) – Indonesian Research and Innovation Agency for their support of this pioneering research. We are grateful to Danny Hilman Natawidjaja, Ilham Arisbaya, and Muhammad Hanif for their insightful discussions and suggestions to improve the manuscript. Our deep appreciation goes to Nurwiyanti for funding the publication fee for this journal.
Compliance with ethics guidelines
The authors declare that they have no conflict of interest or financial conflicts to disclose.
This article does not contain any studies with human or animal subjects performed by any of the authors.