
Introduction
The World Health Organization (WHO) (World Health Organization, 1999) has reported that food safety has always been of worldwide interest. However, COVID-19 gave rise to a growing interest in food safety innovation, particularly with respect to disinfection. Non-thermal disinfection [1, 2] is an effective and successful technology that has not only been applied to food products but is also utilized in the field of materials science. Traditional thermal preservation processes may have a destructive impact on products rich in vitamins, minerals, and other natural nutrients [3, 4]. However, with non-thermal disinfection, the Design of Experiment method does not damage the product and in fact preserves its natural nutrients. Thus, a new spectrum of disinfection techniques is unfolded to researchers and practitioners in the domain of food safety innovation.
Cleaning and sanitizing agricultural products are critical steps in ensuring food safety and extending shelf life. Conventional methods for cleaning agricultural products typically include physical washing with water, chemical sanitization, and in some cases, thermal treatment. These methods are widely used to remove dirt, pesticide residues, and microbial contaminants from fruits, vegetables, and other produce. Thermal methods involve the use of heat to inactivate pathogens on the surface of agricultural products. While effective, thermal treatment can sometimes lead to undesirable changes in the texture, flavor, and nutritional quality of the produce. Additionally, thermal methods can be energy-intensive and may not be suitable for all types of produce, particularly those that are heat-sensitive. Nonthermal methods, such as chemical sanitization, use agents like chlorine, hydrogen peroxide, or organic acids to kill
pathogens. However, these methods often raise concerns about chemical residues on food, potential health risks, and environmental impact. Furthermore, some pathogens may develop resistance to chemical sanitizers, reducing their effectiveness over time.
Meanwhile, the reduction of microbial contamination on the product surface is also a concern. However, not all typical procedures or treatments are effective. Alternatively, ultrasonic (UL) treatment [5], which is used in several industries, has been suggested as an effective method in the cleansing process. It uses a transducer for converting electrical signals to deliver UL waves for improving the effectiveness of physical, chemical, or mechanical properties through a liquid medium [6]. Ultrasound is commonly used in food processing for degassing, defoaming, cleaning, and decontamination, without damaging the natural nutrients. Cavitation is an important phenomenon for microbial decontamination in the UL process. Low frequencies combined with high power [6,7], i.e., higher than 20-100 kHz (in this study, 35 kHz), can generate high-pressure, high-temperature, large cavitation bubbles [8,9]. This can be applied for decontamination in a variety of fields for reducing the concentration of bacteria, yeast, and mold.
Microbubble (MB) technology was initially designed and implemented for water treatment [10]. Bubbles with a small diameter are generated, i.e., less than 50 µm [11]. MB technology combines other techniques, such as advanced oxidation processes (AOPs), plasma activated in water (PAW) [12,13], and UL vibration [14], to optimize experimental results [15]. At present, MBs are being developed for the cleansing process to reduce or decontaminate microbes on food-product surfaces. However, the MB technique alone is insufficient for disinfection. Combination with other potential technologies will increase the efficiency of disinfection, leading to improved results. UL technology is a popular technique used in combination with MB technology. The combined use of ULs and MBs [16] is an alternative method for the decontamination of bacteria on fresh produce without causing harmful residuals. The MB technique also exhibits an important phenomenon like UL cavitation. Cavitation generates high-density MBs that dissolve in water. In some studies, a combination of UL and MB technologies [17,18] has been applied in food cleaning processes to reduce the microbial contamination of vegetables and to eliminate E. coli, Salmonella spp. and Listeria monocytogenes.
The objective of this study was to investigate the effect of MB/UL in eliminating E. coli and S. aureus based on a 2k full factorial Design of Experiment (DOE) technique using an MB/UL system, with three essential factors affecting the percentage inhibition of E. coli and S. aureus, i.e., UL duration time (s), MB duration time (s), and air flow rate (ml/min). The 2k full factorial design is important in scientific experimentation to screen the most significant factors that allow for the generation of useful and accurate data for analysis of the optimal result by creating a linear regression model. After the optimal set-up parameters have been found and applied, errors of the experimental result compared with the optimal values can then be reported. Inhibition of E. coli and S. aureus has also been discussed based on the effect of MB cavitation. Consequently, our study revealed that the application of ultrasound combination technology to the disinfection of fresh products afforded improved results under specific conditions.
It is generally hypothesized that the antimicrobial activity of ZnO nanoparticles mainly stems from the generation of a variety of reactive oxygen species (ROS), which imposes an oxidative stress upon microbial cells [12]. Additionally, Zn2+ cations released by ZnO upon prolonged contact with an aqueous environment bond with proteins, carbohydrates, and other biocomponents associated with bacteria, thus disrupting their cellular functions [13]. Zinc cations may also diffuse across the bacterial cell wall and interact with protein functional groups within the intracellular space, resulting in the disruption of enzymatic activities and cellular structural alterations [14]. The bacterial cell wall may also be damaged due to the abrasive nature of ZnO nanoparticles and by the neutralization of lipopolysaccharides electrostatic charge by Zn2+ cations in proximity of the cell wall [15]. In addition to these mechanisms, it has also been proposed that near-UV emission caused by sunlight radiation on ZnO nanoparticles may have a non-contact lethal effect on bacteria. This last mechanism has been proposed for ZnO nanoparticles embedded in polymeric films [16]. Figure 1 presents a schematic description of these antibacterial mechanisms.
Methods
Preparation of E. coli and S. aureus
To prepare Escherichia coli and Staphylococcus aureusfor experimentation, strains TISTR746 and TISTR527, respectively, obtained from the Thailand Institute of Scientific and Technological Research (TISTR) Culture Collection, were utilized. Cultures of E. coli and S. aureus were propagated in rose-apple-shaped bottles containing a nutrient-rich broth (NB)
solution composed of 5 g of peptone and 3 g of beef extract per liter of water. Following inoculation, the bottles were subjected to agitation for a duration of 12 hours to facilitate bacterial growth, as per the method described by Gates et al. (1920) [19].
Following incubation, the resulting bacterial culture was diluted in 700 ml of deionized (DI) sterilized water to achieve the desired concentration. The adjustment of bacterial concentration was carried out by measuring the optical density of the suspension using a spectrophotometer at a wavelength of 600 nm. The concentration was standardized against the 0.5 McFarland standard, which corresponds to approximately 1.5 × 10⁸ CFU/ml for E. coli and S. aureus (McFarland, 1907), to ensure consistency across experiments. This standardized preparation protocol ensured that the bacterial strains were in the optimal state for the subsequent disinfection experiments.
MB/UL Disinfection Processes
The disinfection of microbes using the microbubble (MB) technique in conjunction with ultrasonic (UL) vibration was conducted following the incubation of the bacterial cultures at 37 °C. A microbubble generator (Model XYZ, PLASTECH Co., Ltd, Thailand) was employed to produce microbubbles with a mean diameter of less than 50 µm. This generator operates by introducing pressurized air into a liquid medium, creating high-density microbubbles suitable for enhancing disinfection processes. The ultrasonic generator used was an Elma Transsonic T 460/H Ultrasonic Cleaner (35 kHz, 140 W, Switzerland) operating at 35 kHz with an amplitude of 1 μm. The UL bath, utilized for the disinfection process, was filled with sterile tap water at room temperature (27 °C). The size distribution of the microbubbles generated during the process was determined using a laser diffraction particle size analyzer (Mastersizer 2000 model, DKSH Management Ltd, Switzerland).
To prepare the liquid medium for testing the MB/UL disinfection process, the Escherichia coli and Staphylococcus aureus cultures were first standardized to a concentration corresponding to 0.5 McFarland, which is approximately 1.5 × 10⁸ CFU/ml. The standardized bacterial suspensions were then subjected to a ten-fold serial dilution technique. Sample solutions ranging from 100 to 10-6 dilutions were prepared by diluting the bacterial suspensions with a solution consisting of 10 g of peptone and 5 g/L of sodium chloride (NaCl) per liter of water. For each experiment, 100 mL of the diluted bacterial suspension was used. For the 10-6 dilution, the bacterial suspension was further mixed with the microbubble solution and agitated under ultrasonic conditions. This standardized preparation protocol ensured the uniformity and accuracy of the bacterial suspensions used in the MB/UL disinfection experiments.
Design of Experiment
In the MB/UL system, ultrasonic (UL) waves enhance and expedite the cavitation reaction of microbubbles (MB), resulting in increased MB density within the deionized (DI) water medium and subsequently heightened inhibition efficiency against microbial contaminants. To systematically investigate the influence of key parameters on the percentage inhibition of Escherichia coli and Staphylococcus aureus, three essential factors were identified, i.e., UL duration time (s), MB duration time (s), and gas flow rate (ml/min). For the Design of Experiment (DOE) methodology, these factors were each assigned two levels to facilitate a comprehensive analysis of their effects on the disinfection process. In this study, DI water was used to dilute the bacterial cultures prior to the disinfection process. The primary reason for choosing DI water was to ensure that the medium would not introduce any additional variables, such as ions or buffering agents, that could potentially interact with the microbubbles or ultrasonic waves and affect the cavitation process. DI water provides a consistent and controlled environment, allowing the study to focus specifically on the effects of the MB/UL treatment on bacterial inactivation.
The experimental design utilized a 23 full factorial approach, comprising eight unique combinations of the selected parameter levels. Each experiment was replicated three times and with additional center points replicated five times, totaling thirteen experimental runs. The UL duration time, MB duration time, and gas flow rate were systematically varied across the specified levels, as detailed in Table 1. The percentage inhibition of both E. coli and S. aureus served as the response variables for the experiment, allowing for the assessment of disinfection efficacy under different parameter combinations. The experimental data were analyzed using Analysis of Variance (ANOVA) to determine the significance of the factors and their interactions. The significance level (α) was set at 0.05 for all statistical tests. This means that results with a p-value less than 0.05 were considered statistically significant, indicating that the observed effects were unlikely to have occurred by chance.
During the experiments, the saturation level of the solution with microbubbles was carefully monitored. This was essential because two of the parameters, MB duration time and gas flow rate, directly influence the generation and stability of the microbubbles. The saturation was evaluated by observing the stability and density of the microbubbles within the solution over time, ensuring that the solution remained appropriately saturated throughout the experiment. This monitoring helped to prevent issues such as excessive coalescence or premature collapse of bubbles, which could otherwise affect the consistency and reliability of the results.
To determine the optimal conditions for maximizing disinfection efficacy, response optimizer analysis coupled with a steepest descent algorithm was employed using the Minitab 19.0 software. This analytical approach facilitated the identification of parameter settings that yield the highest percentage inhibition of E. coli and S. aureus, thus providing valuable insights for optimizing the MB/UL disinfection process.
Table 1 MB/UL disinfection system factors, levels, and codes.
| Level | Code | ||
|---|---|---|---|
| Factor | Low (-1) High (+1) | ||
| UL duration time (s) | 30 | 60 | A |
| MB duration time (s) | 30 | 60 | B |
| Gas flow rate (ml/min) | 15 | 30 | C |
Experimental Design and Data Analysis
The disinfection rates for Escherichia coli and Staphylococcus aureus were calculated based on the change in bacterial concentrations before and after the MB/UL treatment. The disinfection rates are expressed as percentages, calculated using the following formula in Eq. (1):
Disinfection Rate (%) = \[\left(\frac{Initial\ Bacterial\ Concentration - Final\ Bacterial\ Concentration}{Initial\ Bacterial\ Concentration}\right) x 100\] (1)
This formula was applied to the log10-transformed bacterial concentrations to standardize the data and allow for comparison across different conditions.
Interpreting disinfection rates:
- 1. Positive disinfection rates indicate a reduction in bacterial concentration, showing effective disinfection.
- 2. Negative disinfection rates may occur due to experimental variability, bacterial regrowth, or recontamination, and suggest an increase in bacterial concentration.
Microorganism Inspection
Following the MB/UL disinfection treatment, the efficacy of bacterial inhibition was assessed. The bacterial suspensions that had undergone disinfection were subjected to further analysis to determine the remaining viable bacteria. Postdisinfection, 100 μL of the treated bacterial suspensions were evenly spread onto nutrient agar (NA) plates. These suspensions were prepared by serial dilution of the original treated samples, similar to the method used prior to disinfection, using a solution consisting of 10 g of peptone and 5 g of sodium chloride per liter of water. The dilutions ranged from 100 to 10-6 , ensuring that a range of bacterial concentrations was available for accurate colony counting.
Subsequently, 100 μL of each diluted solution was evenly spread onto nutrient agar (NA) plates containing 5 g of peptone, 3 g of beef extract, and 20 g of agar powder per liter of water. The plates were then incubated at 37 ℃ for 24 hours to facilitate bacterial growth. Following incubation, the number of bacterial colonies present on the agar surface was enumerated and compared with that of the control set. The concentration of bacterial growth (log10) was calculated and compared with the initial bacterial concentration to determine the percentage inhibition of bacterial growth. This analysis allowed for the identification of optimal parameters to effectively inhibit bacterial growth, thereby providing valuable insight into the efficacy of the disinfection process.
Results
Microbubble Size Measurement
The microbubble size distribution obtained through laser diffraction analysis revealed a narrow and uniform distribution with an average diameter of 0.3 µm (shown in Figure 1), as shown by the peak frequency volume in the graph. The sharp, symmetrical peak indicates that most microbubbles generated fell within a similar size range, which is critical for optimizing the microbubble and ultrasonic vibration disinfection process. This consistent size distribution suggests effective microbubble production, enhancing the interaction between microbubbles and ultrasonic cavitation, leading to improved microbial disinfection efficiency.
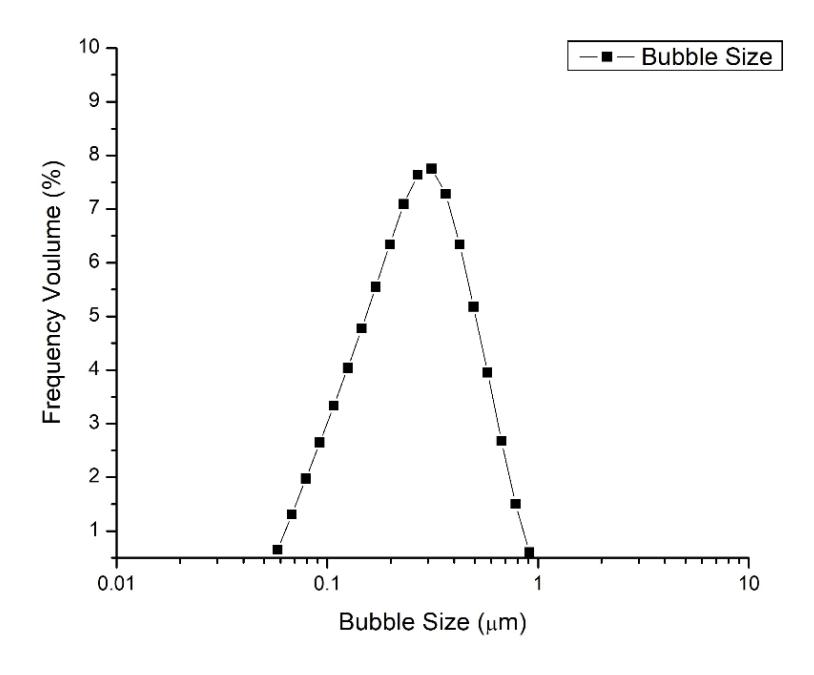
Bubble size distribution curves measured by light scattering.
Inhibition of Escherichia coli and Staphylococcus aureus by the UL/MB System
The inhibition of Escherichia coli and Staphylococcus aureus by the UL/MB system was investigated using a full factorial experimental design supplemented with central points. The experimental setup involved defining each factor at low, center, and high levels, as detailed in Table 2. Specifically, the first eight experimental combinations, along with an additional five central experimental conditions, were executed with three replicates each, totaling 29 experimental runs.
The experimental results of the MB/UL treatment of E. coli and S. aureus achieved through the generation and ultrasonic collapse of microbubbles are summarized in Table 2. These results provide valuable insight into the effectiveness of the UL/MB system in inhibiting the growth of both bacterial strains under varying experimental conditions. By systematically varying the levels of key factors and replicating experiments across multiple conditions, a comprehensive assessment of the UL/MB system's performance in microbial inhibition was achieved. These findings serve to elucidate the optimal parameter combinations for maximizing the percentage inhibition of E. coli and S. aureus, thus informing the development of more effective disinfection protocols in food safety applications.
With respect to the results of the disinfection experiments of Escherichia coli using the MB/UL system, as presented in Table 2, post-experimental calculations were performed utilizing Minitab 19.0. It was determined that all factors employed in the experiment exhibited significance, evidenced by an R-squared value of 89.83%, as depicted in Table 3. This high R-squared value suggests that the developed equation accurately represents the relationship between the factors and the percentage inhibition of E. coli, thereby validating its suitability for real-world applications. Furthermore, analysis of the residual graph revealed a normal distribution, further corroborating the robustness of the experimental model.
Table 2 Percentage inhibition based on 29 conditions: A is UL duration time (s), B is MB duration time (s) and C is gas flow rate (ml/min).
| StdOrder | RunOrder | CenterPt | Blocks | A | B | C | % E. coli (Y1) Disinfection | % S. aureus (Y2) Disinfection | |
|---|---|---|---|---|---|---|---|---|---|
| 1 | 25 | 0 | 1 | 15 | 15 | 3 | -36.69 | 15.71 | |
| 2 | 1 | 1 | 1 | 10 | 10 | 2 | -2.44 | 25.24 | |
| 3 | 2 | 1 | 1 | 20 | 10 | 2 | -20.33 | 28.91 | |
| 4 | 19 | 1 | 1 | 10 | 20 | 2 | -82.26 | 27.63 | |
| 5 | 6 | 1 | 1 | 20 | 10 | 4 | -60.39 | 23.45 | |
| 6 | 7 | 1 | 1 | 10 | 20 | 4 | 2.29 | 25.58 | |
| 7 | 21 | 1 | 1 | 10 | 10 | 4 | 76.60 | 31.14 | |
| 8 | 27 | 0 | 1 | 15 | 15 | 3 | -45.71 | 23.57 | |
| 9 | 11 | 1 | 1 | 10 | 20 | 2 | -70.94 | 24.73 | |
| 10 | 20 | 1 | 1 | 20 | 20 | 2 | -1.22 | 36.60 | |
| 11 | 10 | 1 | 1 | 20 | 10 | 2 | -17.88 | 11.40 | |
| 12 | 24 | 1 | 1 | 20 | 20 | 4 | 24.92 | 12.72 | |
| 13 | 18 | 1 | 1 | 20 | 10 | 2 | -18.04 | 17.94 | |
| 14 | 22 | 1 | 1 | 20 | 10 | 4 | -55.65 | 20.80 | |
| 15 | 5 | 1 | 1 | 10 | 10 | 4 | 57.79 | 29.04 | |
| 16 | 29 | 0 | 1 | 15 | 15 | 3 | -60.55 | 14.65 | |
| 17 | 4 | 1 | 1 | 20 | 20 | 2 | -37.30 | 33.66 | |
| 18 | 3 | 1 | 1 | 10 | 20 | 2 | -57.95 | 27.42 | |
| 19 | 23 | 1 | 1 | 10 | 20 | 4 | -22.32 | 28.79 | |
| 20 | 9 | 1 | 1 | 10 | 10 | 2 | -2.44 | 27.80 | |
| 21 | 26 | 0 | 1 | 15 | 15 | 3 | -70.64 | 12.85 | |
| 22 | 17 | 1 | 1 | 10 | 10 | 2 | 18.34 | 21.70 | |
| 23 | 13 | 1 | 1 | 10 | 10 | 4 | 61.31 | 16.44 | |
| 24 | 14 | 1 | 1 | 20 | 10 | 4 | -61.00 | 27.80 | |
| 25 | 16 | 1 | 1 | 20 | 20 | 4 | 28.74 | 17.64 | |
| 26 | 28 | 0 | 1 | 15 | 15 | 3 | -69.72 | 15.71 | |
| 27 | 15 | 1 | 1 | 10 | 20 | 4 | 45.87 | 19.05 | |
| 28 | 12 | 1 | 1 | 20 | 20 | 2 | -54.28 | 33.49 | |
| 29 | 8 | 1 | 1 | 20 | 20 | 4 | 12.07 | 14.78 | |
The equation representing the experimental results can be expressed succinctly using summary coefficients as follows:
\[Y1 = -9.86 - 11.84 A - 7.84 B + 19.04 C + 25.03 A * B - 15.90 AC + 13.92 BC + 9.36 ABC - 46.81 Ct Pt\] (2)
The experimental results pertaining to the disinfection of Staphylococcus aureus using the MB/UL system, as outlined in Table 2, underwent computational analysis utilizing Minitab 19.0. Subsequently, it was determined that all factors employed in the experiment exhibited statistical significance, with an associated R-squared value of 50.65%, as presented in Table 3. This R-squared value indicates that the equation derived from the experiment effectively captures the relationship between the factors and the percentage inhibition of S. aureus, thus confirming its suitability for practical implementation in real-world scenarios.
Moreover, examination of the residual graph of E. coli and S. aureus revealed a normal distribution, as depicted in Figure 2. This normal distribution further validates the reliability and accuracy of the experimental model. Consequently, the equation representing the experimental results can be succinctly expressed as follows:
\[Y2 = 24.327 + 1.057A + 0.851B - 2.054C + 0.698AB - 1.68AC - 3.36BC - 2.673ABC - 4.25CtPt\] (3)
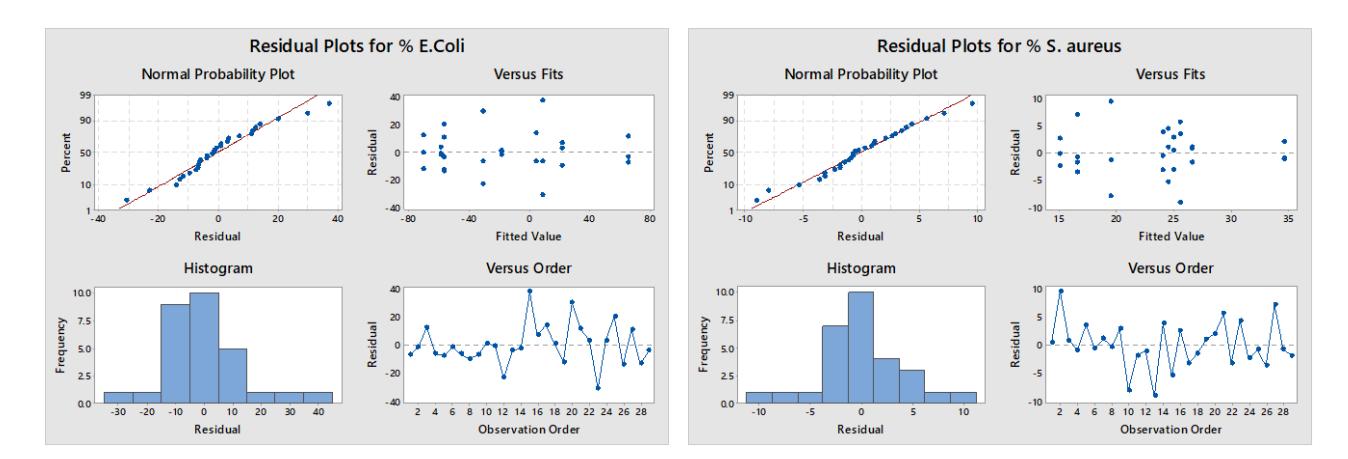
The residual plot of E. coli and S. aureus concentration percentage.
Table 3 Statistical analysis based on ANOVA.
| Source | DF | Coefficient | F-Value | P-Value | R-sq | ||
|---|---|---|---|---|---|---|---|
| Constant | -9.86 | ||||||
| Main effects | 3 | 15.81 | 0.000 | ||||
| UL duration time | 1 | -11.84 | 11.79 | 0.003 | |||
| MB duration time | 1 | -7.84 | 5.17 | 0.034 | |||
| Gas flow rate | 1 | 19.04 | 30.48 | 0.000 | |||
| 2-way interactions | 3 | 30.06 | 0.000 | ||||
| UL duration time x MB duration time | 1 | 25.03 | 52.67 | 0.000 | |||
| E. Coli | UL duration time x gas flow rate | 1 | -15.9 | 21.24 | 0.000 | ||
| MB duration time x gas flow rate | 1 | 13.92 | 16.29 | 0.001 | 89.83% | ||
| 3-way interactions | 1 | 7.36 | 0.013 | ||||
| UL duration time x MB duration time x gas flow rate | 1 | 9.36 | 7.36 | 0.013 | |||
| Ct Pt | -46.81 | ||||||
| Curvature | 1 | 9067 | 31.75 | 0.000 | |||
| Residual error | 20 | 5711 | |||||
| Pure error | 20 | 5711 | |||||
| Total | 28 | 56180 | |||||
| Constant | 24.327 | ||||||
| Main effects | 3 | 1.40 | 0.273 | ||||
| UL duration time | 1 | 1.057 | 0.77 | 0.390 | |||
| S. Aureus | MB duration time | 1 | 0.851 | 0.50 | 0.488 | ||
| Gas flow rate | 1 | -2.054 | 2.91 | 0.103 | |||
| 2-way interactions | 3 | 3.36 | 0.039 | ||||
| UL duration time x MB duration time | 1 | 0.698 | 0.34 | 0.568 | |||
| UL duration time x gas flow rate | 1 | -1.680 | 1.95 | 0.178 | |||
| MB duration time x gas flow rate | 1 | -3.360 | 7.80 | 0.011 | 50.65% | ||
| 3-way interactions | 1 | 4.94 | 0.038 | ||||
| UL duration time x MB duration time x gas flow rate | 1 | -2.673 | 4.94 | 0.038 | |||
| Ct Pt | -4.250 | ||||||
| Curvature | 1 74.75 2.15 | ||||||
| Residual error | 20 694.72 | ||||||
| Pure error | 20 | 694.72 | |||||
| Total | 28 | 1436.90 | |||||
The ANOVA results for the Staphylococcus aureus disinfection tests indicated that not all the parameters studied (UL duration time, MB duration time, and air flow rate) had a statistically significant effect on the disinfection efficacy. Specifically, the p-values associated with some parameters were above the significance level of 0.05, suggesting that these parameters did not contribute significantly to the reduction of S. aureus under the tested conditions. Among the parameters, [specify which parameters, if any, were significant, e.g., UL duration time] showed a statistically significant impact on disinfection efficacy, with a p-value below 0.05, indicating that increasing [specify parameter] enhanced the disruption of S. aureus cells, likely due to the intensified cavitation effects produced during the ultrasonic treatment.
Conversely, [specify which parameters were not significant, e.g., MB duration time and air flow rate] did not show a statistically significant effect on disinfection efficacy, as their p-values were above 0.05, suggesting that variations in these parameters within the tested range did not lead to meaningful differences in S. aureus inactivation. These relate to half-normal plot shown in Figure 3. The lack of significance for certain parameters implies that the disinfection process for S. aureus may be less sensitive to changes in [specify non-significant parameter(s)] compared to Escherichia coli, possibly due to the inherent differences in their cellular structures, with S. aureus potentially exhibiting greater resistance to cavitation effects under specific conditions. These findings underscore the importance of optimizing key parameters that significantly impact disinfection efficacy, while acknowledging that not all factors contribute equally to the process. Future research could explore broader parameter ranges or alternative conditions to identify thresholds where these factors might become more impactful, and investigating interaction effects between parameters could reveal more complex relationships that were not apparent in the initial analysis.
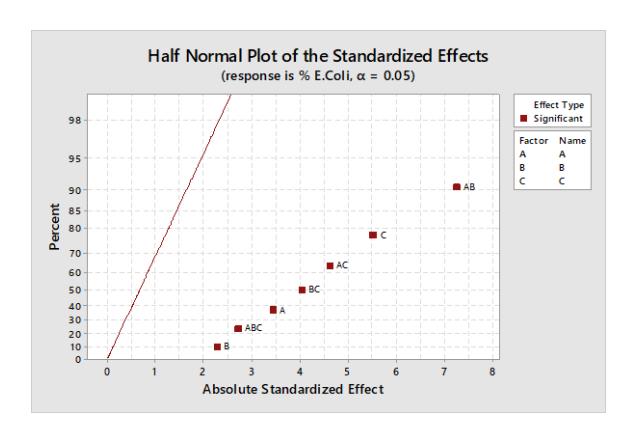
Half normal plot of E. coli and S. aureus concentration percentage.
Response Optimizer Analysis
After obtaining the response model, gradient search in Minitab 19.0 was applied to determine the optimal values based on the response for the experiments targeting the highest possible inhibition of Escherichia coli (Y1) and Staphylococcus aureus (Y2) using the MB/UL system.
For Escherichia coli, the optimal set-up parameters were identified as a UL duration time of 30 seconds, an MB duration time of 30 seconds, and an air flow rate of 30 ml/min (with a 95% confidence interval). Under these conditions, the model predicted a disinfection rate of 65.23%. This prediction was validated through experimental replication, which yielded an average disinfection rate of 54% (± standard deviation), corresponding to a 4.74-log reduction in bacterial concentration. It is important to note that the 54% reduction represents the percentage decrease in the initial bacterial population, while the 4.74-log value represents the concentration of E. coli after treatment. The discrepancy between the predicted and observed values, with an error of 17.21%, reflects the inherent variability in biological experiments.
For Staphylococcus aureus, the optimal conditions were a UL duration time of 60 seconds, an MB duration time of 60 seconds, and an air flow rate of 15 ml/min (with a 95% confidence interval). The model predicted a disinfection rate of 34.58% under these conditions. However, experimental validation revealed an average actual disinfection rate of 19% (± standard deviation), corresponding to a 4.3-log reduction in bacterial concentration after treatment. Again, the 19% reduction represents the percentage decrease in the initial population, while the 4.3-log value indicates the bacterial concentration post-treatment. The larger error of 45.05% suggests that S. aureus, being a gram-positive bacterium, may be less susceptible to the physical effects of the MB/UL system compared to E. coli.
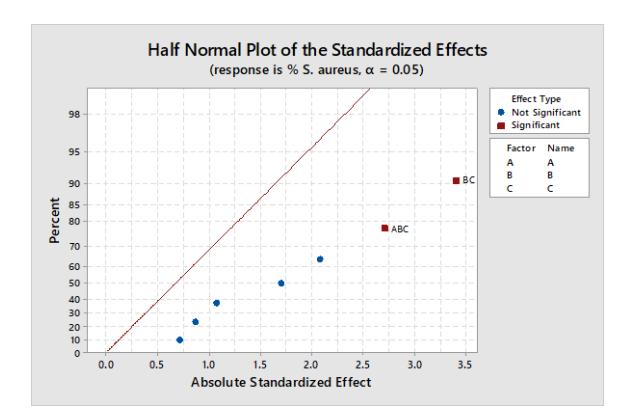
These values, shown in Figure 4, represent the average results from three experimental replications, with standard deviations included to account for variability. This detailed presentation underscores the reliability of the data while also highlighting areas where further optimization may be necessary. Figure 4 presents the optimization results for the disinfection of Escherichia coli and Staphylococcus aureus using the MB/UL system, as determined by the response optimizer analysis in Minitab 19.0. The graph illustrates the relationship between the experimental parameters (UL duration time, MB duration time, and air flow rate) and disinfection efficacy. The individual dots represent the observed disinfection rates from each experimental trial, with each dot corresponding to a specific combination of these parameters. The horizontal line serves as a reference point, indicating the target disinfection rate of 100% inhibition, allowing for a clear comparison between the target efficacy and the actual outcomes achieved under various experimental conditions. The percentage inhibition results for both E. coli and S. aureus, based on treatments with DI water as control, are presented and compared in Figure 5.
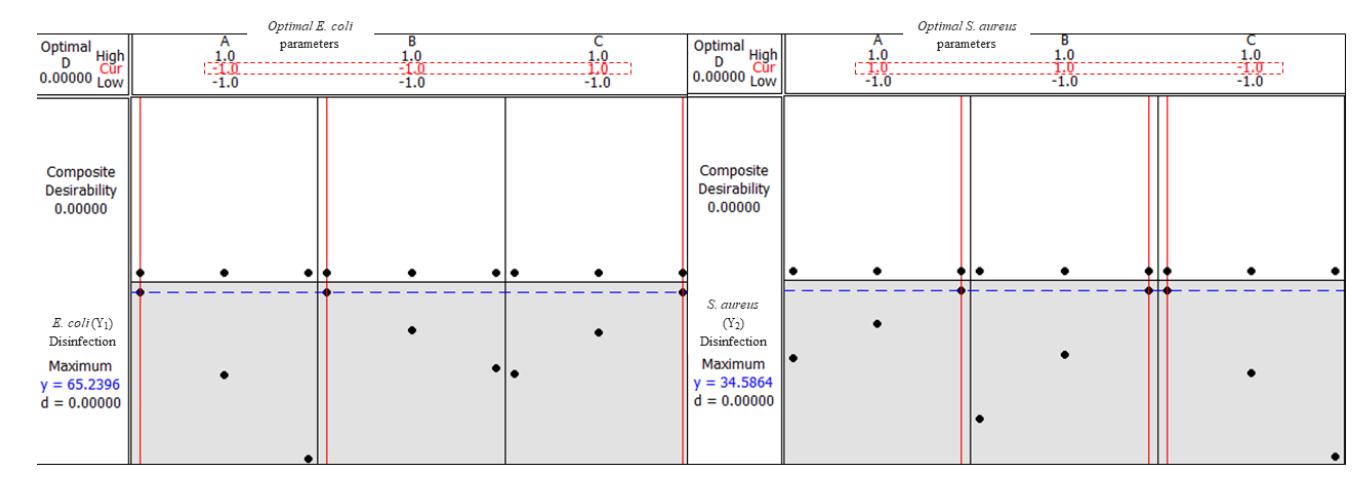
Graph showing the MB/UL optimal parameters: UL duration time (30 s), MB duration time (30 s), and air flow rate (30 ml/min) for E. coli (left). UL duration time (60 s), MB duration time (60 s), and air flow rate (15 ml/min) for S. aureus (right), relative to control group.
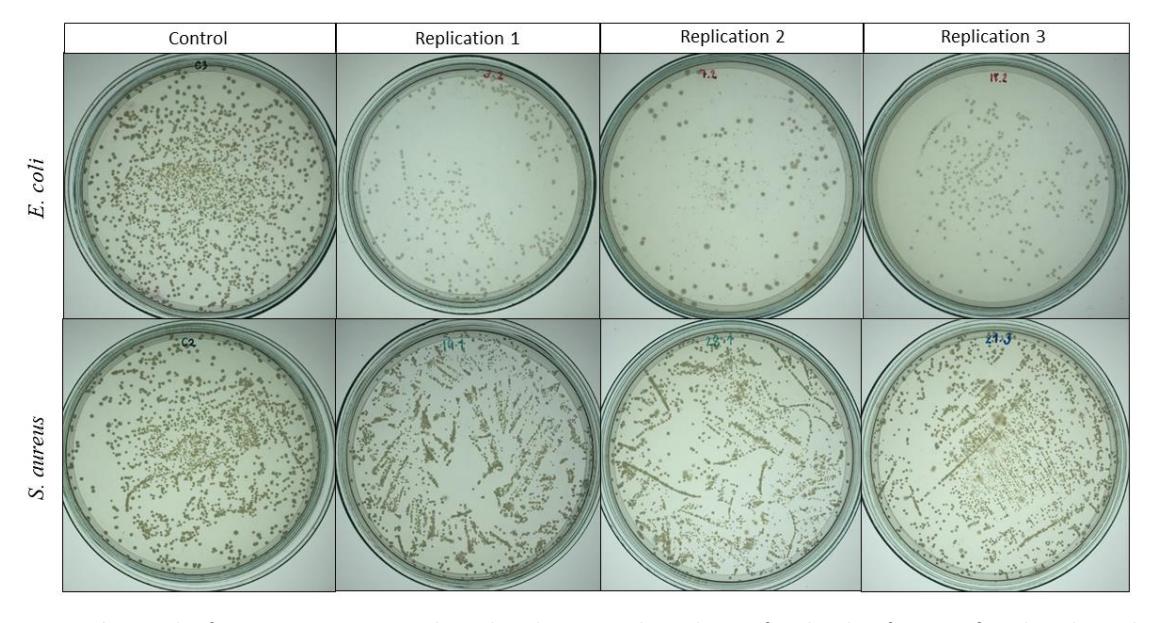
The results from experiments conducted under optimal conditions for the disinfection of Escherichia coli and Staphylococcus aureus using the MB/UL system. Each image corresponds to a plate prepared from the same dilution series following treatment under these optimized conditions. The plates show the bacterial colonies that remained after the disinfection process.
Water-dissolved microbubbles (MBs) not only exhibit a disinfection effect on microorganisms when utilized alongside ultrasonic waves but also demonstrate enhanced efficiency due to the cavitation phenomenon [20-22]. Based on the results obtained through the response optimizer function calculated by equations 1 and 2, the MB/UL technique showcased promising inhibition percentages for both Escherichia coli and Staphylococcus aureus. Optimal conditions for inhibiting E. coli were determined to be a UL duration time of 30 seconds, an MB duration time of 30 seconds, and an air flow rate of 30 ml/min, while for S. aureus inhibition, the optimal conditions were a UL duration time of 60 seconds, an MB duration time of 60 seconds, and an air flow rate of 15 ml/min, all with a 95% confidence interval. Table 3 presents the statistical results indicating the significant main effects of UL, MB time, and gas flow rate on the disinfection efficiency. The absolute values of these effects were assessed with respect to a p-value reference, revealing that each parameter exhibited low reliability, at α = 0.05. Although the remaining variables and interactions (A, B, C, AB,
AC, BC, and ABC) demonstrated effects below the p-value reference, they still showed potential importance, suggesting that disinfection efficiency was impacted by all parameters.
Discussion
Comparison of the UL/MB combination treatment in the interaction results revealed significant three-way interactions between UL, MB time, and gas flow rate, indicating the disinfection potential of the MB and UL combination for both E. coli and S. aureus. Microbial infection serves as the primary motivation for post-harvest MB/UL disinfection. In Thailand, the widespread use of natural fertilizers in cultivation renders outbreaks of foodborne diseases likely in the presence of microbes such as S. aureus and E. coli on product surfaces. UL technology is an effective disinfection method that has found success in various fields [23,24]. The inactivation of pathogens by ultrasound is primarily attributed to cavitation, which causes the formation and collapse of bubbles, resulting in higher temperature and pressure in solutions [6]. Therefore, the MB technique was employed to increase the density of tiny bubbles [25-28].
Scheme representing the effectiveness of the combination of MB and UL technologies. UL wave induces intracellular cavitation bubbles mixed with high-concentrate MB produced by depressurized pump. The collapse of these bubbles generates the energy that is responsible for killing bacteria.
As depicted in Table 3, cavitation phenomena increased significantly due to the duration time and gas flow rate of the MBs. MBs induced stronger cavitation than UL waves alone. When UL waves travel through a liquid medium (in this study, an MB solution), they produce compression and rarefaction forces with periodic changes. Cavitation bubbles form during periodic cycles because of UL waves traveling through the liquid. UL waves combined with MBs generated from a pump result in cavity formation within a much shorter time duration [29,30], as illustrated in Figure 6. The entire process of bubble formation, growth, and collapse is referred to as UL cavitation. During this process, the temperature and pressure inside the bubble increase significantly, reaching above 5,000 K and 1,000 atm, respectively, leading to the emission of bright light known as sonoluminescence [31].
The phenomena can generate significant energy, such as extreme heating, high-speed jets, and strong shock waves, which may cause damage to cell walls and cytoplasmic membranes [32]. In addition to physical damage, another mechanism of inactivation involves the production of free radicals, such as reactive oxygen species (ROS), resulting from bubble explosion; these radicals penetrate the cell and interact with internal components, leading to cell destruction [33]. The utilization of the MB/UL technique, owing to the cavitation effect, has demonstrated considerable potential for bacteria control [34,35]. As a non-thermal disinfection technology, MB/UL treatment has garnered increased attention from researchers [36,37], particularly in the post-harvest storage of fruits and vegetables. Studies have explored MB/UL treatment of product surfaces [38] to reduce microbial concentration. However, the specific conditions for MB/UL treatment may vary in practical applications. Escherichia coli and Staphylococcus aureus were chosen as representative gram-negative and gram-positive bacteria, respectively. More effective inactivation results were observed for E. coli compared to S. aureus, reflecting the differing biological characteristics of gram-positive and gramnegative bacteria [39]. In this study, the difference was attributed to the thicker cell membrane with a single
peptidoglycan layer in gram-positive bacteria, resulting in less damage to the S. aureus cell wall from bubble explosion and ROS inactivation mechanisms. Consistent with the experimental findings, the total percentage inhibition of E. coli and S. aureus was 54% and 19%, respectively, under optimal conditions determined by the Design of Experiment method.
In addition to optimizing the overall disinfection process, the response optimizer model provided valuable insights into the individual effects of each parameter (UL duration time, MB duration time, and air flow rate) on disinfection efficacy.
- 1. UL duration time The model indicated that increasing the UL duration time generally enhances the disinfection efficacy for both Escherichia coli and Staphylococcus aureus. This is likely due to prolonged exposure to ultrasonic waves, which intensifies cavitation and the associated physical forces that disrupt bacterial cells.
- 2. MB duration Time Similarly, a longer MB duration time was predicted to positively influence the disinfection process. Extended MB duration likely increases the density of microbubbles in the solution, thereby enhancing cavitation effects when combined with UL waves. The model suggests that this parameter is particularly significant for achieving higher disinfection rates in E. coli.
- 3. Air flow rate The air flow rate was found to have a nuanced impact on disinfection efficacy. While an optimal air flow rate enhances the generation of microbubbles, thereby improving cavitation, the model predicted that beyond a certain point, further increases in air flow rate may not significantly contribute to additional disinfection efficacy. This suggests that there is an optimal air flow rate that maximizes cavitation without diminishing returns.
Overall, the model highlights the importance of balancing these parameters to achieve maximum disinfection efficacy. Each parameter contributes uniquely to the process and their combined effects are essential for optimizing the MB/UL system's performance. In this investigation, the application of MBs alongside UL technology was proven to be an effective method for microbial decontamination. While the experimental results suggest that the combined MB/UL treatment is promising for microbial reduction, it is important to note that the specific cavitation phenomena were not directly observed in this study.
The optimal parameters and predictive model were developed using the Design of Experiment method. The log reductions achieved for Escherichia coli and Staphylococcus aureus were 4.74-Log and 4.3-Log, respectively, constrained by system setting limitations. The percentage inhibition of E. coli was only achievable under conditions of a UL duration time of 30 seconds, an MB duration time of 30 seconds, and an air flow rate of 30 ml/min (with a 95% confidence interval). Similarly, for S. aureus, the percentage inhibition was attainable only under conditions of a UL duration time of 60 seconds, an MB duration time of 60 seconds, and an air flow rate of 15 ml/min (with a 95% confidence interval).
The response optimizer model predicted that certain individual parameters, such as UL duration time, MB duration time, and air flow rate, would have significant impacts on bacterial inactivation, while other parameters or their combinations were predicted to have non-significant effects. To validate these predictions, we conducted experiments to measure the actual bacterial inactivation under various parameter settings. The response optimizer model predicted the most effective inactivation of Escherichia coli and Staphylococcus aureus within the selected boundary conditions. However, even under these optimal conditions, the model predicted less than 100% inactivation. This outcome suggests that both the limitations of the model and the selected boundary parameters play a role in the observed results. The model is based on experimental data within the defined range of parameters, including UL duration time, MB duration time, and air flow rate. While the model effectively identifies conditions that maximize inactivation within these boundaries, it may not account for all possible variables influencing microbial survival, such as the inherent resistance of different bacterial species or other environmental factors that were not included in the experimental design. The inability to predict 100% inactivation may be attributed to the model's reliance on empirical data and its focus on the selected factors, which may not fully capture the complexity of microbial inactivation processes.
The experimental results generally supported the model's predictions. For instance, both UL duration time and MB duration time exhibited a significant impact on bacterial inactivation, with longer durations leading to higher inactivation rates, particularly for Escherichia coli. These results align with the model's predictions and underscore the importance of these parameters in optimizing the disinfection process. However, the model also identified certain individual parameters and combinations as having a non-significant impact on bacterial inactivation. The experimental results confirmed these predictions, showing minimal changes in bacterial inactivation when varying these nonsignificant parameters within the tested range. For example, certain combinations of MB duration time and air flow rate did not result in significant changes in the inactivation rates of Staphylococcus aureus, indicating that these parameters, when not optimized, contribute less to the overall disinfection efficacy.
In future studies, the combined MB/UL treatment technique could be applied to plasma discharge in water to enhance microbial sterilization efficiency. However, further investigation is necessary to implement this technology across various types of food products on an industrial scale.
Conclusions
This study investigated the effectiveness of the MB/UL system in reducing the bacterial populations of Escherichia coli and Staphylococcus aureus under various experimental conditions. The response optimizer analysis in Minitab 19.0 was used to determine the optimal parameters for maximizing disinfection efficacy. The results demonstrated that under optimal conditions, the MB/UL system achieved a significant reduction in E. coli (54% reduction corresponding to a 4.74 log reduction) and S. aureus (19% reduction corresponding to a 4.3-log reduction). These findings suggest that while the MB/UL system is effective in reducing bacterial concentrations, it does not achieve complete inactivation under the tested conditions.
The study also highlighted the limitations of the current model and experimental design, particularly in predicting 100% inactivation of both microorganisms. The results indicate that further refinement of the model and exploration of additional parameters may be necessary to approach complete microbial inactivation. Although the mechanisms underlying the disinfection process, such as cavitation phenomena, were not directly observed or studied in this work, they are likely influenced by factors such as ultrasonic intensity, microbubble generation, and bacterial species-specific resistance.
Future research should focus on expanding the range of experimental parameters and directly studying the specific mechanisms of disinfection, including cavitation effects, to enhance the predictive accuracy of the model and potentially achieve complete inactivation. Understanding the exact mechanisms by which the MB/UL system affects bacterial cells could lead to more effective disinfection strategies in practical applications.
Acknowledgements
Financial support was provided by Fundamental Fund 2023, Chiang Mai University. The Department of Industrial Engineering, Faculty of Engineering and the Department of Physics and Materials Science, Faculty of Science, Chiang Mai University provided the examination equipment. We are thankful for their assistance and support in this research. The editor would like to thank the two anonymous reviewers for their comprehensive comments, which helped improve the quality of this manuscript.
Compliance with ethics guidelines
The authors declare that they have no conflict of interest or financial conflicts to disclose.
This article does not contain any studies with human or animal subjects performed by any of the authors.