
Introduction
Pyrolysis has been proven to be an effective method for transforming biomass waste into valuable products. The resulting pyrolysis products typically include bio-char, bio-oil, and syngas [1]. Bio-char is usually used as a substitute for fossil fuels and even as an absorbent material for battery components, supercapacitors, and catalysts [1, 2]. Bio-oil serves various purposes, including its use as fuel, in cosmetics, and as fertilizer. On the other hand, the utilization of syngas remains relatively limited, primarily due to a lack of widespread knowledge and education on its applications.
Syngas is generated through the primary decomposition of biomass and the secondary cracking of steam at elevated temperatures. This process results in a mixture of both primary and secondary gases. Syngas comprises flammable alkanes and alkenes, making it suitable for use as an alternative fuel [3]. The heat of combustion generated by syngas from the pyrolysis of biomass containing cellulose and hemicellulose is lower than that from the pyrolysis of biomass containing lignin. This difference can be attributed to the fact that the main decomposition product of cellulose and hemicellulose is CO2, whereas lignin primarily yields H2 and CH4 during the pyrolysis process [3]. Syngas generated from biomass pyrolysis exhibits a substantial lower heating value (LHV) of 13 MJ/kg, making it well-suited for combustion processes. This characteristic presents a significant opportunity for utilization, particularly in Indonesia, where there is abundant lignin-containing biomass, for example from coffee waste, which can serve as a viable fuel source [4].
In 2023, it was reported that Indonesia's coffee production had increased by 24% to 12 million bags [5]. This production encompasses the output from various sources, including large state plantations, large private plantations, and smallholder plantations [6]. Specifically in Aceh, the annual coffee production continues to show an upward trend, leading to a significant generation of coffee waste. The breakdown of this agricultural by-product indicates that 43% of the waste is coffee pulp, 6% is coffee grounds waste, and 12% is coffee slime. This emphasizes the substantial impact of
coffee production on waste generation in the region [7]. Based on this data, coffee pulp waste contributes the largest portion that needs to be managed and utilized to avoid environmental problems.
The limited utilization of coffee pulp waste poses potential problems, including environmental damage and potential health risks. Coffee pulp waste contains carcinogenic compounds that, if left unmanaged, could lead to environmental concerns and pose risks to human health [8]. Therefore, taking concrete steps to utilize coffee pulp waste is crucial to prevent it from being wasted and as well as to create added value for society.
One concrete step that can be taken is to utilize coffee pulp waste as fuel. Coffee pulp contains 12% hemicellulose, 42% cellulose, and 2% lignin [9]. This residue contains 10.54% moisture, 16.98% ash, 55.58% volatile matter, and 16.9% fixed carbon [8]. These components indicate that the carbon content in coffee pulp has the potential to be used as fuel or for energy storage. There has been quite a lot of research on the use of coffee waste, for example [10] reported that carbonized coffee pulp made into briquettes was able to produce bio-char products with a calorific value of 19,519 J/g.
A similar endeavor was undertaken in [11]; the coffee pulp bio-char processed by pyrolysis was capable of producing a product with a calorific value of 21,918 J/g. Then there are also those who used bio-oil products, namely [12], which showed that the calorific value of bio-oil is 40,997 J/g. Meanwhile, to the best of our knowledge, the use of syngas is still very limited in previous research. Usually, the syngas produced is not used directly but is stored and some is thrown away [13]. In fact, the use of syngas has the potential to reduce the residence time required for pyrolysis and offers the advantage of saving on LPG fuel consumption. Additionally, the diminishing availability of petroleum, the primary source for LPG production, highlights the importance of exploring alternative energy sources.
The decrease in petroleum availability from 7.53 billion barrels in 2016 to 3.95 billion barrels in 2020 underscores the need for sustainable and efficient energy solutions like the use of syngas [14]. Hence, this research conducted the pyrolysis of coffee pulp waste, utilizing syngas products as co-firing fuel with LPG, alongside pyrolysis using LPG as the sole heat source. The objective was to evaluate the performance of a pilot-scale pyrolysis reactor, specifically when the syngas generated during pyrolysis is introduced into the furnace as supplementary fuel.
Materials and Methods
Materials
This study used Gayo Arabica coffee pulp obtained from a plantation in Bener Meriah Regency, Aceh Province, Indonesia. Initially, the feedstock was rinsed with tap water for three times and then soaked for 20 hours. This process is aimed at removing dirt attached to the feedstock as well as minimizing the ash content before the pyrolysis process. The coffee pulp was then dried under the sun three to four days. About one kilogram of dried feedstock was placed in a reactor to undergo pyrolysis. A pilot-scale pyrolysis reactor was used as illustrated in Figure 1.
Nitrogen was employed as an inert gas during the pyrolysis process at a flow rate of 1 L/min. Two kinds of experiments were performed in this study. The first one involved a pyrolysis experiment with syngas as co-firing fuel alongside LPG. The second type of experiment entailed pyrolysis solely employing LPG gas as fuel. For sample preparation and proximate analysis, this investigation used an oven, muffle furnace, heat resistant crucible, mortar and pestle, sieve and digital scale.
The pyrolysis experiment was set at a maximum temperature of 420 °C. This was defined based on the information summarized in the literature, where within the range of 400°C to 450°C the maximum biochar and syngas yields can be achieved [15]. This lower temperature aids in reducing the operational cost without any significant reduction in biochar yield and quality. The temperature of pyrolysis was held by adjusting the gas burner regulator as well as keeping the pressure of the process constant. During the experiment, the changes in temperature and pressure were automatically logged on a computer. The process was stopped when no more pressure was observed from the reactor. The burner was then turned off, allowing the rector to cool down. Once the reactor temperature had reached ambient condition, the reactor was opened to collect and quantify the biochar and the bio-oil products carefully.
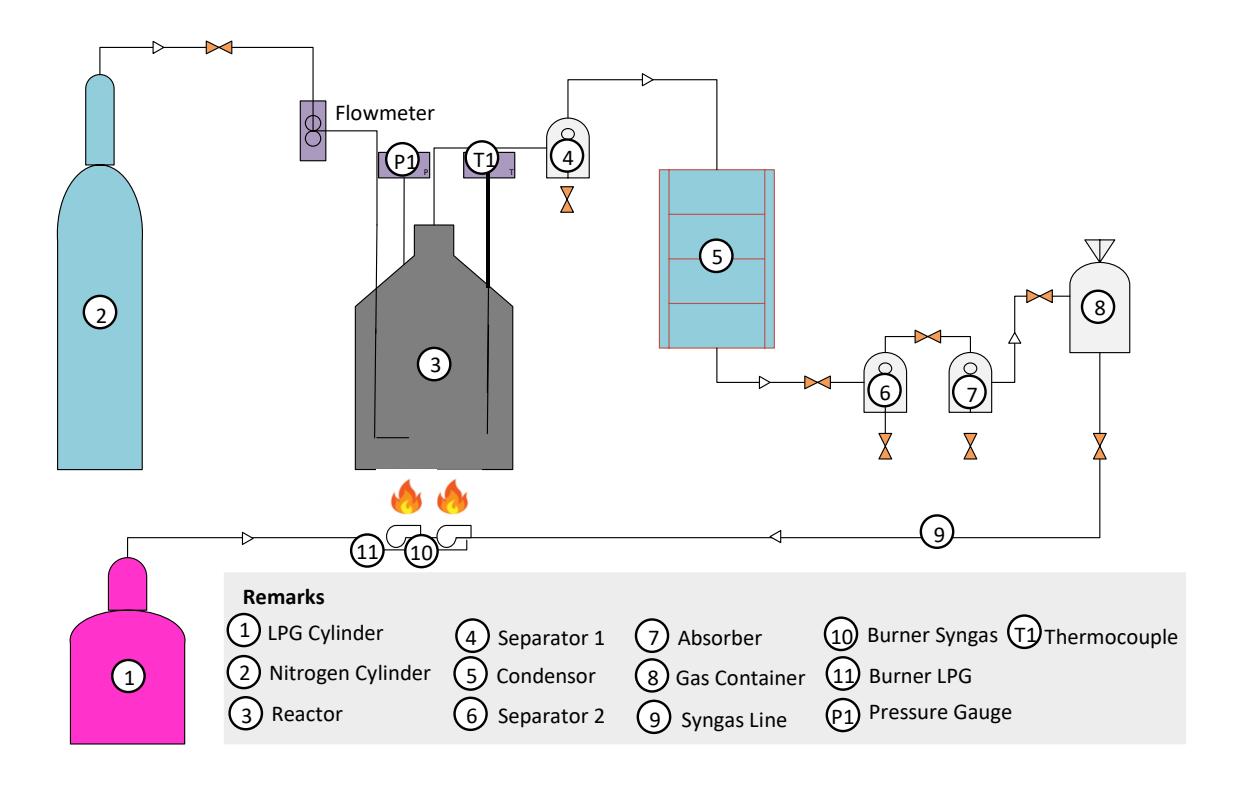
Set-up of coffee pulp pyrolysis experiment.
Characterization of Coffee Pulp Bio-char
In order to comprehend the thermophysical properties of the samples pyrolyzed with LPG co-firing and those without co-firing, various analyses were conducted, i.e., proximate analysis, thermogravimetry, calorimetry, and FTIR analysis. Proximate analysis, aimed to determine water, ash, volatile matter, and fixed carbon contents, was executed in accordance with the procedures outlined in ASTM D1762-84, as described in [16]. Thermogravimetric analysis (TGA) was performed using a Shimadzu DTG-60 instrument, with nitrogen flowing at varying rates in each test process specifically: 20 mL/min for the pyrolysis samples without co-firing and 30 mL/min for the pyrolysis samples with cofiring. The heating rate for each sample was set at 40 °C/min and all samples were placed in an alumina crucible and heated to 600 °C. For the analysis of the calorific value of the coffee pulp bio-char, a Bomb Calorimeter IKA-C 2000 instrument was employed. To identify functional groups on the sample surface, FTIR spectroscopy was conducted using a Shimadzu IR Prestige 21 instrument. This test covered a wavelength range of 500-4,000 cm⁻¹ with a resolution of 41 cm⁻¹ and 45 scanners.
Results and Discussion
Temperature Profile of Reactor Pyrolysis
This experiment can be classified as slow pyrolysis at a maximum temperature of 420 °C, since the heating rate was below 10 °C/min [17]. This research used a heating rate of 2.0 °C/min during pyrolysis with co-firing and 1.6 °C/min in pyrolysis without co-firing. This difference in heating rate slightly affected the product yield. Pyrolysis with co-firing produced 34.5% biochar, while pyrolysis without co-firing produced 33% biochar. This is because the pyrolysis process took place at a temperature of 400-500 °C and if the heating rate is increased, the amount of biochar produced will also increase. Reference [18] showed that pyrolysis at a temperature of 475 °C with a heating rate of 5 °C/min produced 35% biochar. The difference in heating rate in the two pyrolysis processes in this study was due to the different heat sources. The co-firing process used two sources of heat: LPG as the main source heat and syngas as an auxiliary heat source. This was aimed to save LPG usage. This strategy was used when the syngas product was available. Based on our calculation, the ratio of LPG to syngas fired during the process was 1.5:1. The inclusion of syngas as a heat source in pyrolysis impacts the time required to reach the desired temperature. Meanwhile, in the pyrolysis process without cofiring, the heat was sourced exclusively from LPG fuel.
The time needed for the pyrolysis reactor in the two process variations to attain a temperature of 100 °C differed, albeit not significantly. Pyrolysis with co-firing achieved this in the 12th minute, while pyrolysis without co-firing took until the 15th minute. The marginal difference is attributed to both processes utilizing LPG as the primary heat energy source. The temperature range of 100-150 °C falls within the dehydration stage of the raw materials, where the water content in the coffee pulp decreases linearly with increasing processing time. During this phase, the rate of dehydration is influenced by external mass exchange with the surrounding gas medium, resulting in evaporation up to a temperature of 400 °C. Once the water content reaches a critical level, the rate of dehydration diminishes, transitioning to the devolatilization stage.
Primary pyrolysis, also known as devolatilization, is a complex transformation process that yields syngas, bio-oil, and solid residue (charcoal) products [19]. The raw material heated in the reactor is influenced by its constituent components, namely hemicellulose, cellulose, and lignin. It has been observed that hemicellulose decomposes at a temperature range of 250-400 °C, cellulose at 310-430 °C, and lignin at 300-530 °C [20]. The research findings indicate a significant difference in the time required for the two process variations to reach the pyrolysis stage. In the case of pyrolysis without co-firing, a temperature of 420 °C was reached at the 86th minute, whereas pyrolysis with co-firing achieved this at the 55th minute. The presence of co-firing led to a quicker attainment of the desired temperature, attributed to the influence of the heat source generated from pyrolysis in the form of syngas. It is recognized that the flame generated from syngas is blue, indicating maximum heat. Thus, the LPG regulator valve can be adjusted accordingly. The role of the regulator valve is to minimize the consumption of LPG. Figure 2 illustrates the temperature profile of pyrolysis without co-firing (PNC) and pyrolysis with co-firing (PWC).
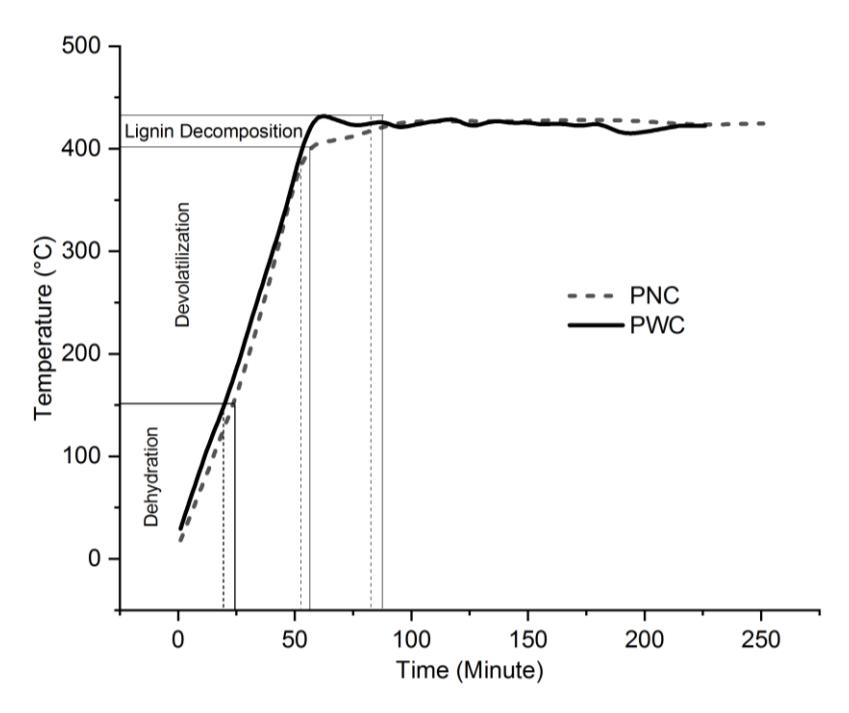
Temperature profile pyrolysis of coffee pulp.
The pyrolysis process without co-firing required more time compared to pyrolysis with co-firing, specifically 251 minutes versus 221 minutes. This difference arises from the fact that the heat in the pyrolysis reactor without co-firing is solely derived from one fuel source, namely LPG, resulting in lower heat production compared to pyrolysis with co-firing. Pyrolysis is considered complete when the temperature and the pressure in the reactor cease to increase. According to previous study [13], a drastic decrease in pyrolysis temperature or the absence of a further increase indicates the completion of the pyrolysis process, indicating the decomposition of coffee pulp within the pyrolysis reactor.
Pyrolysis Process and Product Evaluation
The pyrolysis process, both with co-firing and without co-firing, was conducted while considering several parameters, i.e., fuel consumption, pyrolysis time, and temperature. These parameters yielded varying values in each test, with the exception of the pyrolysis temperature, which was consistently set at 420 °C. Further details can be found in Table 1.
| Parameter | Unit | Pyrolysis without syngas co-firing (PNC) | Pyrolysis with syngas co-firing (PWC) | |
|---|---|---|---|---|
| A. | Process | |||
| - Fuel consumption | kg LPG/kg raw material | 3.46 | 2.44 | |
| - Pyrolysis time | minute | 251 | 226 | |
| - Temperature | °C | 420 | 420 | |
| B. | Product Distribution | |||
| - Bio-char | % | 33 | 35 | |
| - Bio-oil | % | 24 | 25 | |
| - Uncondensable gas | % | 43 | 40 | |
| C. | Physical and Thermal Properties of Bio-char | |||
| - Calorific value | J/g | 20302 | 26855 | |
| - Moisture | % | 4.17 ± 1.16 | 2.42 ± 0.52 | |
| - Ash | % | 12.99 ± 0.26 | 9.50 ± 0.33 | |
| - Volatile matter | % | 28.59 ± 1.65 | 33.02 ± 2.01 | |
| - Fixed carbon | % | 53.64 ± 1.88 | 54.35 ± 2.18 |
Table 1 Pyrolysis experiment results with and without the use of syngas.
Assessing the LPG fuel consumption per kilogram of raw material, it is interesting to know that pyrolysis without cofiring required more fuel compared to pyrolysis with co-firing specifically, at 3.46 kg and 2.44 kg, respectively. This distinction arose because the heat source for pyrolysis without co-firing was solely LPG, whereas pyrolysis with co-firing benefitted from additional syngas fuel. As a result, the pyrolysis process without co-firing took a longer duration and required more fuel. In the testing process of pyrolysis without co-firing, the LPG valve was fully opened to maximize heat generation, unlike in pyrolysis with co-firing. The LPG valve was opened 12 times during testing, at 24, 26, 32, 36, 42, 45, 46, 47, 49, 51, 56, and 58 minutes, coinciding with the collection of syngas in the gas reservoir. The test outcomes also indicated that pyrolysis with co-firing influenced the distribution of the resulting products.
Analyzing the product distribution, variations were observed in each experiment. The quantity of pyrolysis bio-char produced without co-firing was 33%, while pyrolysis with co-firing yielded 35% bio-char. This disparity is attributed to the extended pyrolysis time in the case of pyrolysis without co-firing, leading to a more thorough decomposition of the raw material. This aligns with the information conveyed in [21] that the duration of the pyrolysis process impacts the yield of bio-char, with a longer pyrolysis time resulting in lower bio-char production. Additionally, the bio-oil pyrolysis product without co-firing was 24%, while with co-firing, it was 25%. The difference in bio-oil production is attributed to excessive secondary reactions at longer pyrolysis times, leading to a reduction in the rate of lignin degradation into hydrocarbon bonds and ultimately a decrease in the bio-oil amount. Regarding syngas products in pyrolysis without cofiring, their presence was mostly due to the influence of secondary decomposition of condensed pyrolytic volatiles. This aligns with prior research [22] that observed an increase in the amount of syngas from 36.46% to 38.93% within the 60- 120 minutes range.
It is also important to note that the characteristics of the coffee pulp influence the product distribution. The more volatile matter contained in the raw material, the greater the distribution of bio-oil products. During the pyrolysis process, most of the volatile matter is decomposed and then condensed leading to produce more bio-oil product. As reported in the literature and compared to this research result, pyrolysis products at a temperature of 400-500 °C using coffee pulp and acacia skin as raw materials, with volatile matter levels of 60% and 50% respectively, produced more acacia bio-oil products than coffee pulp, i.e., 34 % and 25% [18]. On the other hand, when the fixed carbon content is higher, the yield of biochar products will also be higher. Meanwhile, the water content influences the heat transfer process, which determines how fast or slow the pyrolysis process goes.
In addition to affecting the product distribution, the utilization of syngas for co-firing influences the physical and thermal properties of the bio-char product. As depicted in Table 1, the proximate test results of the bio-char from pyrolysis with co-firing indicated a reduction in water content and ash content, while the volatile matter content experienced a slight
increase, although not a significant one. This is attributed to the longer residence time in the pyrolysis process with cofiring, leading to the production of more volatile matter, increasing from 28.59% to 33.02%. These outcomes align with findings from previous research [23], where pyrolysis using branch raw materials at a temperature of 450 °C with varying residence times of 50 and 60 minutes demonstrated that the volatile matter value with a residence time of 60 minutes was higher than that with a residence time of 50 minutes, with values of 53.49% and 52%, respectively. This led to a higher fixed carbon value with co-firing compared to pyrolysis without co-firing, with respective values of 53.64% and 54.35%. A higher fixed carbon content has a positive impact on the calorific value. The calorific value of bio-char products with co-firing significantly increased, from 20,302 J/g to 26,855 J/g. This enhancement is attributed to the prolonged residence time in the pyrolysis process and the more optimal heat production. Thus, pyrolysis using co-firing emerges as the most suitable condition for elevating the calorific value of coffee pulp raw materials.
Thermogravimetric Analysis
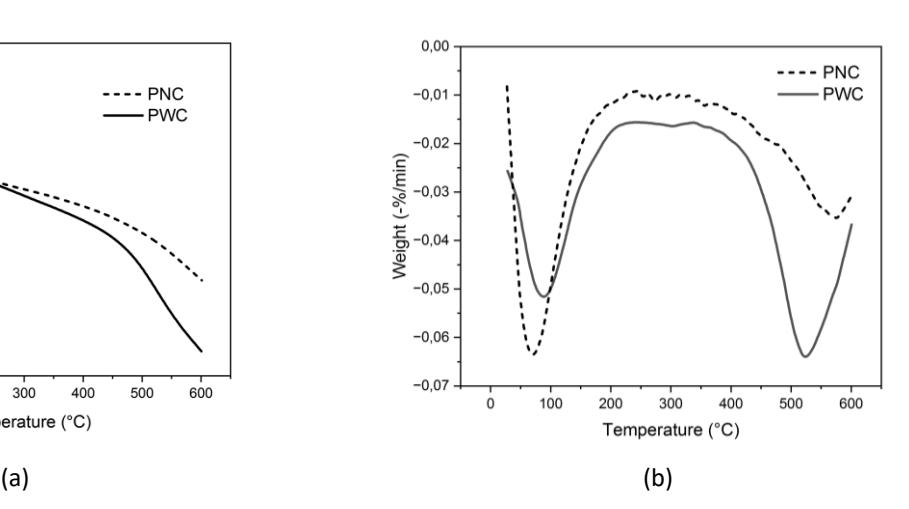
Thermogravimetric analysis is a method that is beneficial for comprehending the reactions that take place during thermochemical processes [24]. Figure 3 displays the thermogravimetric (TG) and derivative thermogravimetric (DTG) profiles of the biochar products from the PNC and PWC experiments. The TG and DTG plots illustrate a notable weight loss of the samples during heating in nitrogen. Although the decrease was not substantial, the PWC biochar experienced a mass loss of 18%, while the PNC biochar underwent a mass loss of 13%. The higher mass loss in the PWC biochar is attributed to the higher volatile matter content compared to that in the PNC biochar, as indicated in Table 1. It is important to note that during this analysis, for the PWC biochar, a nitrogen flow rate of 30 mL/min was set, while the PNC sample was purged with N2 at a flow rate of 20 mL/min. As reported in previous research [25,26], the greater the flow rate employed during TG analysis, the higher the mass loss in a sample.
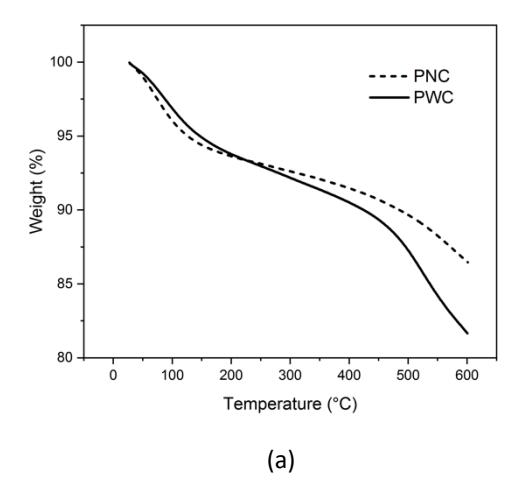
TG (a) and DTG (b) profiles of biochar produced without syngas co-firing (PNC) and with syngas co-firing (PWC).
The graph shows in detail that the mass composition occurs in three stages, i.e., dehydration, devolatilization and lignin decomposition [27]. During the dehydration phase, a loss up to 5% in sample mass occurred between room temperature and 144 °C in the PWC biochar and 112 °C in the PNC biochar. This decline is attributed to the release of water molecules trapped in the biomass pores, along with the expulsion of some lightweight substances. This aligns with the water content data presented in Table 1 and Figure 2. The subsequent stage of coffee pulp decomposition transpires within the temperature range of 144 °C in the PWC samples and 112 °C in the PNC samples, extending to 400 °C, resulting in a reduction in mass of almost 5%. This reduction is primarily attributed to the devolatilization process involving volatile materials. Devolatilization in coffee pulp encompasses the release of carbohydrates, lipids, various proteins, and lignin [28]. Subsequently, the third stage unfolds, extending up to a temperature of 600 °C. During this phase, there is no significant loss of material through combustion. Instead, the dominant processes involve the degradation of lignin and various inorganic compounds, referred to as carbon solids [29].
The DTG curve of the biochar reveals two significant peaks representing the points of maximum decomposition. The initial peak at 262 °C corresponds to the decomposition of hemicellulose in the biomass. The second peak, appearing at 338 °C, is primarily attributed to the breakdown of cellulose components in the biomass. The absence of a distinct peak in the third phase suggests that the decomposition of the lignin component was relatively slow and did not contribute
significantly to the graph. Consequently, it can be inferred that a temperature range of 400-500 °C is highly effective for the carbonization process of coffee pulp, as there is minimal loss of sample during this phase.
FTIR Spectra
FTIR analysis serves as a method for identifying and quantifying the number of functional groups associated with specific compounds present in raw materials [30]. Figure 4 shows the FTIR spectra of the biochar pyrolyzed at 420 °C with cofiring (PWC) and without co-firing (PNC). The results indicate that the FTIR spectral patterns of the two samples were identical, with variations observed only in the transmittance intensity values and shifts in the wave number region. However, these shifts remain within the same functional group wave number range. This similarity is attributed to both samples originating from the same raw material, namely coffee pulp. Generally, coffee pulp consists of consistent compounds such as water, caffeine, protein, amino acids, tyrosine, and carbohydrates [28].
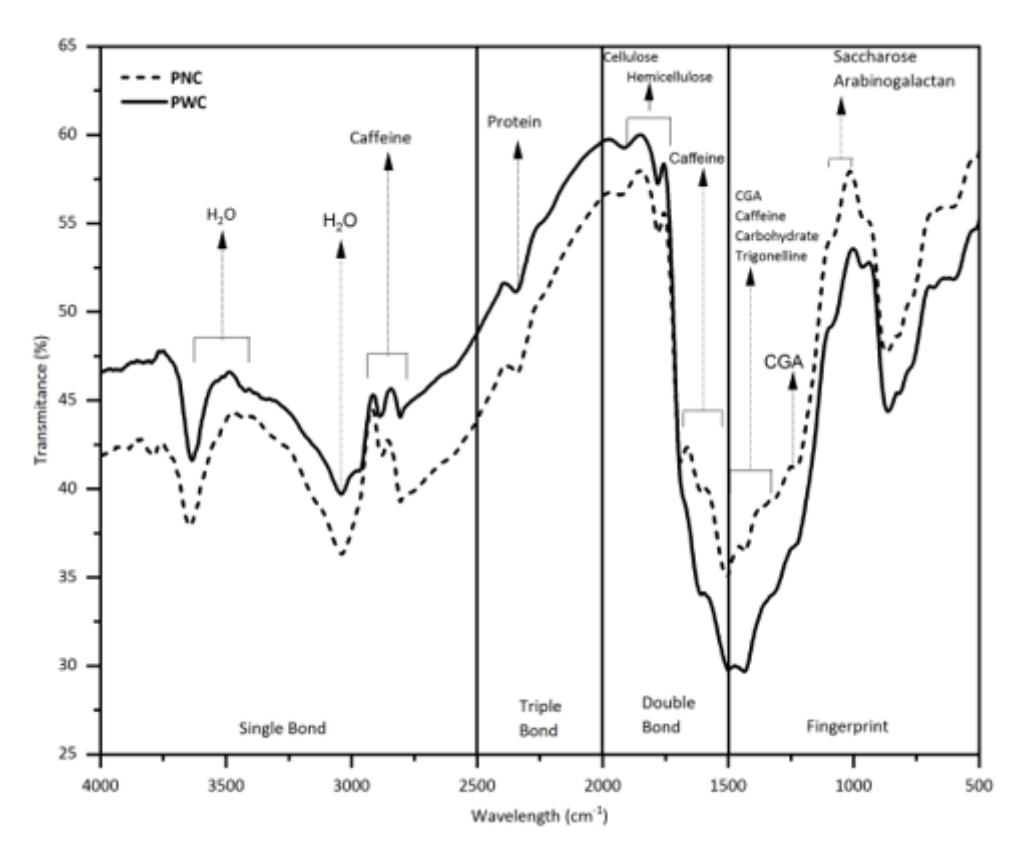
Figure 4 FTIR spectra of coffee pulp bio-char pyrolysis without co-firing and pyrolysis with co-firing.
The test results reveal considerable variation in the spectrum of the coffee pulp bio-char within each functional group range. Specifically, within the single bond range, three compounds exhibited distinct peak details. In the band range of 4,000-3,500 cm<sup>-1</sup>, peaks at wavelengths 3,635.82, 3,533.59, and 3,633.89 cm<sup>-1</sup> signify the presence of the H2O functional group in both the PWC and the PNC samples. Additionally, within the wavelength range of 3,500-3,000 cm<sup>-1</sup>, three peaks at wavelengths 3,037.89, 3,421.72, and 3,041.74 are also associated with water. This wavelength corresponds to what is conveyed by [31] that the H2O stretch band can be found at 3,490-3,280 cm<sup>-1</sup>. In the range of 3,000-2,500 cm<sup>-1</sup>, five peaks can be seen, at wavelengths of 2,877.79, 2,804.50, 2,970.38, 2,887.44, and 2,804.50 cm<sup>-1</sup>, all of which are associated with caffeine. This wavelength alignment is consistent with findings from previous research [32].
Moreover, within the triple bond wavelength range of 2,500-2,000 cm<sup>-1</sup>, two peaks are evident at wavelengths of 2,341.58 and 2,347.37 cm<sup>-1</sup>, indicating the presence of protein [33]. In the double bond category, three compounds are identified within the wavelength range of 2,000-1,750 cm<sup>-1</sup>. Three peaks, with wavelengths of 1,780.30, 1,915.3, and 1,780.30 cm<sup>-1</sup>, point to the presence of hemicellulose and cellulose. Caffeine concentration is reiterated in the wavelength range of 1,750-1,500 cm<sup>-1</sup>, with the addition of chlorogenic acid. Three peaks, specifically at 1,689.64, 1,606.70, and 1,606.70 cm<sup>-1</sup>, indicate this compound combination.
In the fingerprint region, which is divided into four wavelength ranges from 1,500-1,250 cm-1 , the presence of chlorogenic acid (CGA), trigonelline, caffeine, and carbohydrates were observed. These compounds are identified at specific wavelengths of 1,431.18, 1,323.17, 1,498.69, and 1,433.11 cm-1 , respectively [26,34]. Chlorogenic acid exhibits its highest excitation peak at a wavelength of 1240 cm-1 , indicating its inclusion in the wavelength range of 1,250-1,000 cm-1 [35]. The acid absorption capacity of the PWC and PNC coffee pulp treatments is comparable. It is noteworthy that within this range, saccharose and arabinogalactan were present, as indicated by previous research findings [36]. Lastly, within the wavelength range of 1,000-750 cm-1 and 750-500 cm-1 , five peaks were observed, with details at wavelengths of 871.82, 825.53, 864.11, 819.75, and 605.65 cm-1 . The increase in the concentration of -OH groups is evident, indicating the presence of more active groups available for blending between filler/matrix interfaces.
All processed coffee pulp samples showed changes in the content of most compounds. For instance, the heating process could lead to the degradation of carbohydrates, proteins, and chlorogenic acid. However, caffeine, with a wavelength of 3,000-2,500 cm⁻¹, remains present and cannot be removed even at a temperature of 420 °C. Therefore, this research indicates that caffeine is a robust compound in coffee pulp, demonstrating resilience even when subjected to heating up to 420 °C.
In addition, the FTIR analysis revealed that bio-char from pyrolysis with co-firing and pyrolysis without co-firing exhibits a high density of oxygen-based surface functional groups. This observation indicates a promising potential for using this bio-char as active carbon for energy storage. Previous research [37] has also suggested that the presence of oxygen in the sample enhances the adsorption capacity of phenolic compounds through oxidative coupling reactions.
Conclusions
Arabica coffee pulp waste underwent carbonization through a slow pyrolysis process to assess the performance of a pilot-scale pyrolysis reactor when syngas generated in the pyrolysis process was introduced as an additional fuel to the furnace. The study revealed that incorporating syngas as an extra fuel during pyrolysis could reduce LPG consumption from 3.46 to 2.44 kg LPG per kg of raw material, resulting in a shorter pyrolysis residence time. The bio-char product obtained exhibited a higher calorific value, i.e., 2,6855 J/g. This observation aligns with the increased fixed carbon content and decreased water content. Characterization through TG and FTIR analysis indicated that the produced biochar holds substantial potential as a raw material for activated carbon in supercapacitor application.
Acknowledgments
We acknowledge the Directorate of Research, Technology, and Community Service, Ministry of Education, Culture, Research, and Technology Republik Indonesia for their sponsorship under master thesis research scheme, contract no. 132/E5/PG.02.00.PL/2023, sub-contract number 16/UN45.2.1/PT.01.03/VI/2023.
Compliance with ethics guidelines
The authors declare that they have no conflict of interest or financial conflicts to disclose.
This article does not contain any studies with human or animal subjects performed by any of the authors.