
Introduction
The Southeast Asian region serves as a pathway for the occurrence of the Asian-Australian monsoon, particularly in the South China Sea (SCS) waters (Kemarau & Eboy, 2021a; Noor & Maulud, 2022). The climate of Malaysia is heavily influenced by the Australian monsoon, which serves as a major factor in shaping weather patterns in the region (Sa'adi et al., 2023). Despite existing research, further studies are required to investigate the impact of monsoon events on fisheries and chlorophyll-a distribution in Malaysia. The Asian-Australian monsoon system includes two primary events namely NEM and the SWM (Wirasatriya et al., 2021; Kemarau & Eboy, 2021b). While much of the current research on monsoon effects on chlorophyll-a distribution has concentrated on Indonesian waters (Rastriya et al., 2021; Welliken & Melmambessy, 2019; Lahlali et al., 2018), there remains a significant need for more focused studies within Malaysian waters to better understand how these monsoons influence local fisheries and chlorophyll-a patterns.
In the context of Malaysia, particularly in the waters of the SCS, there are contrasting findings from previous studies. Shaari & Mustapha (2017) reported high chlorophyll-a concentrations during the NEM, spreading along the east coast of Peninsular Malaysia in the SCS, specifically off the coast of Pahang and Johor states. Similarly, Mohammad Noor et al. (2012) observed high phytoplankton concentrations during the NEM (December) along the coast of Kuantan, Pahang. On the other hand, Yang et al. (2012) found high chlorophyll-a concentrations during the SWM season from June to September due to Ekman's pumping factor and strong wind pressure off the coast of Vietnam in the South China Sea. Syahrizan & Bachok (2018) discovered that phytoplankton micro-density and chlorophyll-a concentration began to increase before the NEM monsoon season, with peak phytoplankton and micro-chlorophyll concentrations occurring during the SWM season and varying in response to monsoon events. Sidik et al. (2008) reported high phytoplankton concentrations during the SWM, particularly from July to September.
The discrepancies in these findings led the current study to explore and evaluate the effect of NEM and SWM events on the dispersion and levels of chlorophyll-a in the waters of Sabah and Sarawak. This study is significant as it can provide insights into changes in the distribution of chlorophyll-a concentration in the waters of Sabah and Sarawak. Previous studies conducted by Welliken & Melmanbessy (2019) and Lahlali (2018) have established that chlorophyll-a concentration affects fish catches. Welliken & Melmanbessy (2019) reported a positive correlation between total mackerel catch and chlorophyll-a content. Furthermore, Welliken & Melmanbessy (2019) observed that the peak fishing activities in the Savu Sea coincide with the peak time of chlorophyll-a concentration, which occurs from August to September during the SWM. Lahlali et al. (2018) found that fishing activity increased with higher chlorophyll-a levels during the SWM. Understanding the distribution and variability of chlorophyll-a in a specific area is crucial for effective fisheries management. particularly along the eastern coast of Peninsular Malaysia, has yielded varied results. Some studies have observed elevated chlorophyll-a levels during the NEM, extending along the eastern coastline. In contrast, others found elevated levels during the SWM due to Ekman pumping and wind pressure off the coast of Vietnam. To address these discrepancies and evaluate the influence of NEM and SWM events on chlorophyll-a distribution, this study focuses on the waters of Sabah and Sarawak.
By utilizing MODIS Aqua data with a resolution of 4 km, this study aims to provide an overview of chlorophyll-a concentration variability in the year 2019. Through this analysis, we seek to gain insights into the changes in chlorophylla distribution during the monsoon cycle and examine how these changes influence fish catches both at sea and along the coast. This research builds upon previous studies that have indicated a relationship between chlorophyll-a content and fishery outcomes. The significance of this study lies in its potential to enhance our understanding of changes in chlorophyll-a distribution in the waters of Sabah and Sarawak. Previous research has demonstrated the impact of chlorophyll-a concentration on fish catches, highlighting a positive correlation between mackerel catches and chlorophyll-a content. Building on this foundation, we will investigate the peak fishing activities and the peak chlorophyll-a concentrations during the SWM in the Sabah and Sarawak waters. By conducting this research, we aim to provide valuable insights into the relationship between monsoon events, chlorophyll-a distribution, and fishery activities. The findings of this study will be crucial in shaping more effective fisheries management and conservation efforts in the region, reassuring the audience of the value of this research.
Methodology
Chlorophyll-a concentration data for the year 2019 were sourced from the NASA EARTH database, specifically curated by the National Aeronautics and Space Administration, and processed using the SeaDAS software. This study utilized data that were provided and maintained by the Ocean Biology Processing Group (OBPG) at NASA's Goddard Space Flight Center (https://oceancolor.gsfc.nasa.gov/data/use-data/). The OBPG is responsible for a range of tasks including data collection, processing, calibration, and validation of oceanographic surveys. They ensure the accuracy and reliability of data related to chlorophyll-a concentration, sea surface temperature, and sea surface salinity, which are gathered from both in-situ measurements and remote sensing satellites. These efforts, ongoing since 1996, offer valuable data to researchers and scientists. In this study, monthly chlorophyll-a concentration data from the MODIS satellite for the year 2019 were used. The data were processed and analyzed in the XY coordinate system GCS_WGS_1984. The first step involved sub-setting the data focusing on the study areas (the waters of Sarawak and Sabah) (Figure 1). This subset process was carried out using ArcGIS (version 10.8). Once the images were subset using ArcGIS, the next step involved extracting statistical values such as monthly mean, maximum, and minimum chlorophyll-a concentrations. Finally, a correlation analysis was conducted between MODIS's monthly chlorophyll-a concentration data and the ground data on total fish landing obtained from the Department of Fisheries Malaysia. By integrating satellite data with ground data, this study examines the relationship between chlorophyll levels and fishery activities in the study area. Advanced software and data processing techniques allow for a comprehensive analysis that can provide valuable insights into the dynamics of chlorophyll-a distribution and its impact on fish landing in Malaysia.
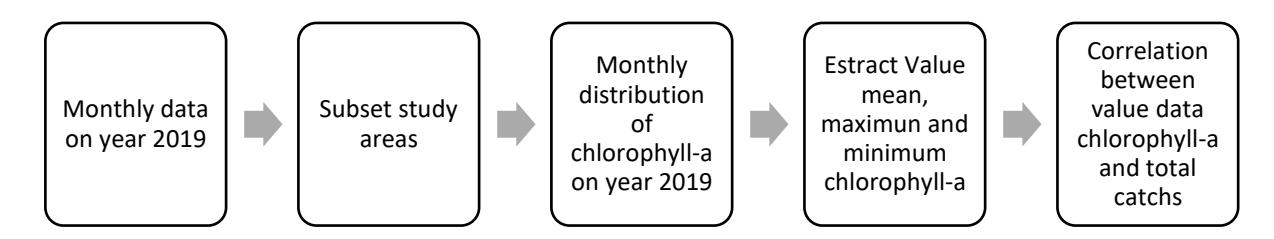
Step processing to accomplish the study's objective.
To identify patterns in chlorophyll-a concentration, this study utilized monthly remote sensing data from the MODIS Aqua sensor, featuring a spatial resolution of 4 km. Notably, reflectance at 443 nanometers (rrs443) was applied to detect phytoplankton absorption, which directly correlates with phytoplankton biomass. Higher values at this wavelength typically signify greater phytoplankton presence. Concurrently, we utilize reflectance at 555 nanometers (rrs555) to gauge backscattering by dissolved and particulate matter, estimating suspended sediment levels (Wirasatriya et al., 2021; Shi & Wang, 2007; Zheng & Tang, 2007).
The second set of data used in this study was the total catch of deep-sea and coastal fish for Sarawak and Sabah (Figure 3), including the federal territory of Labuan. This data is obtained from the Department of Fisheries Malaysia's website (https://www.dof.gov.my/en/resources/i-extension-en/annual-statistics/) and covers each month of the year 2019. The climate in the study area is influenced by monsoon events, the Madden-Julian Oscillation (MJO), and the El Nino Southern Oscillation (ENSO) (Kemarau & Eboy, 2021a). In 2019, ENSO and MJO incidents were observed to be neutral (Figure 2), resulting in weak impacts on the climate and weather in the area (Kemarau & Eboy, 2021a).
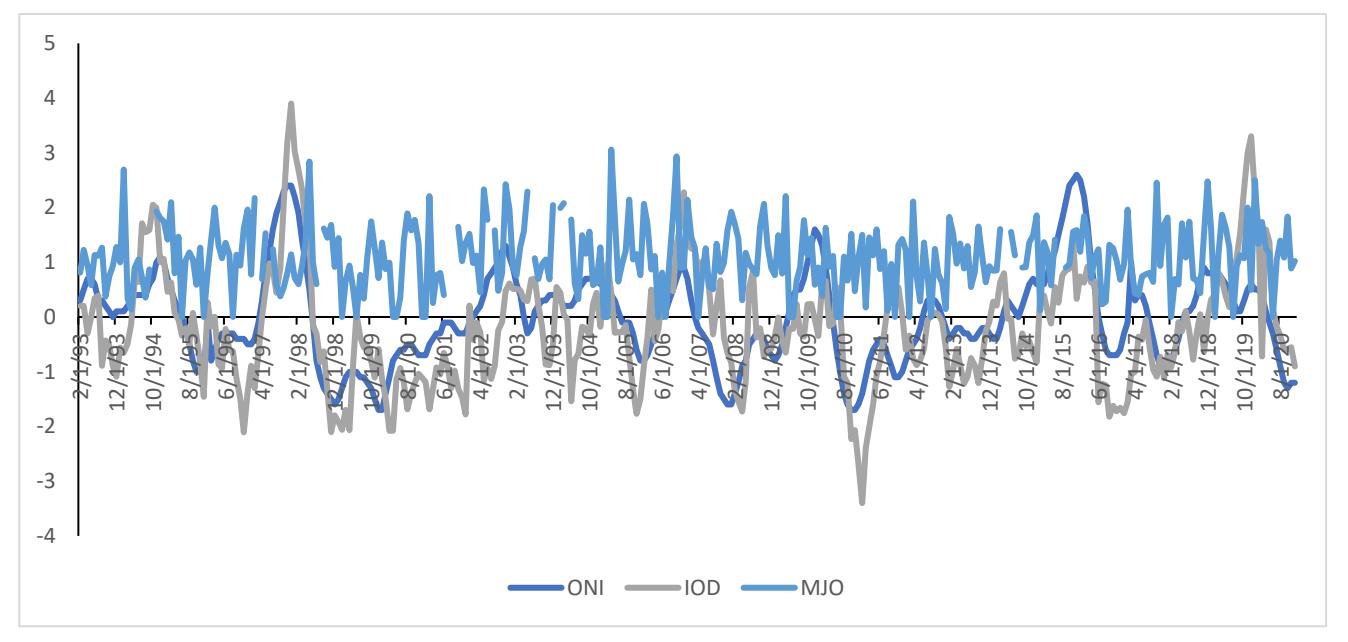
Patterns and Influences of ONI, MJO, and IOD during 2019.
The region experiences two primary monsoon events namely NEM from November to March, and the SWM from May to September, with transitional periods occurring in October and April (Kemarau & Eboy, 2021b; Loo et al., 2015; Cruz et al., 2013). The NEM is associated with higher rainfall amounts compared to the SWM and neutral periods (Cruz et al., 2013). The peak of the NEM typically falls between December and February, while the SWM reaches its peak from June to August (Wirasatriya et al., 2021).
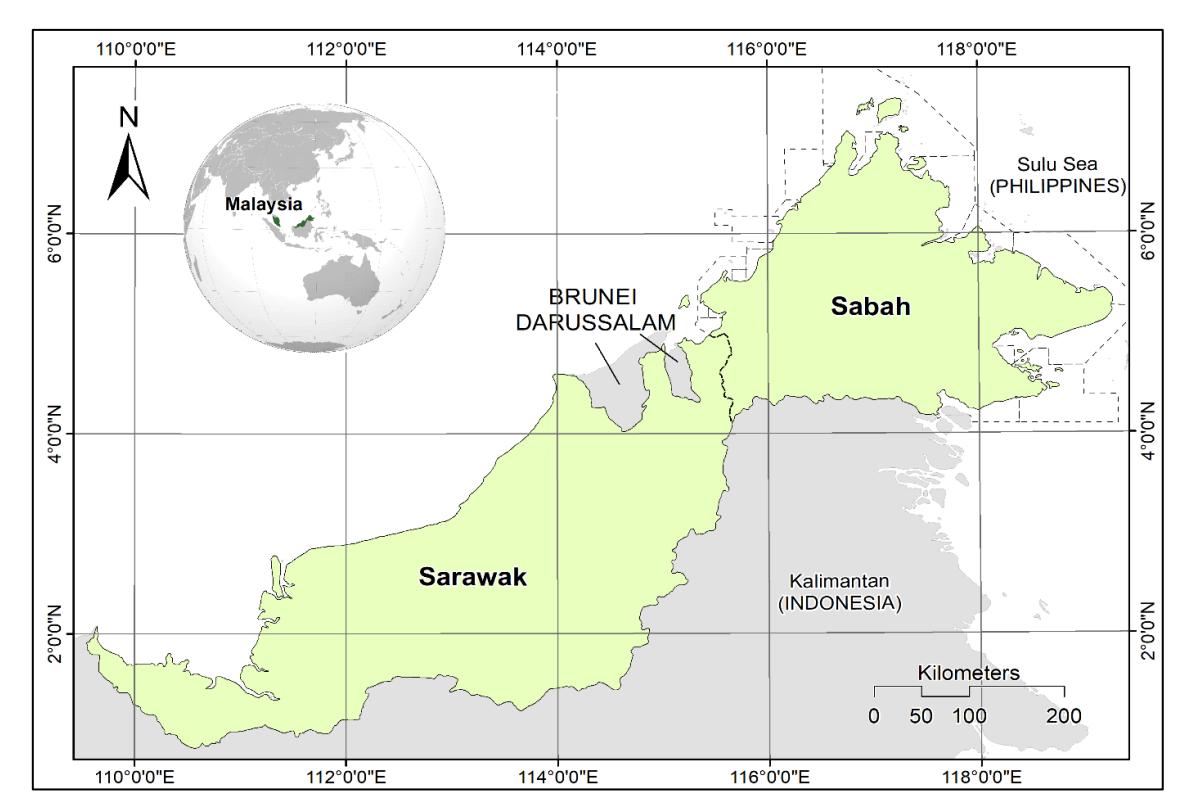
Location of Study (Sabah and Sarawak).
Results
Figure 4 presents a map illustrating the distribution of chlorophyll-a concentration in the waters of the SCS and the Sulu Sea for the states of Sabah and Sarawak during the NEM and SWM seasons in 2019. The map indicates that chlorophylla concentrations were more widespread during the NEM season than during the SWM season. Notably, in April, May, June, August, and September, there was a broader distribution of chlorophyll-a concentrations associated with the NEM season compared to January, February, March, November, and December, which are linked to the SWM season.
In December 2019, as illustrated in Figure 4, a significant observation was the widespread distribution of chlorophyll-a concentration along much of Sarawak's coastline and the west coast of Sabah. This widespread distribution is influenced by the NEM season, characterized by heavy rainfall. According to Figure 5, precipitation during this time reached a peak daily average of approximately 17 mm/day, with a cumulative monthly total exceeding 800 mm, based on data from NASA's POWER database, available for download at (https://power.larc.nasa.gov/beta/data-access-viewer/). This heavy rainfall likely contributed to runoff that transported nutrients into the coastal waters (Cruz et al., 2013; Xu et al., 2021).
As a result, the broader distribution of chlorophyll-a observed in December can be linked to the peak period of the NEM (Loo et al., 2015). However, despite this widespread dispersion, the study indicates that the average chlorophyll-a concentration during the NEM is 6.75 mg/m³, which is lower than the average concentration observed during the SWM, where values reach up to 15.35 mg/m³. Previous studies have identified Ekman pumping as a key factor contributing to this difference (Yuan-Jian et al., 2012). The chlorophyll-a concentration during the SWM exhibits higher maximum and mean values (Figure 4), a trend further discussed in Figure 7.
Figure 6 provides insights into the seasonal difference of wind speed at different atmospheric altitudes (10 meters and 50 meters) over the study area. The data indicate that wind speeds start increasing significantly in May, with maximum wind speeds reaching 18 m/s at 50 meters and 15 m/s at 10 meters during the SWM period. These variations in wind speed are critical as they influence ocean mixing and upwelling processes, which are vital for redistributing nutrients in the water column (Huyer, 1983). The increased wind speeds facilitate stronger Ekman transport, leading to upwelling depths of approximately 50-60 meters, bringing nutrient-rich waters to the surface (Pickett & Paduan, 2003). This process is fundamental for phytoplankton growth, as denoted by the chlorophyll-a concentration data (Behrenfeld & Falkowski, 1997).
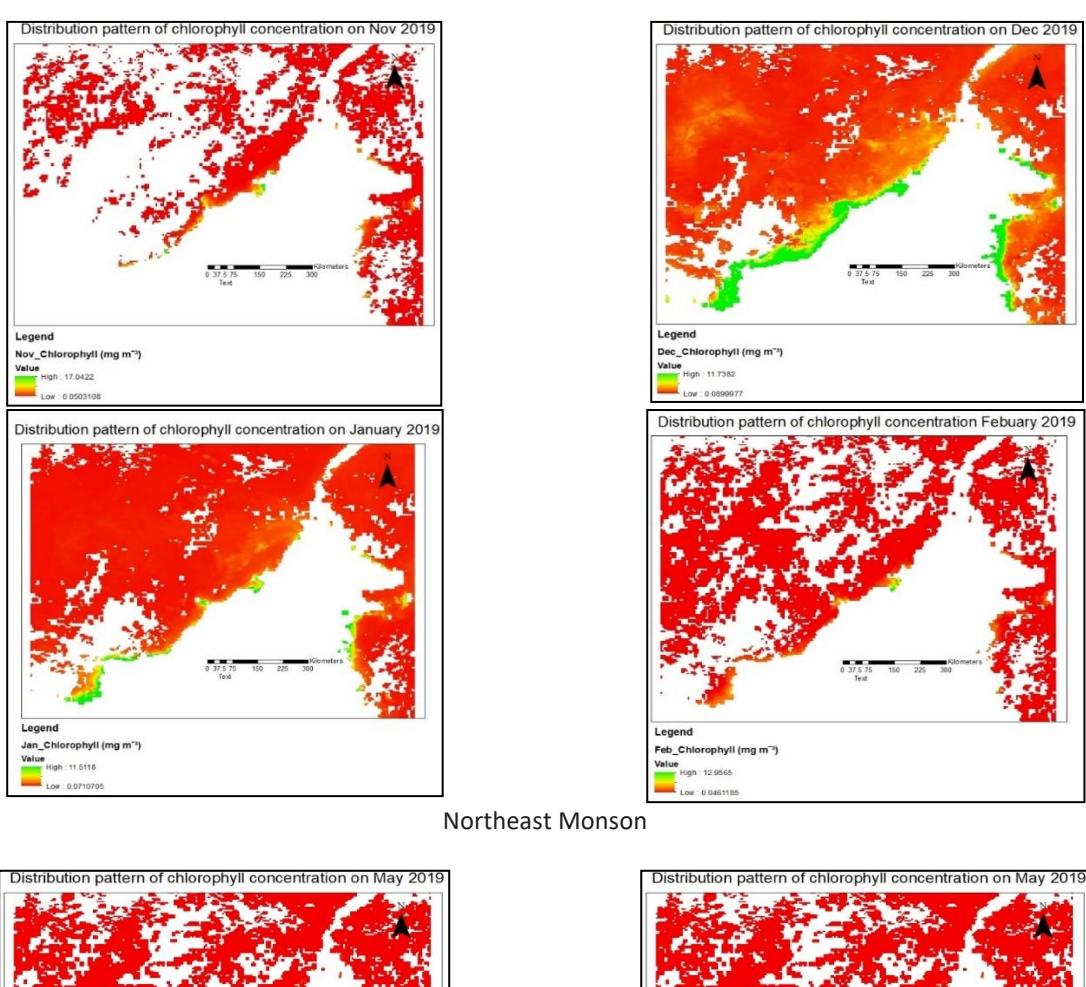
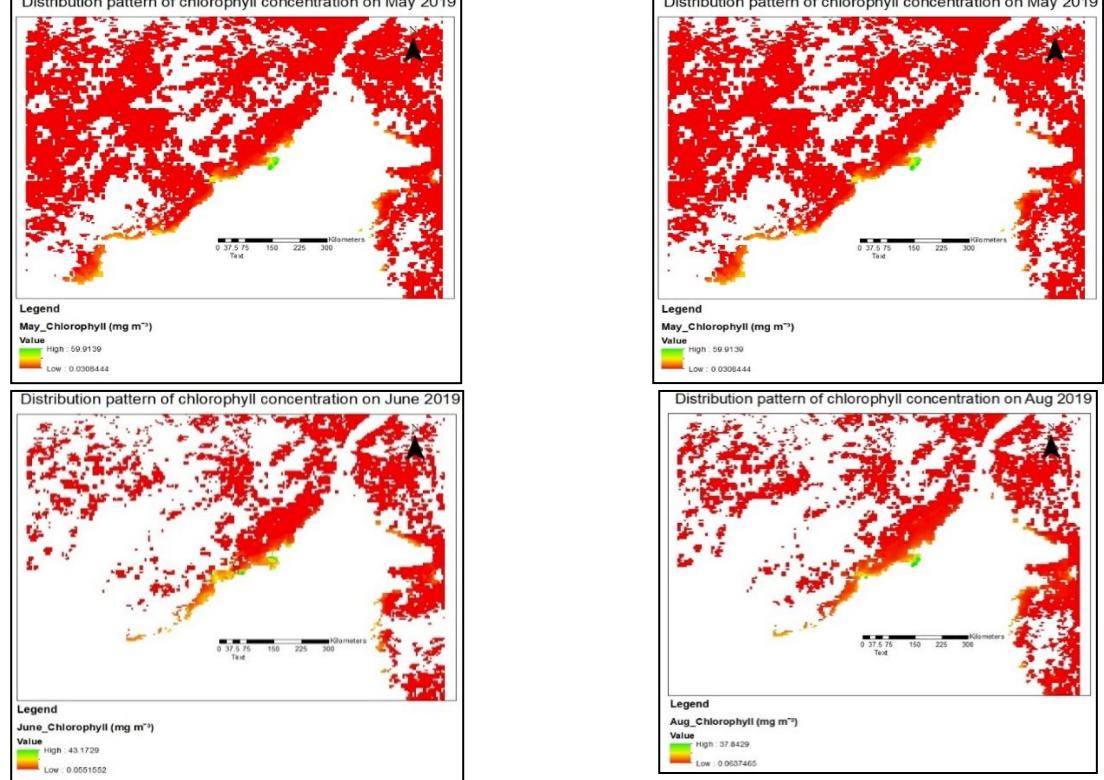
Southwest Monsoon Distribution pattern of chlorophyll concentration (mg mˉ³) during NEM and SWM in 2019.
6 Ricky Kemarau et al.
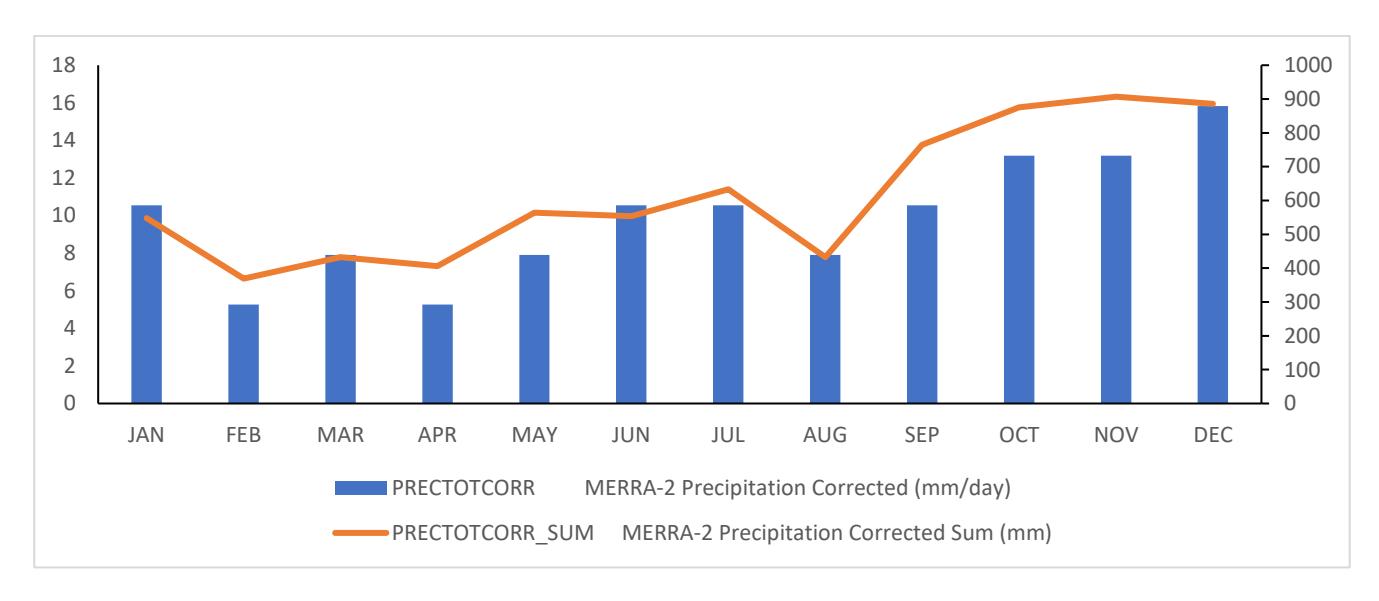
Precipitation average location of study in the year 2019.
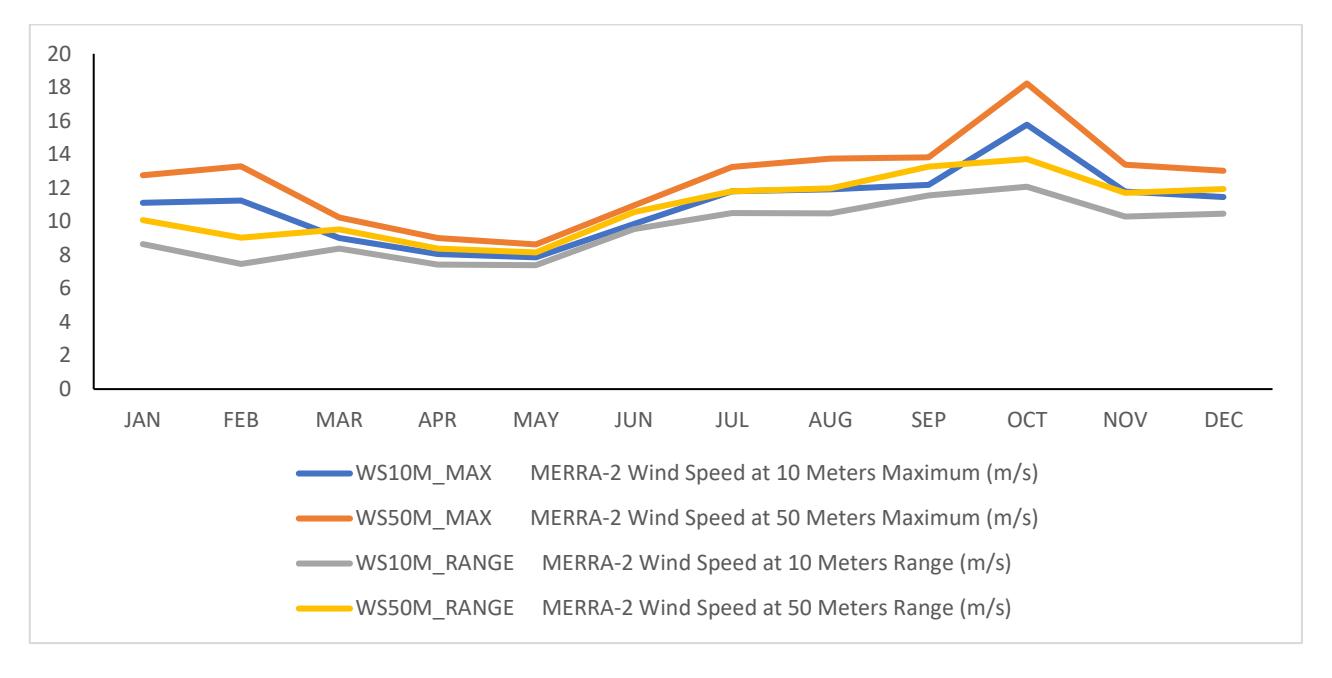
Seasonal variation of wind speed at various atmospheric altitudes across the study area.
In Figure 7, chlorophyll-a concentrations peak during the months associated with the SWM, with values ranging from 0.4 mg/m³ to 0.5 mg/m³, aligning with the period of increased wind speeds depicted in Figure 6. The elevated wind speeds during this time likely enhance upwelling, which boosts nutrient availability for phytoplankton, resulting in higher chlorophyll-a concentrations (Chavez & Messié, 2009).
The connection between wind speed and chlorophyll-a concentration is characterized by an increase in chlorophyll-a levels corresponding to higher wind speeds (Capone & Hutchins, 2013). As depicted in Figure 6, the elevated wind speeds observed in May enhance upwelling, which draws nutrient-rich waters to the surface, thereby stimulating phytoplankton growth and leading to increased chlorophyll-a concentrations. The peak chlorophyll-a values, as illustrated in Figure 7, align with the findings of Strub & James (2002). Numerous studies have corroborated this positive correlation between wind-driven upwelling and chlorophyll-a concentrations in coastal upwelling systems (Barber & Chavez, 1983). These studies suggest that increased ocean mixing and upwelling, driven by stronger winds, result in greater nutrient availability for phytoplankton, as reflected in the higher chlorophyll-a concentrations beginning in May as wind speeds intensify (Figure 7).
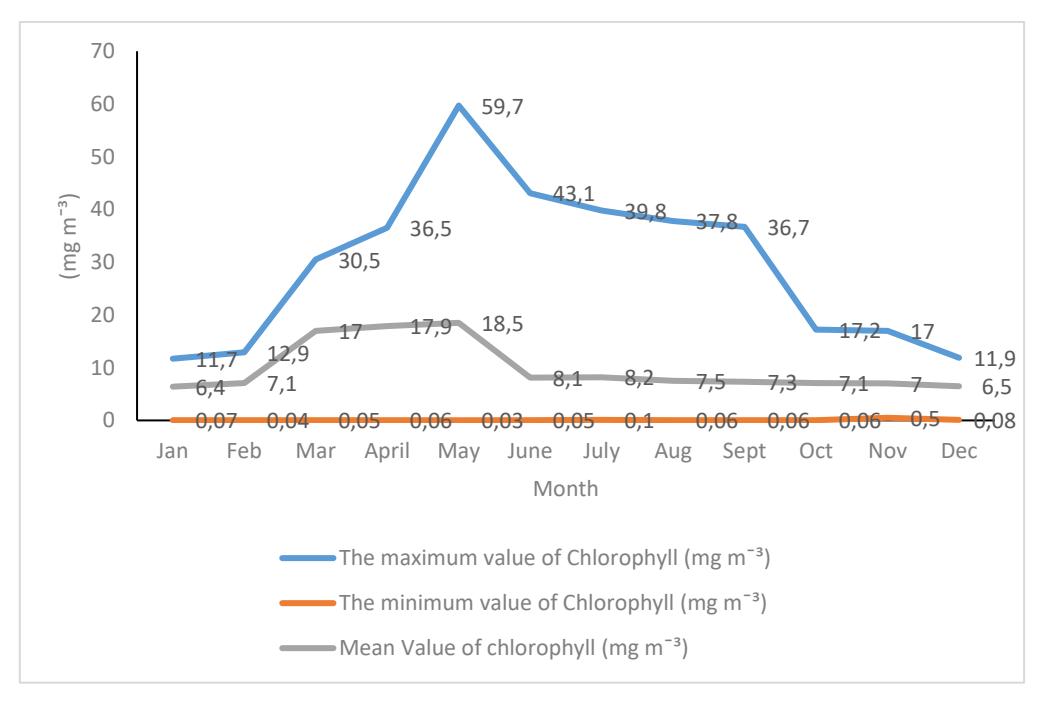
Statistic of Chlorophyll concentration (mg mˉ³).
Figure 7 elucidates the disparities in maximum and average chlorophyll-a concentration values during the NEM and SWM seasons. Figure 7 reveals that the SWM season (April, May, June, July, August, and September) exhibited higher maximum and average chlorophyll-a concentrations than the NEM season (November, December, January, and February). For instance, the maximum chlorophyll-a concentration during the SWM reached 30.5 mg mˉ³, whereas the lowest maximum value during the NEM was 36.5 mg mˉ³. Similarly, the average chlorophyll-a concentration during the SWM was higher than during the NEM. The highest average concentration value recorded during the SWM was 17.0 mg mˉ³, while the lowest average value was 7.3 mg mˉ³. These findings align with previous studies by Syahrizan & Bachok (2018), Sabanci (2014), and Petrou et al. (2016), which suggest that the drier and warmer conditions of the SWM season promote diatom growth, leading to higher chlorophyll-a concentrations. The influence of the NEM and SWM events on the maximum and average chlorophyll-a values in the waters of Sabah and Sarawak in 2019 was evident from the data presented in Figure 7 and Figure 8. Figure 8 presents the impact of monsoon events on fish catches in the waters of Sabah and Sarawak.
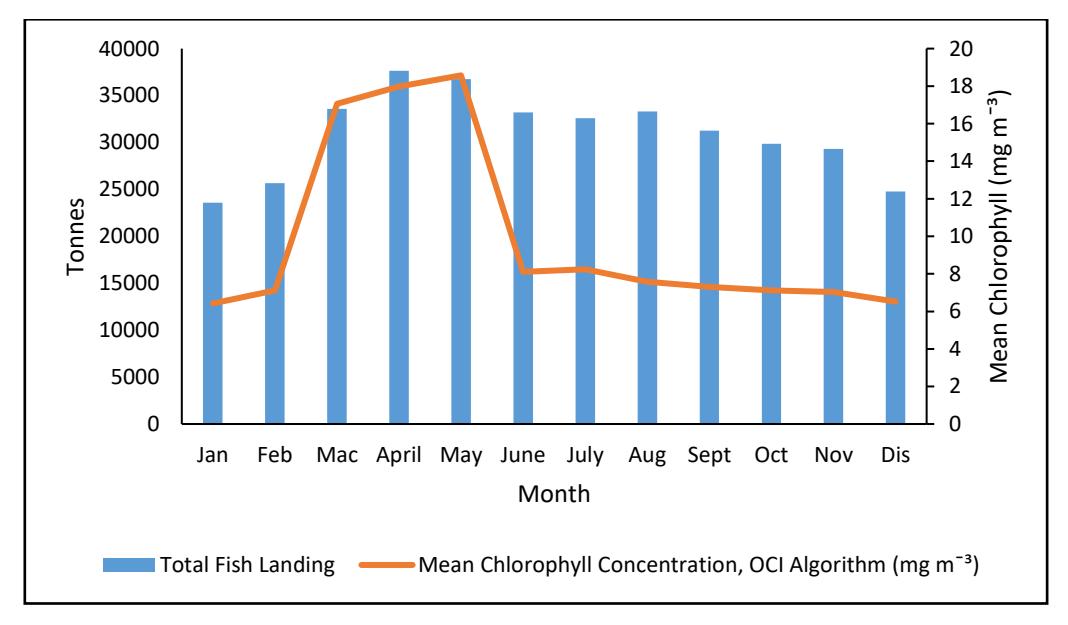
Pattern of total fish catches for both states and average monthly values in 2019
Figure 8 illustrates the relationship between total fish catch and average chlorophyll-a levels in the waters of East Malaysia. Consistent with the findings in Figure 8, the figure demonstrates that the total catch during the SWM season surpassed that of the NEM season. This study reveals that the monthly fish catch during the SWM consistently exceeded 30,000 tons from March to September. However, as the NEM season commenced in November, the total catch in Sabah and Sarawak waters declined, falling below 30,000 tons (precisely 29,319 tons). This decline in fish catch continued throughout the NEM season, with 24,781 tons in December, 23,586 tons in January, and 25,658 tons in February. The decrease in total fish catch can be attributed to the corresponding average chlorophyll-a concentration in the region. At the onset of the NEM season in November, the average chlorophyll-a level stood at 7.034 mg mˉ³, increasing to 6.52 mg mˉ³ in December, 6.42 mg mˉ³ in January, and 7.22 mg mˉ³ in February.
Conversely, the average chlorophyll-a concentration witnessed a surge during the beginning of the SWM season, reaching 17.03 mg mˉ³ in March and peaking at 18.57 mg mˉ³ in May. This increase coincided with a rise in fish catch, aligning with the higher average chlorophyll-a levels. However, a slight decrease in fish catches was observed in June, potentially attributed to a decrease in the average chlorophyll-a levels. The NEM season brings about the rainy season and influences the total fish catch (Maryam et al., 2013) and the average chlorophyll-a concentration in East Malaysia waters (Kemarau et al., 2023).
The amplified average chlorophyll-a concentration during the SWM season can be attributed to the drier and warmer conditions that facilitate favorable conditions for diatom growth, as suggested by previous studies (Syahrizan & Bachok, 2018; Sabanci, 2014; Petrou et al., 2016].
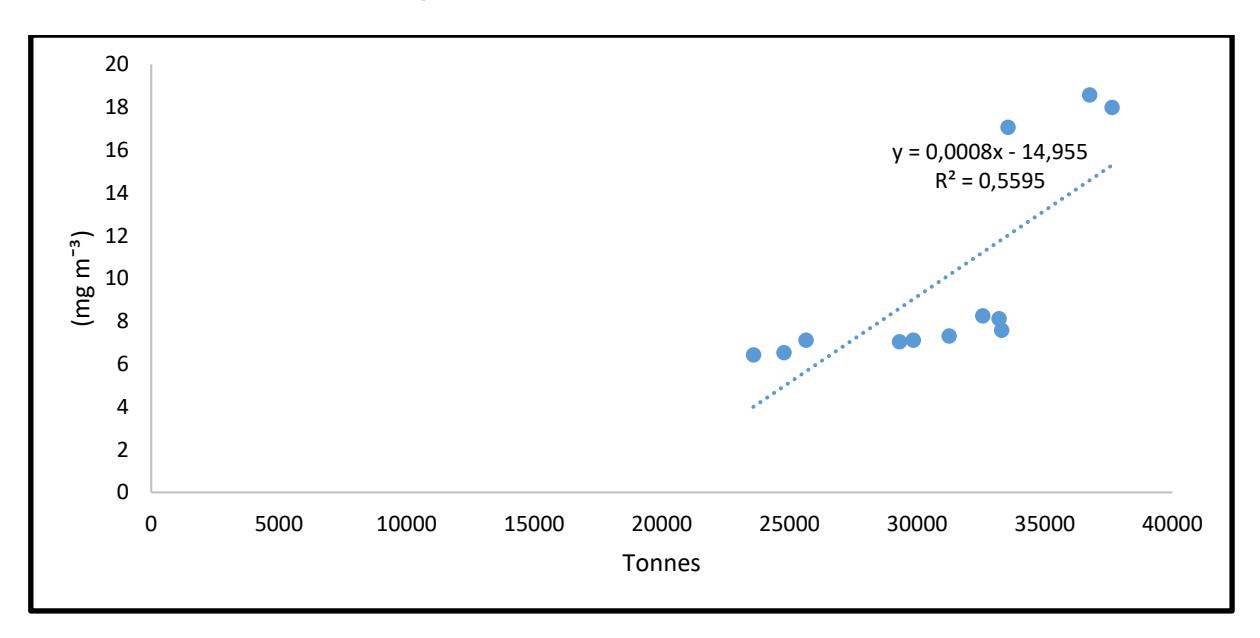
Scatter plot showing the positive correlation between the average chlorophyll-a concentration (mg m^-3) in the waters of Sabah and Sarawak and the total fish catch (tonnes).
The correlation analysis uses a small sample size (Sidik et al., 2008), drawing inspiration from the rationale provided by Vickers et al. (2003), stating the quality and effect of the data that can explain the relationship between variables. In this case, a small sample is sufficient to detect a statistically significant effect (Maxwell et al., 2017). Acknowledging the significance of data quality is crucial, especially when dealing with a limited sample size (Vickers, 2003). In our case, the data on fish catch and chlorophyll-a concentration are of utmost importance, given their relevance to our analysis. Moreover, despite the constraints of a small sample, we recognize that a robust relationship between variables can still yield meaningful insights. Our findings indicate a statistically significant correlation between chlorophyll-a and fish catch, underscoring the relevance of our analysis despite the modest sample size. The observed correlation offers valuable initial insights into the relationship between chlorophyll-a concentration and fish catch in the region. A moderate positive correlation was found between the average chlorophyll-a concentration and the total fish catch in East Malaysia, with a coefficient of determination (R²) value of 0.55 (Figure 9). This suggests that an escalation in the average chlorophyll-a concentration is related to a corresponding increase in total fish catch in the region. The distribution and concentration of chlorophyll-a are significantly influenced by the monsoon seasons in these waters.
The results are consistent with the study by Welliken et al. (2019), which found that the SWM season contributed to increased chlorophyll-a levels, leading to peak fishing activities. Additionally, our results align with the research by Lahlali et al. (2018), which also showed a positive correlation between total fish catch and chlorophyll-a concentration. This study provides valuable insights into the complex interactions between monsoon events, chlorophyll-a distribution, and fishery outcomes in Sabah and Sarawak. Understanding these dynamics is essential for effective regional fisheries management and conservation strategies.
Conclusions
This research employed remote sensing technology to comprehensively map the monthly variations in chlorophyll-a concentration throughout 2019. By doing so, it provided valuable insights into how the NEM) and SWM events impact fisheries in Sabah and Sarawak. The research was driven by inconsistencies identified in previous studies regarding the effects of monsoon events on chlorophyll-a concentration distribution. The findings revealed that the impact of these monsoon events on fishing activities and changes in chlorophyll-a distribution is highly location-specific, resulting in varied outcomes.
The study observed that both the average and maximum chlorophyll-a concentrations in Sabah and Sarawak were higher during the SWM season compared to the NEM season. These fluctuations in chlorophyll-a concentration were found to have a direct influence on the total fish catch patterns in the region. The results also demonstrated a positive correlation between the mean chlorophyll-a concentration and the total fish catch. Additionally, remote sensing technology indicated a broader dispersion of chlorophyll-a during the NEM season, mainly due to nutrient-rich runoff, though at lower concentrations than those observed during the SWM season. These findings contribute significantly to our understanding of how monsoon events affect chlorophyll-a distribution, which in turn plays a crucial role in managing fishing activities. The use of remote sensing technology in this study provides insights that can enhance decision-making and improve fisheries management practices.