
Introduction
Indican, a precursor to indigo dye (depicted in Fig. 1), is derived from Indigofera tinctoria L. and Isatis tinctoria L.. The former, native to regions such as West Tropical Africa, Tanzania, South Africa, the Indian subcontinent, and Indo-China, is characterized by its composition of indoxyl-β-d-glucoside. The latter, known as woad and historically utilized in Europe, contains Isatan B and Indican, playing a critical role in textile dyeing and cultural heritage preservation (Buchweitz, 2024; Degani et.al., 2015). Indigo, also referred to as Indigotine (with a peak absorbance at 610 nm), demonstrates moderate solubility in medium-chain triglycerides but is nearly insoluble in aqueous solutions (0.55 mg/L at pH 3) (Degani et.al., 2015). Interest in the cultivation of Indigofera tinctoria has been increasing globally due to its broad applications, not only as a natural dye for textiles (Abdullah, 2014) but also as a component in animal feed (Hariri, 2016; Mantzouris, 2014; Patel, 2011). Emphasizing the utilization of natural resources, such as Indigofera tinctoria, is essential for promoting sustainable and environmentally friendly development across multiple sectors, including energy, human and animal nutrition, and textile industries. This shift toward natural resources reflects a global effort to foster sustainability and minimize environmental impact.
Indigofera tinctoria L. Isatis Tinctoria L., esteemed for its indigo-producing capabilities, is essential to multiple sectors; nevertheless, its extraction procedures result in just a tiny percentage of useable material, generating a significant quantity of waste (Miceli, 2023; Pattanaik, 2019). Regrettably, the extraction procedure of Indigofera tinctoria L. Isatis tinctoria L. yields only 10-20%, resulting in a substantial waste of 80-90% of the indigo plants. The by-products, primarily composed of lignocellulosic biomasses, generate noxious odours and exacerbate environmental degradation. The by-
products, mainly consisting of lignocellulosic biomasses, present environmental issues due to their offensive odour and disposal difficulties. Concurrently, conventional techniques for transforming lignocellulosic materials into valuable products, such as syngas and biofuels, including pyrolysis and gasification, necessitate substantial energy inputs (Hadi, 2014; Zadeh, 2020; Zhang, 2023). Nonetheless, anaerobic digestion (AD) is regarded as a feasible alternative owing to its reduced energy demands, revealing significant savings across 202 urban wastewater treatment facilities operated by prominent water companies (Hera and Acquedotto Pugliese). Anaerobic plants utilise 0.43 kWh/m³, in contrast to aerobic plants' 1.02 kWh/m³, highlighting regional disparities, with northern Italy averaging 0.33 kWh/m³ and Apulia averaging 0.53 kWh/m³ (Cheng, 2021; Poddar, 2022). Notwithstanding its potential, the conversion of lignocellulosic materials, such as Indigofera plants, into biogas through anaerobic digestion presents hurdles due to the complex structure of cellulose and hemicellulose interlinked by lignin (Chettri, 2024; Dutta, 2023; Periyasamy, 2022).
Chemical structure of natural blue Indigo and Indigofera Tinctoria L. plant
A variety of pre-treatment strategies have been investigated to improve the digestion process, including physical methods such as pulverization (Bruni, 2010; Delgenès, 2003) and extrusion (Hjorth, 2011), biological methods such as fungal (Poddar, 2022) and microbial consortium treatments (Yin, 2021), chemical treatments include alkaline (Chettri, 2024; Dutta, 2023; Periyasamy, 2022) and acid (Amin, 2017; Poddar, 2022) applications, and thermal pre-treatments such as hydrothermal (Ahmed, 2019) and microwave irradiation (Wang, 2021). Nonetheless, these methods frequently entail substantial expenses and may produce inhibitory substances that adversely affect microbial activity during anaerobic digestion (Náthia-Neves, 2018). In contrast, Indigofera tinctoria presents a more sustainable and costeffective alternative due to its naturally favorable properties. With a lower lignin content, high biodegradability, and an optimal carbon-to-nitrogen (C/N) ratio, Indigofera tinctoria minimizes the need for extensive and costly pre-treatment processes while maximizing biogas production. Its balanced composition supports efficient digestion, offering a promising solution for biogas production without the challenges associated with conventional pre-treatment methods.
Indigofera tinctoria possesses considerable promise as a substrate for biogas production owing to its unique biochemical properties, surpassing those of conventional lignocellulosic materials. A key feature is its optimum carbon-to-nitrogen (C/N) ratio, which ranges from 25 to 30, perfect for promoting microbial growth during anaerobic digestion (AD) (Ahmad, 2024; Cerón-Vivas, 2019; Martínez-Gutiérrez, 2018; Sarker, 2019). The balanced carbon-to-nitrogen ratio mitigates ammonia inhibition, a prevalent problem in substrates with excessive nitrogen that can impede methane generation [(Ahmad, 2024; Cerón-Vivas, 2019; Martínez-Gutiérrez, 2018; Sarker, 2019). In contrast, other lignocellulosic materials, such as rice straw, typically display elevated C/N ratios (50 to 70) and hence necessitate extra nitrogen sources to sustain the requisite balance for effective anaerobic digestion (Wang, 2014). Furthermore, Indigofera tinctoria possesses a lignin level ranging from 10% to 15%, rendering it more biodegradable (Pattanaik, 2019). Lignin, a complex polymer, is recognised for its resistance to microbial decomposition, which considerably obstructs the anaerobic digestion process. Conversely, substrates such as teak or mahogany, possessing lignin concentrations of around 25% to 30%, are less conducive to biogas production owing to their diminished biodegradability (Olatunji, 2021). The elevated cellulose (35–40%) and hemicellulose (25–30%) content in Indigofera increases its appropriateness, as these constituents are abundant in fermentable sugars that are vital precursors to volatile fatty acids, which in turn facilitate methane production. Furthermore, its calorific value, between 16 and 18 MJ/kg, underlines its energy potential in biogas systems (Pattanaik, 2019).
Notwithstanding these benefits, the exclusive use of Indigofera tinctoria may not consistently result in optimal biogas generation. Co-digestion, including the amalgamation of Indigofera with additional substrates, is essential for enhancing biogas production and ensuring process stability. This approach facilitates a more balanced nutritional composition and improved microbial diversity, hence enhancing the degradation of more resistant components and reducing the possibility of inhibitory by-products that may arise from utilising a singular substrate. Co-digestion harnesses the advantages of many materials, producing a synergistic effect that enhances overall methane generation. Thus, Indigofera's incorporation with alternative substrates provides a more pragmatic and practical approach to sustainable biogas generation.
Co-digestion presents a mutually beneficial situation: economical treatment, enhanced C/N ratios, augmented biogas output, and sustainable waste management (Ranieri, 2021). A balanced carbon-to-nitrogen (C/N) ratio, generally between 20 and 30, is crucial for ensuring process stability and optimising biogas production (Bruni, 2010). Anaerobic co-digestion demonstrates potential in increasing methane production, mitigating inhibitory effects, and improving process stability by synergistically decomposing lignocellulosic biomass and compatible substrates, offering viable solutions for sustainable waste management and biomethane production. This approach significantly increases methane outputs, enhances process stability, and improves organic matter conversion, highlighting its potential for sustainable waste management and biomethane generation (Aboudi, 2020; Ibro, 2022). Despite the prospective advantages of co-digestion, less research has investigated its application, specifically with Indigofera tinctoria L. vegetative refuse and bovine excrement. This study seeks to examine the biogas production derived from the anaerobic co-digestion of these materials. Critical parameters, including substrate feeding rates and pH levels, will be evaluated, accompanied by daily monitoring of H₂S concentration to guarantee process stability. The biogas produced will be employed for electricity generation using an internal combustion engine, underscoring the practical implications of this research in sustainable energy production.
Methods
Anaerobic digestion process
The anaerobic digestion (AD) process aimed at biogas production from a mixture of Indigofera tinctoria waste and cow manure involved several meticulous steps. Fresh Indigofera tinctoria waste was sourced from local natural dye industries in Surakarta. The waste was mechanically chopped into small pieces, ranging from 1 to 3 mm in size, and then left to dry naturally for approximately three days. To prepare the substrate mixture, the chopped Indigofera tinctoria waste and cow manure were combined in a 1:1 weight ratio. Water was added in an equal proportion to the substrate mixture to achieve the optimal moisture content for anaerobic digestion.
The properties of the substrates, such as the C/N ratio, water content, and volatile solids (VS), were determined using standardized procedures to ensure precision and result comparability, as presented in Table 1. The water content and VS were measured following ASTM D2974, while the C/N ratio was analyzed using ASTM D5373-14, which outlines guidelines for elemental analysis of carbon, hydrogen, and nitrogen in samples. To determine the water content, fresh substrate samples were initially weighed (wet basis) and subsequently dried in an oven at 105°C until a constant weight was achieved. The difference between the initial and final weights, expressed as a percentage of the initial weight, represented the water content. For Indigofera plant waste, the water content was measured at 74.0%, while cow manure exhibited a water content of 74.6%, as detailed in Table 1.
The volatile solids (VS) were quantified by initially assessing the dry matter of the samples, followed by combustion in a furnace at 550°C. This procedure eradicated all biological matter, resulting in solely inorganic ash. The VS was quantified as the weight loss during combustion in relation to the beginning weight. The waste of Indigofera plants demonstrated a volatile solid (VS) content of 9.6%, while cow manure displayed a VS content of 7.3%. The comparatively low VS values indicate a substantial presence of inorganic constituents and moisture, which reduced the fraction of organic matter. The C/N ratio was determined by analysing the elemental makeup of carbon, hydrogen, and nitrogen in accordance with ASTM D5373-14. This entailed combusting the samples at elevated temperatures ranging from 900°C to 1100°C in an elemental analyser. The ratio of carbon to nitrogen was subsequently computed to evaluate the equilibrium of these essential nutrients. The waste of Indigofera plants and cow manure exhibited C/N ratios of 21:1 and 24:1, respectively, as seen in Table 1. These values signify a moderate nitrogen concentration appropriate for microbial breakdown activities and biogas generation.
Table 1 Properties of substrates
| Properties | Waste of Indigofera Plants | Cow Dung | ||
|---|---|---|---|---|
| C/N | 21:1 | 24:1 | ||
| Water content (wb) | 74.0% | 74.6% | ||
| VS | 9.6% | 7.3% | ||
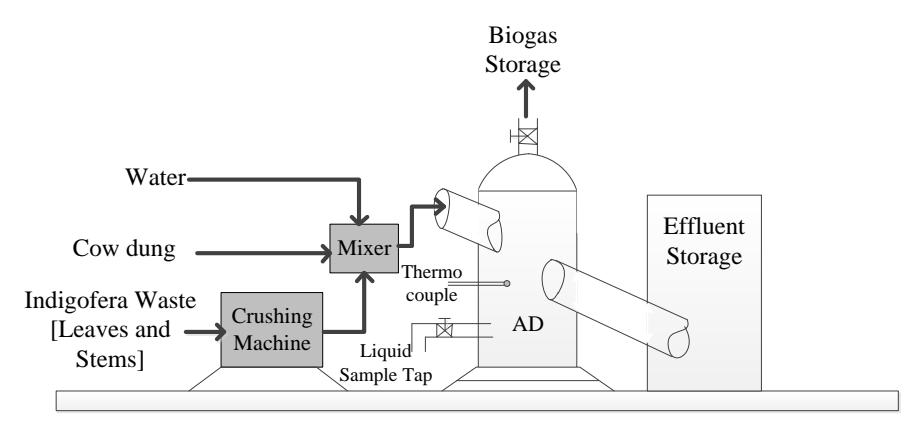
Figure 2 Scheme of AD reactor.
The AD reactor, seen in Fig., was carefully conceived and constructed, and 2 played a vital part in enabling the anaerobic digestion to proceed. It possessed a capacity of 3300 litres and was constructed from resilient plastic material, guaranteeing durability and effective biogas generation. The reactor design had two separate pools utilised for carbon breakdown in Indigofera tinctoria plant stems and for regulating the optimal carbon-to-nitrogen (C/N) ratio through the incorporation of cow manure. This design optimization improved biodegradation efficiency and increased biogas output.
The feeding rates into the anaerobic digestion reactor varied from 34 to 95 kg per day, facilitating a methodical analysis and optimization of biogas output characteristics. Essential metrics such as biogas output, reactor temperature, and pH levels were systematically measured at designated intervals. A comprehensive daily examination of methane (CH<sub>4</sub>) and hydrogen sulphide (H<sub>2</sub>S) levels in the biogas was performed, producing quantitative data on gas composition and quality.
Gas samples were collected from the biogas digester using Tedlar bags to ascertain the amounts of \(CH_4\) (methane) and \(H_2S\) (hydrogen sulphide), as these bags are engineered to avoid gas leakage and contamination. The gas sample procedure entailed the insertion of a needle or gas-tight syringe through the septum of the digester's gas outflow to extract the gas, subsequently transferring it into Tedlar bags for laboratory examination. \(CH_4\) was measured by direct loop injection into a GC–MS, utilising Tedlar bags connected to the loop via PTFE tubing, thereby maintaining sample integrity with airtight septa (Mariné, 2012). The identical gas sample of \(H_2S\) was examined utilising a Riken Keiki RX 8700 Portable Gas Monitor. These analytical techniques yield exact quantifications of \(CH_4\) and \(H_2S\) concentrations, guaranteeing precise biogas characterization.
Statistical Analysis
This study conducted a rigorous statistical analysis to clarify the links between important variables influencing biogas output and H<sub>2</sub>S level. Analysis of Variance (ANOVA) serves as the principal statistical technique utilised to assess the variance among components, including substrate feeding rate, pH levels, and their interaction. The data on biogas production, substrate feeding rate, and pH levels were carefully entered into statistical software, specifically Excel, to conduct the ANOVA testing. This research established the significance of each factor's impact by evaluating F-values, p-values, and crucial F-values, yielding valuable insights into their contributions to the observed results.
Moreover, a comparative analysis was conducted to assess biogas production rates from different substrates, including those used in the co-digestion of Indigofera plant waste and cow manure. This comparison provided valuable insights into the effectiveness of the co-digestion process relative to other commonly utilized substrates in biogas production. The analysis incorporated various statistical parameters, such as F-values, p-values, mean squares, and degrees of freedom, to thoroughly evaluate the impact of each factor on biogas production. These statistical measures allowed for well-founded conclusions regarding the significance of individual factors and their role in optimizing anaerobic digestion processes. The statistical approach adopted in this study offered a comprehensive framework for understanding the interactions between substrate feeding rates, pH levels, and their collective impact on biogas production and hydrogen sulfide (H<sub>2</sub>S) content.
Biogas utilization for electricity generation
In the subsequent stage of biogas utilization, electricity generation was accomplished using an internal combustion engine. A four-stroke, single-cylinder engine with a rated output power of 2800 W, operating at 220 V and a frequency of 50 Hz, was employed for this purpose. The engine was integrated with an electric generator, which efficiently converted the mechanical energy produced into electrical energy. Various electrical loads, such as lamps, were connected to the generator's output, and the voltage and current were carefully monitored to ensure efficient power distribution and consumption management. These well-structured methods enabled the effective production of biogas and its successful conversion into electricity.
Results and Discussion
Biogas production yield
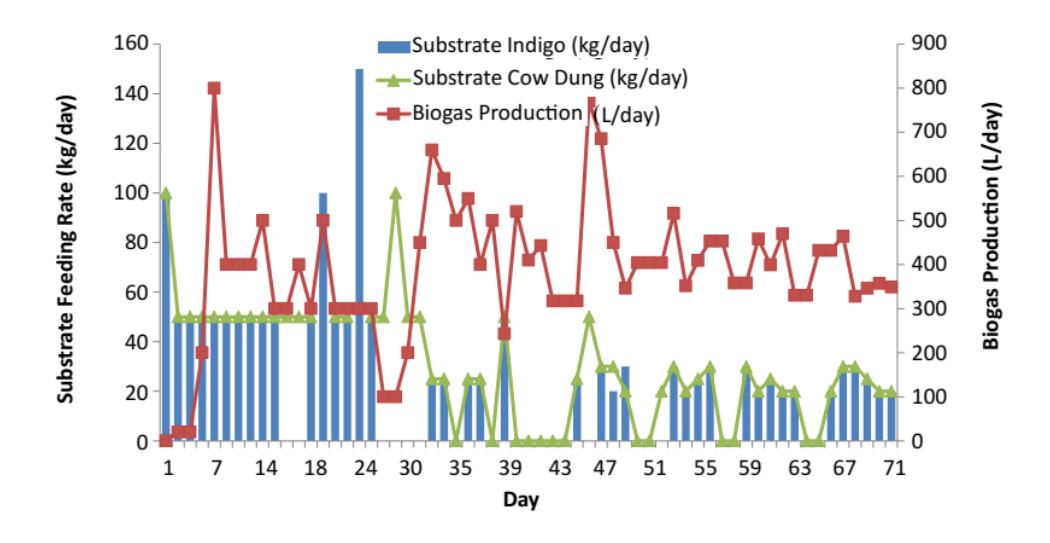
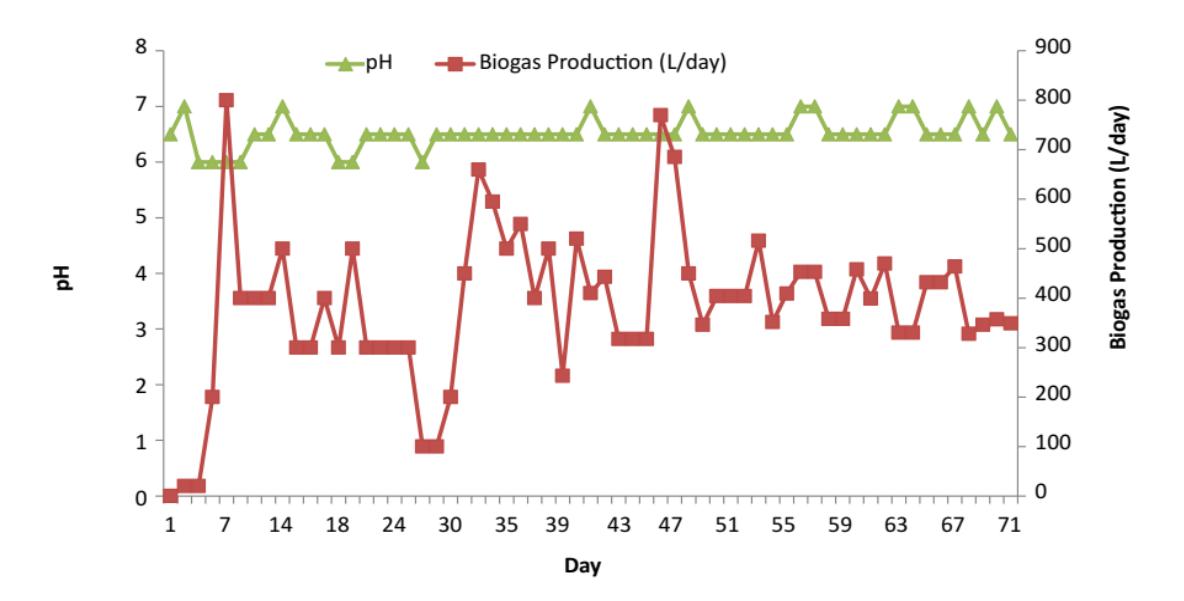
Figure 3 provides an extensive analysis of the biogas production trends recorded throughout the study period. The data indicates variations in biogas production, spanning from 100 to 800 litres daily. A substantial increase in biogas production, reaching 800 L per day, was seen on the seventh day of monitoring. Subsequently, this apex was succeeded by a significant reduction, resulting in biogas output diminishing to 100 litres per day on the 25th day. This decline correlated with other causes, including a decrease in substrate feeding rates and a reduction in pH levels to 6, as illustrated in Fig Four. Subsequent analysis of the data underscores the crucial importance of pH in anaerobic digesting processes. Prior research (Karidio Daouda Idrissa, 2023; Lu, 2023; Mao, 2015) has highlighted the influence of pH on biogas production, identifying ideal circumstances at temperatures above 29.5°C and pH levels between 6 and 7. In contrast, temperatures below 29.5°C typically impede the digesting process. pH levels of 6.0 are linked to increased hydrolytic enzyme activity, leading to higher volatile fatty acid (VFA) content (Jiang, 2013; Karidio Daouda Idrissa, 2023).
Relationship between substrate feeding rate and biogas production.
The efficacy of methanogenesis, the principal mechanism for biogas production, depends on sustaining pH levels between 6.5 and 8.2, with an optimal pH of 7.0 (Karidio Daouda Idrissa, 2023; Lee, 2009). Methanogenic bacteria, essential for methane production, are sensitive to pH fluctuations and flourish in an environment with a pH of around 7.0. In contrast, acidogenic bacteria can endure a wider pH range, often from 4.0 to 8.5, with an ideal pH range of 5.5 to 6.5 for hydrolysis and acidogenesis (Karidio Daouda Idrissa, 2023; Kouzi, 2020; Kwietniewska, 2014). The observed pH variations result from ammonia accumulation during protein degradation, causing pH elevation, whereas the accumulation of volatile fatty acids (VFAs) leads to pH lowering (Izumi, 2010; Kovács, 2013). Volatile fatty acids (VFAs), produced during the hydrolysis of macromolecular organic components such as carbohydrates and lipids, are essential in the anaerobic digestion process. Maintaining pH within the appropriate range is essential for the stability and efficiency of the digesting process. Consequently, this study aimed to maintain pH levels between 6 and 7, with a target average of pH 6.5.
Correlation between pH levels and biogas yield production.
H₂S content in biogas
Hydrogen sulphide (H₂S) in biogas presents considerable hazards owing to its toxicity and potential for environmental and mechanical harm. Hydrogen sulphide (H₂S) is harmful to the environment and human health, and its existence significantly accelerates corrosion in machinery and engines (Fonseca-Bermúdez, 2023; Pipatmanomai, 2009). This highlights the necessity of monitoring and regulating H₂S concentrations in biogas utilization processes. In the realm of biogas utilization, it is essential to regulate H₂S concentrations within a specific range to avert corrosion in engines and pipelines. Concentrations of H₂S between 50 and 10,000 ppm present a substantial corrosion risk, primarily when biogas is employed as a fuel for electricity generation (Tamburini, 2023). Consequently, it is essential to maintain low H₂S levels to alleviate these detrimental consequences.
In our investigation, biogas generated from the co-digestion of Indigofera tinctoria waste and cow manure showed comparatively low H₂S concentrations. The predominant reported H₂S concentration stayed below 60 ppm over the observation period. Instances of increased H₂S levels were recorded, with concentrations reaching 150 ppm on the 15th day and 80 ppm on the 40th day, as illustrated in Fig. 5. The variations in H₂S concentration can be ascribed to an overabundance of Indigofera tinctoria residues in the substrate composition. This occurrence underscores the necessity of meticulously regulating substrate compositions to govern H₂S generation in biogas. Enhancing the proportion of Indigofera tinctoria residues to bovine excrement can effectively control H₂S concentrations and reduce the likelihood of corrosion in biogas utilization systems. Maintaining H₂S concentrations within acceptable levels preserves the integrity and efficiency of machinery and engines used in biogas-based energy generation.
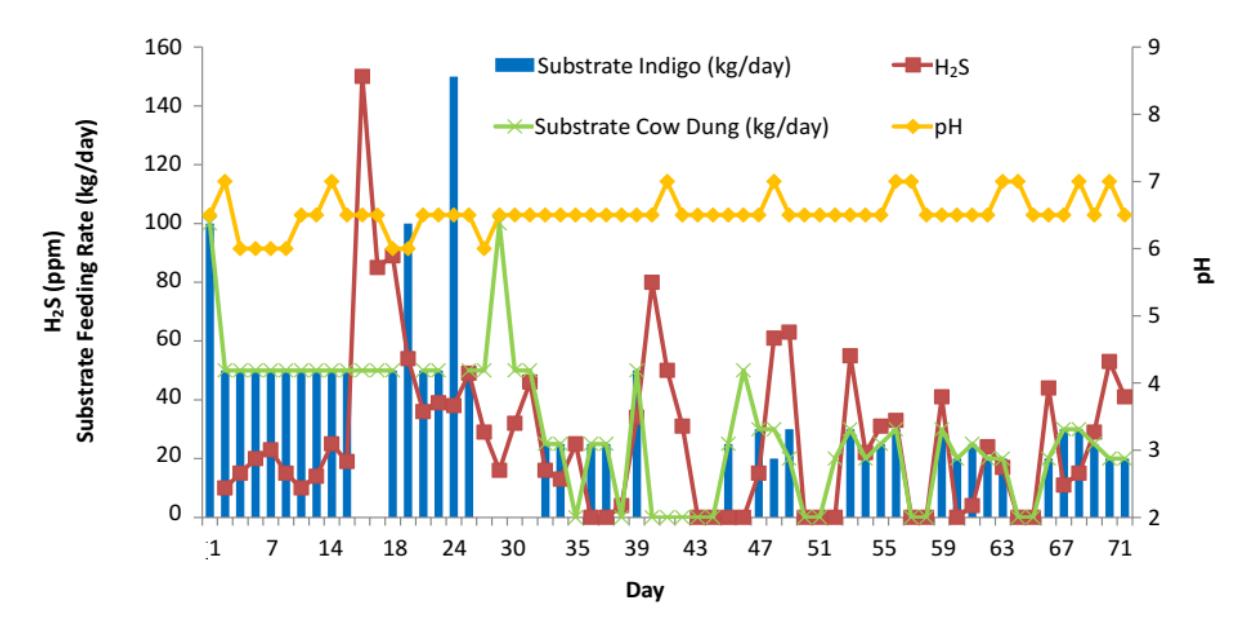
Relationship between pH levels and hydrogen sulfide (H₂S) content in biogas produced within the 3300 L anaerobic digestion (AD) system.
The incorporation of Indigofera tinctoria in the biogas generation process markedly modifies the gas composition, chiefly by influencing the concentration of hydrogen sulphide (H₂S) and the total biogas yield. Experimental data demonstrate that the co-digestion of Indigofera with cow manure results in variations in H₂S levels, with the majority of readings remaining under 60 ppm; still, sporadic peaks above 150 ppm were recorded, especially on the 15th and 40th days of digestion. The increases are ascribed to an excess of Indigofera in the substrate mix, indicating that the proportion of Indigofera to cow manure is essential in regulating H₂S emissions. The biogas production rate is directly correlated with the substrate feeding rate, with reduced feeding rates observed to increase gas output, achieving up to 431 litres per day at a feeding rate of 34 kg/day. This highlights the necessity of optimising substrate composition and feeding rates to enhance biogas efficiency while efficiently regulating H₂S levels in the generated gas, which is crucial for reducing corrosion hazards and maintaining safe engine operation.
Interaction between substrate feeding rate and pH
Table 2 presents an analysis of variance (ANOVA) that elucidates the relationship among pH, substrate feeding rate, and biogas output. The substrate feeding rate is a crucial factor influencing biogas yield, as indicated by its markedly higher mean square (MS) relative to pH and error MS. The substantial F-value of 7.96 exceeds the critical F-value (Fcrit) of 4.196, demonstrating that fluctuations in substrate feeding rate between 34 and 95 kg/day significantly affect biogas production. The peak biogas output of 431 L/day occurred at the minimal feeding rate of 34 kg/day, underscoring the need to optimise feeding techniques to enhance biogas yield. The study performed a comparative examination of biogas production from the co-digestion of Indigofera plant waste and cow manure alongside other substrates. The biogas production rates recorded, ranging from 0.01 to 0.33 m³/kg of volatile solids, were comparable to those derived from various substrates: Sugar cane bagasse (0.2 m³/kg) (Dioha, 2013), Sisal fibre (0.176-0.216 m³/kg) (Mshandete, 2006), Neem leaves (0.15 m³/kg) (Dioha, 2013), and Wheat straw (0.16-0.25 m³/kg) of volatile solids (Sharma, 1988), respectively.
Moreover, the examination of the interaction between substrate feeding rate and pH yielded insights into their combined influence on biogas production. Despite a relatively low F-value of 0.98 for the interaction term, which was lower than the critical F-value, it is evident that within the pH range of 6-7, the interaction between substrate feeding rate and pH did not significantly impact biogas yield. This suggests that variations in substrate feeding rate and pH levels within the specified range did not synergistically influence biogas production. While substrate feeding rate emerged as a crucial factor affecting biogas production, the study indicates that pH and its interaction with substrate feeding rate did not exert significant effects. These findings underscore the importance of optimising substrate-feeding practices to enhance biogas yield in anaerobic digestion systems. Additionally, further investigation into additional factors influencing biogas production variability is warranted to advance our understanding and optimization of AD processes.
Table 2 Analysis of variance for the biogas production as the effect of pH and substrate feeding rate.
| Source of Variation | Sum of | Degree of | Mean | F | P-value | Fcrit |
|---|---|---|---|---|---|---|
| Squares | Freedom | Squares | ||||
| Substrate feeding rate | 107938.20 | 1 | 107938 | 7.96 | 0.009 | 4.196 |
| pH | 5954.13 | 1 | 5954.1 | 0.44 | 0.513 | 4.196 |
| Interaction | 13264.13 | 1 | 13264 | 0.98 | 0.331 | 4.196 |
| Within | 379694.47 | 28 | 13561 | |||
| Total | 506850.93 | 31 |
Table 3 Analysis of variance for the H₂S content as the effect of pH and substrate feeding rate.
| Source of Variation | Sum of Squares | Degree of Freedom | Mean Squares | F | P-value | Fcrit |
|---|---|---|---|---|---|---|
| Substrate feeding rate | 6991.53 | 1 | 6991.53 | 11.81 | 0.002 | 4.196 |
| pH | 1046.53 | 1 | 1046.53 | 1.768 | 0.194 | 4.196 |
| Interaction | 344.531 | 1 | 344.531 | 0.582 | 0.452 | 4.196 |
| Within | 16575.4 | 28 | 591.978 | |||
| Total | 24958 | 31 |
Table 3 delineates the comprehensive analysis of variance concerning hydrogen sulphide (H₂S) concentration, investigating the influences of pH and substrate feeding rate. The mean square (MS) of substrate feeding rate dramatically exceeds that of pH and their interaction, indicating a considerable impact on H₂S level. The elevated Fvalue of 11.81, beyond the crucial F-value of 4.196, indicates that alterations in substrate feeding rate significantly affect H₂S levels. In contrast, the influence of pH on H₂S concentration is not statistically significant, as evidenced by a low Fvalue of 1.768 (p > 0.05). Maintaining a pH within the range of 6-7 is essential for preventing the failure of the digestion process, highlighting its significance in biogas production. No significant interaction effect was identified between substrate feeding rate and pH on H₂S concentration in biogas produced from the co-digestion of Indigofera tinctoria and cow manure. Subsequent analysis indicates that the H₂S concentration in biogas generated from the 3000 L digester varies between 10 and 150 ppm, with an average concentration of roughly 38.8 ppm. The concentration is well below the safety criterion of 1000 ppm for petrol engine use, indicating the appropriateness of the generated biogas for engine use. The findings underscore the pivotal influence of substrate feeding rate on H₂S concentrations in biogas while also highlighting the necessity of pH regulation to ensure the efficacy of the digestion process.
Exploring Optimal Load Conditions and Efficiency Peaks
The dataset presented in Figure 6 provides a thorough analysis of the complex interplay between load (W), efficiency (%), and biogas flow rate (L/s), elucidating the total efficacy of the biogas production system. A steady rising trend is initially noticed when the load grows from 150 W to 1050 W, with both efficiency and biogas flow rate showing substantial enhancement. This indicates a direct association between load and biogas production efficiency, suggesting that elevated loads result in enhanced biogas production, along with increased gas flow—a trend aligned with expectations in anaerobic digestion systems. Upon deeper examination, a significant observation arises concerning the efficiency of biogas production. Efficiency typically increases with load, peaking at 24.76% at 700 W before suffering a minor decrease at 1050 W. These phenomena suggest the presence of an optimal load level, above which the system experiences diminishing returns in efficiency. Possible reasons for this drop may involve limitations in the digesting process or equipment capacity, highlighting the importance of optimising load conditions to enhance efficiency. The biogas flow rate demonstrates a consistent increase with the load, signifying a linear correlation between load and gas output. The flow rate commences at 0.3 L/s at 150 W and steadily escalates to 0.47 L/s at 1050 W, highlighting the system's capacity to manage increased loads and produce more significant quantities of biogas correspondingly. Comprehending the interplay between load, efficiency, and methane flow rate is essential for optimising biogas production systems. By determining appropriate load conditions, operators may improve efficiency, increase gas output, and guarantee the economic feasibility and sustainability of biogas production operations. Moreover, additional analysis, including the examination of factors affecting efficiency fluctuations at varying loads and the exploration of improvements to enhance efficiency at elevated loads, presents a potential for the advancement of biogas production technology and the promotion of more efficient and sustainable energy generation practices.
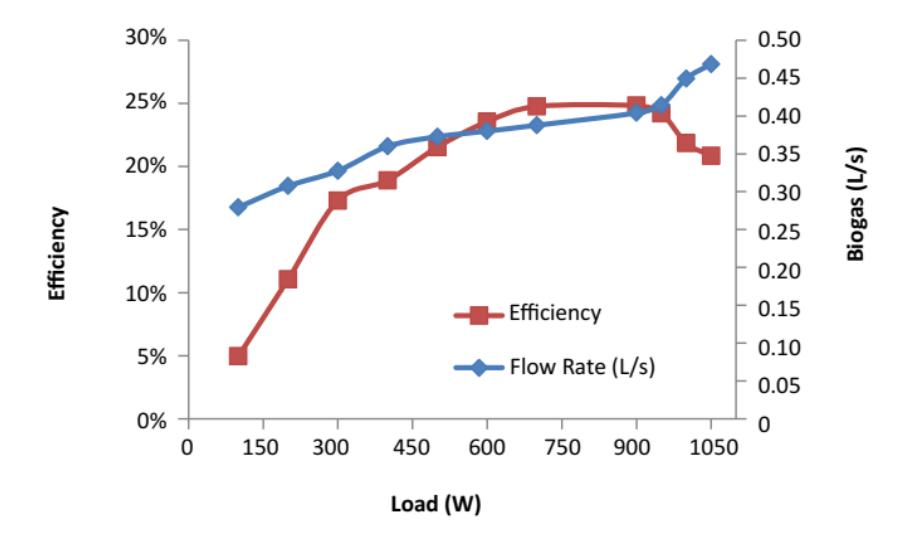
Figure 6 Efficiency of electric generators and the consumption of biogas required for electricity generation.
Conclusion
The research provides valuable insights into multiple facets of biogas production, including yield, hydrogen sulphide (H₂S) concentration, and the interaction among substrate feeding rate, pH, and biogas output. The analysis of biogas production dynamics indicated output swings between 100 and 800 litres per day, with pH significantly impacting biogas yield; ideal circumstances were noted at pH levels between 6 and 7. Furthermore, the substrate feeding rate proved to be a critical factor influencing biogas yield, underscoring the necessity to refine feeding techniques to enhance biogas production. Monitoring and regulating H₂S concentrations in biogas is crucial due to its toxicity and potential for environmental and mechanical harm. The research indicated that biogas generated from the co-digestion of Indigofera tinctoria waste and cow manure displayed comparatively low H₂S levels, with variations according to substrate composition. Enhancing the substrate ratio can effectively regulate H₂S concentrations, hence reducing the likelihood of corrosion in biogas utilization systems. The analysis of variance revealed a substantial impact of substrate feeding rate on biogas production, although pH showed no significant effect. Furthermore, no substantial relationship was detected between substrate feeding rate and pH regarding biogas yield. Comprehending these dynamics is essential for optimizing efficiency and guaranteeing the economic sustainability of biogas production systems. The analysis of the link among load, efficiency, and biogas flow rate indicated a direct relationship between load and efficiency, with efficiency reaching a maximum of 24.76% at a load of 700 W. However, beyond this threshold, efficiency demonstrated diminishing returns, signifying the presence of an ideal load level. This study enhances our comprehension of critical elements affecting biogas production and underscores the necessity of optimizing operational parameters to maximize biogas yield and efficiency. Additional investigation into substrate composition, pH management, and load optimization is promising for enhancing biogas production technology and promoting sustainable energy generation practices.
Acknowledgement
This research was entirely funded by the grant provided by the Ministry of Research, Technology, and Higher Education (Kementerian RISET DIKTI) and the Institute for Research and Community Service (LP2M) of Universitas Sebelas Maret (UNS).
Compliance with ethics guidelines
The authors declare they have no conflict of interest or financial conflicts to disclose.
This article contains no studies with human or animal subjects performed by authors.