
Introduction
Medical research has demonstrated that a significant number of the muscles and electromyography (EMG) signals associated with the hand and fingers remain quantifiable even following the amputation of the hand (Bi et al., 2019). Consequently, the identification, analysis, and classification of EMG signals are well-established areas of study, especially with respect to prosthetic hand technology. The development of rehabilitation devices, robotics, sensors, and artificial intelligence algorithms has a significant impact in assisting disabled people in their interactions with the environment (Phinyomark et al., 2018, Jaber et al., 2021c, Javaid et al., 2021).
Human motion intent can generally be used to analyze hand movements using various sensors, such as inertia measurement unit (IMU), camera, and data glove. However, these sensors only work when the human body is moving (i.e., it detects human intention at a physical level). As a result, such technologies are mostly used for healthy people instead of those who have lost a limb or suffer from nerve diseases. Moreover, these systems continue to face problems such as photosensitivity and change in distance and position (Sandhya et al., 2023). On other hand, recognizing human movement intent based on EMG signals, which are obtained from muscle contraction, provides more intuitive information than purely physical data (Hassan et al., 2020, Xiong et al., 2022).
Two approaches are widely used to determine the intention of human movements based on EMG signals. The first technique uses a kinematic model to predict movement and is suitable for low degree of freedom (DOF) movements, such as ankle movement (Xie, 2016). The second approach uses pattern recognition based on machine learning algorithms. Pattern recognition control (PRC) has the ability to recover a greater range of DOF movements, including hand gesture recognition (Essa et al., 2023a). PRC has been considered applicable to the extraction of useful information from EMG signals required to recognize human movement intent. An accurate and effective myoelectric PR system relies on extracting and selecting high-quality features (Farina et al., 2014, Abbas et al., 2024)
2Basrah University for Oil and Gas, Basrah 61001, Iraq
Several classifiers can be used to recognize human motion intent based on EMG signals, such as deep learning (Nan et al., 2019) and machine learning algorithms (Tepe et al., 2022, Darweesh et al., 2025). Wu et al. (2018) integrated long short-term memory (LSTM) and convolutional neural networks (CNNs) within a unified architecture to automatically extract features, thereby eliminating the need for conventional feature extraction techniques. Côté-Allard et al. (2019) and Chen et al. (2020) employed wavelet or short-term Fourier transform (STFT) analyses to EMG signals to facilitate their representation as images, which were subsequently input into a CNN architecture. Although effective, the CNN framework necessitates a substantial volume of data for training and requires substantial memory resources and computational time.
Essa et al. (2023b) and Narayan et al. (2021) used conventional features that can be extracted from EMG signals in the time domain (TD), frequency domain (FD), and time frequency domain (TFD). Pizzolato et al. (2017) introduced a public Ninapro dataset (DB5) for double Myo armbands. They used root mean square (RMS), TD, histogram (Hist), marginal discrete wavelet transform (mDWT) features, and a concatenation of these features based on support vector machine (SVM) and random forest classifiers. Hassan et al. (2020) used six-time domain features to classify seven gestures based on three machine learning algorithms; however, they found that using TD, FD, and TFD features can result in the loss of spatial features within different channels. Recently, many researchers have shown the robustness of spatial features compared to conventional features. Jaber et al. (2021a, 2022) extracted spatial features of high density (HD)-maps based on the Histogram Oriented gradient algorithm. Jordanic et al. (2017) identified spatial features using the modified mean shift algorithm. These studies utilized HD-maps based on RMS features to represent the HD-map similarly to an image, whereby individual pixels correspond to distinct channels. This representation enables the application of image processing techniques to extract various features.
This study proposes a spatial structural feature extracted from various HD-maps. An approach for conceptualizing EMG signals as HD-maps is introduced. EMG signals are characterized as HD-maps employing metrics such as RMS, mean absolute value (MAV), zero crossing (ZC), sign slope change (SSC), and waveform length (WL). The Combined Multi-HDmap (CMHD-map) was used for the explicit aim of feature extraction by virtue of its capacity to enhance the diversity of spatial features. This study establishes the impact of extracting intensity features from both individual HD-maps, and a combination of multiple HD-maps, on the classification accuracy. Furthermore, the effectiveness of the proposed spatial features is confirmed through a comparison with conventional TD features.
The structure of the paper is arranged as follows. Section 2 presents the computation of HD-maps and extraction of intensity features from these maps. The simulation results of the proposed structural features, comparison with classical TD features, and the performance of three classifiers is presented in section 3. Finally, the conclusions are presented in section 4.
Materials and Methods
EMG Pattern Recognition
Myoelectric pattern recognition system consists of four main stages: data acquisition, EMG pre-processing, feature extraction, and classification (Jaber et al., 2021b, Essa et al., 2022). An overview of myoelectric pattern recognition is shown in Figure 1.
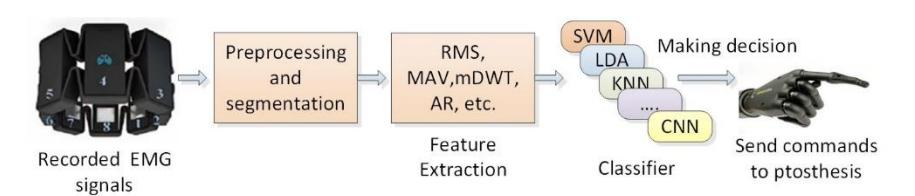
Overview of EMG pattern recognition.
In this study, EMG signals are obtained from a standard dataset (DB5 of Ninapro datasets). The DB5 contains EMG signals recorded using two Myo armbands. The Myo armband is characterized as an EMG device incorporating an ARM Cortex-M4 microcontroller unit comprising eight dry electrodes, a nine-axis inertia measurement unit (IMU), and Bluetooth low energy (BLE) models. EMG signals from the upper Myo armband are used (i.e., EMG signals of the first eight channels). DB5 contains ten subjects, each of which performs an ordered number of gestures. Each gesture is repeated six times. Each subject performed three exercises, hereafter A, B, and C. Exercise A contains 12 isometric and isotonic hand
movements, Exercise B contains 17 wrist movements, and exercise C involved 23 grasp movements (Rehman et al., 2018, Atzori et al., 2014). In this work, the sEMG signal of nine gestures from exercise B are considered; these include eight finger gestures and one wrist gesture.
Computing HD-maps
The informative representation obtained from EMG signals is of great importance in myoelectric PRC. In this study, spatial structural characteristics are derived from multiple HD-maps rather than the amplitude of electromyography (EMG) signals. The resultant HD-map illustrates the spatial configuration of EMG channels. In contrast, the process of feature extraction from separate channels followed by their integration into a unified vector may result in the loss of spatial information across numerous EMG channels. The HD-map is generated through the utilization of features derived from the amplitude of EMG signals relevant to channels, which are organized in an array, including RMS, MAV, ZC, SSC, and WL features.
The EMG signals corresponding to gesture i are partitioned into 1000 discrete sampling instants and are denoted as the matrix \(EMG = \{E_1(n), \dots, E_8(n)\} \in \mathbb{R}^{(N \times 8)}\), where n denotes the individual discrete sampling instant \(n = [1, 2, \dots, N]\) and N denotes the cumulative number of sampling points contained in the EMG signal. At the temporal instance t, the vector \(\{E_1, \dots, E_8\}\) comprises the measurements derived from the eight channels of the Myo sensor. The EMG matrix is formulated as HD-map as follows:
\[RMS(x(n)) = \sqrt{\frac{1}{N} \sum_{n=1}^{N} x(n)^{2}}\] \[RMS - map = RMS(\{E_{1}(n), \dots, E_{8}(n)\})\] (1)
\[MAV(x(n)) = \frac{1}{N} \sum_{n=1}^{N} |x(n)|\] \[MAV - map = MAV(\{E_1(n), \dots, E_8(n)\})\] (2)
\[ZC(x(n)) = \sum_{n=1}^{N-1} \begin{bmatrix} sgn(x(n) \times x(n+1)) \cap \\ |x(n) - x(n+1)| \ge thre \end{bmatrix}\]
\[sgn(x) = \begin{cases} 1, & \text{if } x \ge thre \\ 0, & \text{otherwise} \end{cases}\] \[ZC - map = ZC(\{E_1(n), \dots, E_8(n)\})\] (3)
\[SSC(x(n)) = \sum_{n=2}^{N-1} \begin{bmatrix} f[(x(n) - x(n-1)) \times \\ (x(n) - x(n+1)] \end{bmatrix}\] \[f(x) = \begin{cases} 1, & \text{if } x \ge \text{thres} \\ 0, & \text{otherwise} \end{cases}, \text{ where thre = threshold value}\] \[SSC - map = SSC(\{E_1(n), \dots, E_8(n)\})\] \[(4)\]
\[WL(x(n)) = \sum_{n=1}^{N} (|x(n) - x(n-1)|)\] \[WL - map = WL(\{E_1(n), \dots, E_8(n)\})\] (5)
where x denotes the EMG signal at a specific channel, n is the sampling instant of x, and N denotes the length of signal x. Moreover, this study proposes the integration of multiple HD-maps for feature extraction in order to increase the number of features; this results in an improved classification accuracy. The combination of multiple HD-maps is denoted as the CMHD-map as described above. The CMHD-map is represented as a matrix corresponding to five HD-maps, each of which is computed for eight channels.
Feature Extraction
Spatial features contain rich information from EMG signals within channels. Commonly, features are extracted from individual channels then concatenated into a single feature vectors, such as TD, FD, and TFD features. The spatial features confirm the intermuscular synergy between muscles when producing a movement; however, they lack spatial information through different channels.
This research focuses on extracting intensity features from HD-maps. The relationship between EMG amplitude and generated force are nonlinear (Jordanic et al., 2016), leading to the calculation of the intensity feature as the common logarithm of the HD-map as follows:
\[I = log_{10}(HD - map) \tag{6}\]
Intensity features represent the spatial distribution of individual channels. In this study, the impact of intensity features on the classification accuracy was examined, using features extracted from both individual HD-maps and the CMHDmap.
Conventional TD features are used to compare with the proposed spatial structure features. TD features are selected as the same features used for calculating HD-maps and include RMS, MAV, WL, ZC, and SSC. TD characteristics are typically computed individually from every channel and then combined into a unified feature vector. A schematic block diagram of the proposed work is shown in Figure 2.
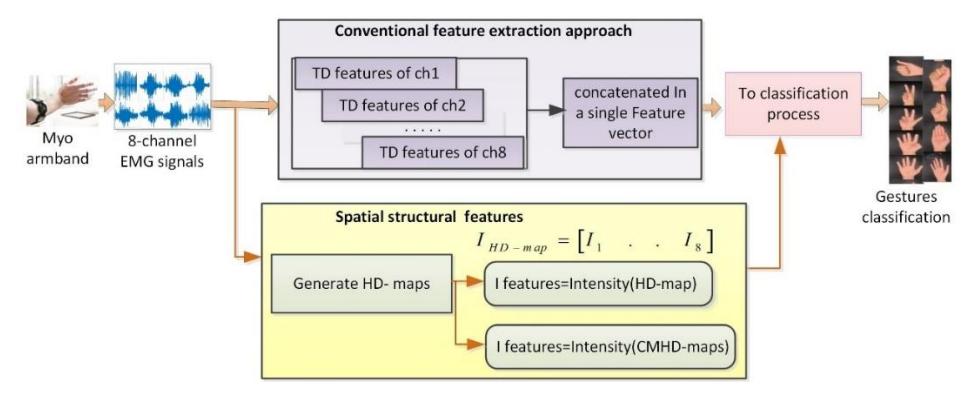
Schematic block diagram showing the process by which conventional TD features and intensity features obtained from HD- maps are extracted.
Classification
In this study, three types of machine learning algorithms are used, namely Linear Discriminate Analysis (LDA), SVM, and K-nearest neighbor (KNN). The test sample is predicted using the KNN classifier by expansion of its region to encompass all K training samples, followed by the utilization of a majority vote from the K training samples to identify the test sample. The SVM classifier is responsible for mapping the data into a high-dimensionality feature space, which allows for the classification of the data samples. This data transformation is achieved through the utilization of a mathematical function known as the kernel function. The SVM classifier provides a range of kernel functions, such as linear, polynomial, radial basis function (RBF), and sigmoid (Hassan et al., 2020).
Similarly to the SVM classifier, the LDA classifier is tasked with the identification of a hyperplane that can effectively differentiate between various categories. The LDA classifier fundamentally depends on the assumption that the data follows a normal distribution. The hyperplane is obtained by constructing a model that increases the distance between classes and decreases the variance within the category.
The accuracy (Acc) of the classifier is defined as the number of correctly predicted samples over all tested samples. Classification accuracy and error rate are calculated as follows:
\[Acc = \frac{No. of \ correctly \ predicted \ samples}{total \ tested \ samples} \times 100 \tag{7}\]
Error Rate \[(ER) = 1 - Acc\] (8)
Classification performance is calculated based on the confusion matrix using precision, sensitivity, and F1_score as follows:
\[S = \frac{TP}{Tp + TN} \tag{9}\]
\[P = \frac{TP}{TP + FP} \tag{10}\]
\[F1\_Score = \frac{2 \times TP}{2 \times TP + FP + TN} \tag{11}\]
Where TP is true positive, TN is true negative, and FP is false positive (Jaber et al., 2020, Sahm et al., 2024). In this study, our work is evaluated using the public dataset Ninapro DB5. Nine gestures are chosen to test the performance of our method. The classifier is trained using 50% of the dataset (i.e., three trials are used for training) and tested on the remaining data. The kernel function of the SVM classifier used in this study is a basis radial function based on the LIBSVM library (Chang et al., 2011).
Results
Performance based on individual HD-maps and CMHD-map
This experiment shows the effect of extracting intensity features from single HD-maps and combination of multiple HDmaps. Figure 3 shows the accuracy based on intensity features extracted from RMS-map, MAV- map, WL-map, ZC-map, and SSC-map. The intensity attributes extracted from the RMS-map, MAV-map, and WL-map demonstrated superior accuracy relative to those from the ZC-map and SSC-map.
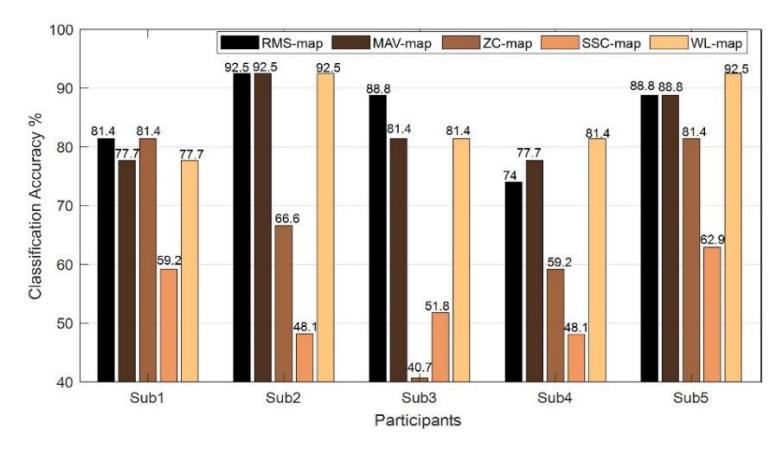
Classification accuracy of intensity features extracted from various individual HD-maps.
Furthermore, the intensity features manifested by the CMHD-map surpassed the efficacy of the separate maps. The improvement rates achieved were approximately 0.8%, 3.8%, 31.9%, 38.8%, and 2% when compared to RMS map, MAV map, ZC map, SSC map, and WL map, respectively. Table 1 shows the average classification accuracy utilizing individual HD-maps and the CMHD-map, covering ten subjects.
Table 1 Average classification accuracy among ten subjects using separate HD-maps and the CMHD-map.
| RMS-map | MAV-map | ZC-map | SSC-map | WL-map | CMHD-map | |
|---|---|---|---|---|---|---|
| Average classification accuracy% | 87.7 | 84.7 | 56.6 | 49.58 | 86.5 | 88.5 |
The performance of the classifier based on the intensity features extracted from CMHD-maps was evaluated for ten subjects. Performance was evaluated in term of precision, sensitivity, and F1_Score as shown in Figure 4. The mean of P, S, and F-Score of ten subjects is 92.6%, 88.5%, and 87.87 respectively. The proposed features are shown to achieve a high recognition rate.
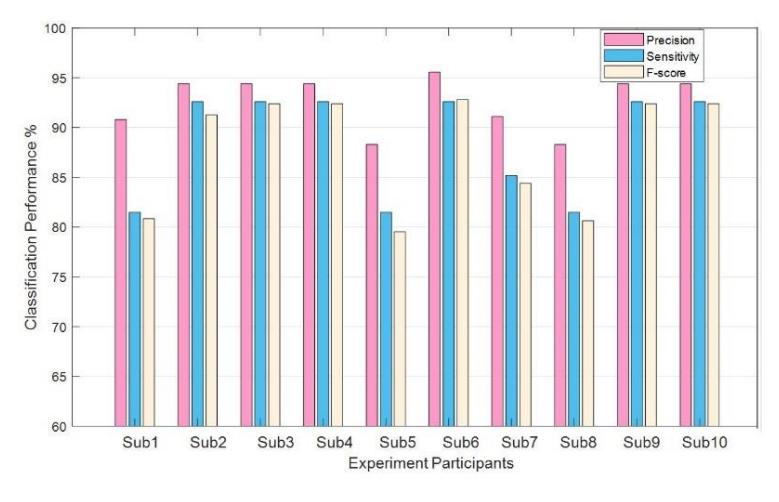
Classification performance based on the proposed structural features.
3.2. Comparison with conventional TD features.
To show the utility of spatial structural features, a comparison is made with conventional TD features. The proposed structural features are the intensity features extracted from the CMHD-map. Five TD features are selected (i.e., the same features used for HD-maps) in order to show the effect of spatial features relative to traditional approaches. The TD features are RMS, MAV, WL, ZC, SSC and the error rate for five subjects is shown in Figure 5.
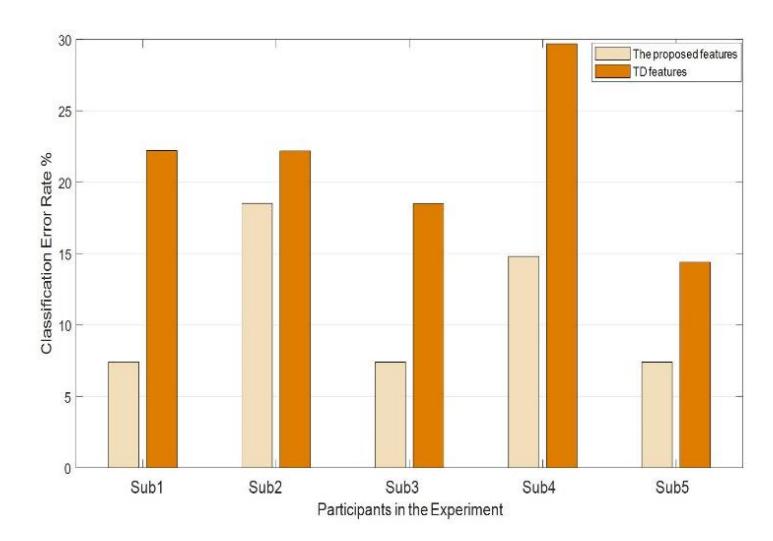
Classification error rate of the SVM classifier based on the proposed features and conventional TD feature.
The average error rates among five subjects are 10.44%, increasing to 18.2% for the proposed and TD features, respectively. It is observed that the proposed structural features lead to a reduction in the error rate relative to conventional TD characteristics. The error rate of the proposed work decreases by approximately 7.76% compared to traditional TD features. These findings validate that characteristics derived from the spatial arrangement of channels exert a considerable influence on accuracy, indicating the presence of consistent information across diverse EMG channels. EMG signals are characterized as non-stationary in nature; nonetheless, these signals encompass spatially unchanging information across channels.
Effect of the proposed structural features on different machine learning classifiers.
Three machine learning classifiers are used to evaluate the intensity features extracted from the CMHD-map, namely LDA, KNN, and SVM. The classification accuracy of the proposed structural features based on these three classifiers is shown in Table 2, demonstrating that the SVM classifier achieved higher accuracy than the LDA and KNN classifiers. However, it is noted that LDA and KNN also achieved acceptable accuracy. The SVM classifier achieved an improvement rate of approximately 1.9% and 6.3% compared to KNN and LDA, respectively.
| Table 2 | Classification accuracy of three classifiers based on CMHD-map features. | ||||||
|---|---|---|---|---|---|---|---|
| Experiment | Accuracy % | ||||||
| Experiment | Accuracy % | ||
|---|---|---|---|
| participants | LDA | KNN | SVM |
| Sub1 | 81.4 | 81.4 | 81.4 |
| Sub2 | 88.8 | 96.3 | 92.5 |
| Sub3 | 77.7 | 85.19 | 92.5 |
| Sub4 | 77.7 | 85.19 | 92.5 |
| Sub5 | 66.6 | 81.4 | 81.4 |
| Sub6 | 81.4 | 88.8 | 92.59 |
| Sub7 | 81.4 | 81.4 | 85.19 |
| Sub8 | 81.4 | 81.4 | 81.4 |
| Sub9 | 96.3 | 88.8 | 92.5 |
| Sub10 | 88.8 | 96.3 | 92.5 |
| mean | 82.2 | 86.6 | 88.5 |
Discussion
This study introduces an innovative approach for capturing spatial features through the utilization of multiple HD-maps. Traditional features, such as TD features, can achieve a remarkable performance in extracting temporal features; however, the loss of spatial information across various channels remains a challenge. This research presents a strategy for formulating EMG signals captured via a multi-channel sensor. EMG signals are represented as numerous HD-maps, a formulation that can be used as an input during the feature extraction stage. The influence of various HD-maps, specifically the RMS-map, MAV-map, SSC-map, ZC-map, and WL-map, are considered as shown in Figure 3. It is important to note that the intensity features derived from the RMS-map and WL-map attained a higher accuracy relative to those obtained from other HD-maps.
Furthermore, this study proposes the integration of multiple HD-maps for the purpose of feature extraction. The CMHDmap augments the quantity of spatial features and demonstrates superior performance relative to individual HD-maps, as shown in Table 1. Spatial features extracted from the CMHD-map demonstrate a notable level of accuracy in contrast to conventional TD features within the same experimental conditions, as shown in Figure 5. The CMHD-map features validate that despite the temporal instability of EMG signals, a consistent amount of spatial information is present across channels.
A comparison with the state-of-the-art approaches is shown in Table 2. The studies used for comparison vary in several aspects, including the number of gestures, selection of features, and classification method. Nevertheless, all of these studies confirmed their findings using the identical data collection method, namely DB5. The proposed structural features have therefore outperformed previous approaches. Specifically, it was shown that the spatial features achieved higher classification accuracy in the proposed work and Xiong et al. (2022) than in other studies.
A limitation of this work is that a limited number of hand gestures (nine) are evaluated. Future work should seek to augment the number of gestures that show substantial differences from the existing examined set. Additionally, future research should assess adaptations to intrapersonal variability, since the EMG signals corresponding to a specific user may change over time owing to several factors, including muscle fatigue, electrode displacement, and environmental disturbances. To account for these variabilities, future research may employ online learning methodologies to facilitate the ability of the classifier to incorporate new data and adapt to changing conditions.
The identification of hand gestures has the capacity to revolutionize a diverse array of fields, such as prosthetic technology for those who have experienced limb loss, robotics, and sophisticated human–computer interfaces. The advancements realized within this sphere may ultimately result in significant improvements in the quality of life and functional independence for numerous individuals.
| Research | Gestures | Feature set | Classifier | Accuracy% |
|---|---|---|---|---|
| Pizzolato et al., 2017 | 41 | RMS, TD, mDWT, Histogram, All | Machine learning | 55.31 % |
| Chen et al., 2020 | 12 | CWT+EMGnet | CNN | 69.6 |
| Sri-iesaranusorn et al., 2021 | 41 | RMS, MAV, MAVS, ZC, SSC, and WL | Deep NN | 71.78 |
| (Xiong et al., 2022 | 11 | Spatial features extracted by SPD manifold | Machine learning | 84.52 |
| This study | 9 | Intensity features CMHD maps | Machine learning | 88.5 |
Table 3 Comparison between the proposed work and previous works.
Conclusion
The identification of EMG signals has many applications, such as in biomedical applications, robotic arms, and automation control systems. This work proposes an informative approach for hand gesture recognition based on 8 channel sEMG signals obtained using a Myo armband. The approach developed depends on the spatial locations of EMG channels. Spatial structural information is obtained from five TD maps (i.e., RMS-map, MAV-map, SSC-map, ZC-map, and WL-map) and intensity features are extracted from TD maps.
Utilizing three distinct machine learning algorithms shows that the proposed approach attained a high level of classification accuracy. The SVM classifier demonstrated superiority over alternative classifiers. Specifically, the SVM classifier exhibited an average improvement in classification accuracy of approximately 6.3% and 1.9% relative to LDA and KNN, respectively. The classification performance of the proposed work was also evaluated against the traditional
TD characteristics. The mean classification accuracy across five participants was observed to be approximately 88%, reflecting an enhancement of around 6.8% relative to conventional TD features.
Acknowledgment
The authors express their gratitude to the University of Basrah, specifically the Computer Engineering Department, for their continuous and significant support..
Compliance with ethics guidelines
The authors declare they have no conflict of interest or financial conflicts to disclose.
This article contains no studies with human or animal subjects performed by authors.