
Introduction
Indonesia emerged as the top global palm oil producer, generating a total of 46.98 million tons in 2023 (Statista, 2024). The palm oil industry produces a variety of by-products, including fiber (12–15)%, shell (6–7)%, and empty fruit bunches (21–23)% (Abnisa et al., 2013), which hold significant potential as renewable resources into valuable materials such as adsorbent, fuels, semiconductor, and other derivatives. Palm kernel shell (PKS) is one of the most promising lignocellulosic residues due to its high carbon content and solid density of 520 - 620 kg/m3. Meanwhile, the activities of the textile industry account for approximately 10% of global greenhouse gas emissions and 20% of worldwide wastewater generation, becoming a primary contributor to environmental degradation. The effluent discharged from textile operations often contains hazardous substances, including synthetic dyes like methylene blue (MB), which are non-biodegradable and toxic to aquatic ecosystems and human health (Ahmad et al., 2024; El Jery et al., 2024; Zulkania et al., 2020). This underscores the urgent need for effective and sustainable water treatment technologies. Among several remediation approaches, adsorption has garnered considerable attention due to its simplicity, cost-
Copyright ©2025 Published by IRCS - ITB J. Eng. Technol. Sci. Vol. 57, No. 4, 2025, 559-572 ISSN: 2337-5779 DOI: 10.5614/j.eng.technol.sci.2025.57.4.10
1Chemical Engineering Department, Universitas Sebelas Maret, Jalan Ir. Sutami 36A, Surakarta 57126, Indonesia
3Research Center for Environmental and Clean Technology, National Research and Innovation Agency (BRIN), Building 720, K.S.T. B.J Habibie, Jalan Raya Serpong, South Tangerang 15314, Indonesia
4Chemical Engineering Department, Institut Teknologi Kalimantan, Jalan Soekarno Hatta Km. 15, Balikpapan 76127, Indonesia
effectiveness, and high efficiency in dye removal. Pyrolyzed activated carbon (AC) is especially popular because of its high surface area and porosity. However, the performance of AC largely depends on the composition of the biomass and the preparation method. PKS, a lignocellulosic biomass, contains 53.6% lignin, 14.7% cellulose, and 16.4% hemicellulose (Waluyo, Purba, et al., 2025), with 70.45% of volatile matter at 48.25% fixed carbon content (Waluyo et al., 2018). The high carbon content in the biomass contributes directly to a greater char yield during pyrolysis, which is essential for achieving a high activated carbon yield (Feng et al., 2020). Additionally, the substantial lignin content plays a crucial role, as lignin is more thermally stable and carbon-rich compared to cellulose and hemicellulose, which creates a more advanced porous structure during activation. Meanwhile, the moderate levels of cellulose and hemicellulose facilitate pore formation through their decomposition, thereby aiding the development of surface area and adsorption sites. These lignocellulosic characteristics of PKS thus make it a highly suitable and sustainable feedstock for high-performance activated carbon production (Kopp Alves et al., 2024). However, other biomass sources such as Napier grass, rubberwood, bamboo, and hemp have also been investigated for activated carbon production, demonstrating varied physicochemical properties and adsorption efficiencies (Khruengsai et al., 2024).
While lignin contributes to a higher char yield due to its thermal stability, its complex aromatic structure often hinders pore development and accessibility to internal surfaces, thus limiting adsorption performance. Therefore, pre-treatment processes such as delignification are essential to reduce the lignin content and expose more cellulose and hemicellulose structures (Purba et al., 2023). These carbohydrates decompose more readily during pyrolysis, promoting better pore formation and surface area development.
A current study revealed that the adsorption performance of PKS-based AC (1.02 mg/g) and MAC (2.4 mg/g) is relatively low at equilibrium in the methyl orange adsorption study (Waluyo, Rahmawati, et al., 2025). Therefore, pre-treating the carbon source is required to enhance its physical and chemical properties. Delignification is a crucial step in improving the properties of biomass for use as an adsorbent. Typically, it removes lignin using alkaline solutions, which also improves porosity, surface chemistry, and adsorption capacity of the carbon source. Studies have shown that delignified biomass results in higher adsorption efficiencies. One of them highlighted that delignification significantly increases the development of micro- and mesopores (Grönquist et al., 2019). Other researchers also emphasized the role of lignin removal in producing high-surface-area carbon suitable for environmental applications (Kumar et al., 2021; Tanis et al., 2023). Moreover, DMAC from bamboo has been applied to sulfadiazine separation, showing the adsorption capacity of 645.08 mg/g (Yang et al., 2023).
In addition to delignification, the incorporation of ZnCl₂ as an activating agent and iron ions as a magnetic precursor further enhances adsorbent functionality. ZnCl₂ promotes aromatic condensation, inhibits volatile release, and improves carbon yield and surface morphology (Bhoi et al., 2020). The adsorbent made from magnetized-AC using Fe2+/Fe3+ (FeCl₂ and FeCl₃) can be separated from the treated water effortlessly through an external magnetic field, which improves the operational practicality of water treatment systems (Wu et al., 2023; Yang et al., 2023).
Therefore, this study investigates the synthesis and adsorption performance of AC and MAC derived from delignified and non-delignified PKS, by exploring the effect of delignification on pore structure development, adsorption capacity, and dye removal, integrating magnetization and chemical activation methods, followed by isotherms and kinetics analysis. This work aims to develop a sustainable, high-performance adsorbent for removing methylene blue dye, supporting greener and more efficient wastewater treatment solutions.
Materials and Methods
Materials
The PKS used as the primary material was sourced from PT Kayan Lestari's oil palm plantations in East Kalimantan. The chemicals for the experiments included NaOH (98%, Sigma Aldrich) as the delignification alkali. For magnetic carbon synthesis, FeCl3·6H2O (97%, Sigma Aldrich) and FeCl2·4H2O (99%, Sigma Aldrich) were used, along with ZnCl2 (98%, Sigma Aldrich) as the activator. Methylene Blue (95%, Sigma Aldrich), dissolved in distilled water, served as the adsorbate in the adsorption tests.
Magnetic Precursor Preparation
PKS Delignification
The reduction of lignin content in palm kernel shells (PKS) was achieved through a delignification process using a 4% (w/v) NaOH solution. The PKS was soaked in NaOH solution at 85°C for approximately 2-3 hours to partially remove lignin. Afterward, the excess of chemicals in the PKS was thoroughly washed with distilled water. The delignified PKS was then dried in an oven at 80°C for 12 hours (Waluyo et al., 2024).
Delignified PKS Magnetization and Activation
Delignified PKS was magnetized using the co-precipitation method. Initially, 16 g of precursor was added to a solution by dissolving 18.22 g of FeCl3 · 6H2O and 6.7 g of FeCl2 · 4H2O in 400 mL of distilled water. The mixture was stirred for 30 minutes at 80°C to facilitate magnetization. Subsequently, the shells were rinsed with distilled water to remove attached Fe3O4, and the precursor was dried for 8 hours at 80°C. The magnetic delignified PKS was then introduced to a 50% ZnCl2 solution as an activator in a ratio of 1:4 (w/w); the solution must adequately permeate the PKS for impregnation. The material was stirred in the solution for 24 hours at room temperature. Afterwards, the impregnated material was heated in an oven at 90°C for 12 hours (Yang et al., 2023).
Afterward, the dried activated precursor was placed in a pyrolizer (furnace), which operated at 700°C for 30 minutes with the heating rate at 1.2°C/s (Waluyo et al., 2018). Higher temperature and heating rate lead to faster secondary decomposition in biomass, which maximizes liquid/bio-oil and gas products (Waluyo, Purba, et al., 2025). The moderate heating rate (1-10°C/s) in intermediate pyrolysis enables a gradual release of volatiles, promoting better pore formation and preventing the agglomeration or densification that is often observed in slow pyrolysis. Additionally, this process potentially generates 40 wt% of char and 40 wt% of bio-oil (Jerzak et al., 2022). This makes intermediate pyrolysis an ideal method for producing high-quality porous carbon suitable for applications in adsorption. After the process completion, the magnetic activated carbon was rinsed with 0.1 M HCl, then washed multiple times with demineralized water until the filtrate reached neutrality. Finally, the MAC was dried and kept in a desiccator to maintain its quality.
Characterization
Fourier-transformed infrared (FTIR) was employed to indicate the lignin content in the precursor, both for delignified PKS (DP) and pure PKS (NDP). The morphological state of PKS carbon was assessed using scanning electron microscopy (SEM) analysis at 3000x magnification for delignified activated carbon (DAC), delignified magnetic activated carbon (DMAC), non-delignified activated carbon (NDAC), and non-delignified magnetic activated carbon (NDMAC) (Potts et al., 2019). Fe2+/Fe3+ molecules that have been effectively produced on PKS magnetic activated carbon were detected using X-ray diffraction (XRD).
MAC Adsorption Experiment, Isotherm, and Kinetic Study
In the assessment of adsorption capacity, dye removal, and adsorption isotherms, feedstock, activated carbon, and magnetic activated carbon, both delignified and non-delignified, were tested in MB solutions at varying concentrations (25– 45 mg/L). Each precursor (10 mg) was introduced into a centrifuge tube, followed by 10 mL of MB dye at a specific concentration. When the equilibrium phase was reached, the solution was filtered. The absorbance of the residual solution was measured using a UV-Vis spectrophotometer, and the ideal wavelength was found to be 665 nm with a shoulder at 610 nm, both before and after adsorption (Selvam & Sarkar, 2017)to indicate the adsorption capacity and percentage dye removal.
In adsorption studies, the MB adsorption capacity (qe) and the percentage of MB removed (% removal) were calculated using Eqs. (1) and (2), respectively. The isotherms were analyzed using both the Langmuir and Freundlich models. The Langmuir model assumes monolayer adsorption occurs on a uniform surface with identical energy levels at all active sites, and it considers negligible interactions between adsorbed molecules. Conversely, the Freundlich model describes adsorption on a heterogeneous surface where the adsorption sites have different affinities. (Kurnia et al., 2022). The Langmuir and Freundlich isotherm models are derived from Eqs. (3) and (4), respectively. Additionally, the n value in Eq. 4 helps identify the nature of the adsorption process: linear (n = 1), chemical (n < 1), or physical adsorption (n > 1). (Mohammadzadeh et al., 2023; Sahoo et al., 2014). Equally crucial, the dimensionless separation factor (RL) indicates the shape of the isotherms to be either unfavourable (RL > 1), linear (RL = 1), favourable (0 < RL <1), or irreversible (RL = 0). It was determined through Eq. (5) that the adsorption kinetics of the dye and the diffusion velocity of dye molecules in the pores can be studied. Furthermore, kinetic models can be used to determine the adsorption rate, absorption rate, and mechanism, as well as the adsorption efficiency of the adsorbent. The kinetic investigation involved subjecting 5 mg of each precursor to a 5 mL solution of 35 mg/L MB in a centrifuge tube over a range of variant retention times (15 – 180 min). The kinetic model delineates time-dependent adsorption and reaction trends (Rezakazemi & Shirazian, 2019). The pseudo-first-order (PFO) and pseudo-second-order (PSO) kinetic calculations (Somsesta et al., 2020), referenced in Eq. (6) and Eq. (7), respectively.
\[qe = \frac{V(Co - Ce)}{m} \tag{1}\]
\[\%removal = \frac{(Co-Ce)}{Co} \times 100\%\] (2)
\[qe = \frac{qm \cdot k_L \cdot Ce}{1 + k_L \cdot Ce} \tag{3}\]
\[qe = (k_F \cdot Ce^{1/n}) \tag{4}\]
\[R_L = \frac{1}{1 + k_L \cdot Co)} \tag{5}\]
\[\frac{1}{Q_t} = \frac{k_1}{Q_1} \cdot \frac{1}{t} + \frac{1}{Q_1} \tag{6}\]
\[\frac{1}{Q_t} = \frac{1}{k_2 \cdot Q_2^2} + \frac{t}{Q_2} \tag{7}\]
Results
Precursor Characterization
Lignin Degradation
The FTIR spectra shown in Figure 1 highlight a slight concave feature in the DP at 3600–3200 cm<sup>-1</sup>, corresponding to the stretching vibration of O–H stretching from aliphatic hydroxyl and phenolic groups. The untreated PKS spectrum was characterized by a broad hydroxyl band, indicating a reduction in non-cellulosic components, possibly lignin, in the DP. Additionally, an aromatic skeletal vibration band associated with lignin's phenylpropane units is observed at 1570 cm<sup>-1</sup> in both spectra (Pourbaba et al., 2024). Similarly, peaks at 1175 cm<sup>-1</sup> and 833 cm<sup>-1</sup> also indicate the presence of lignin. Notably, the reduced intensity of the aromatic skeletal vibration peak in the DP spectrum compared to untreated PKS indicates a decreased lignin content in the delignified material (Boeriu et al., 2004). The isolated cellulose content ranged from 30% to 40% of the total weight.
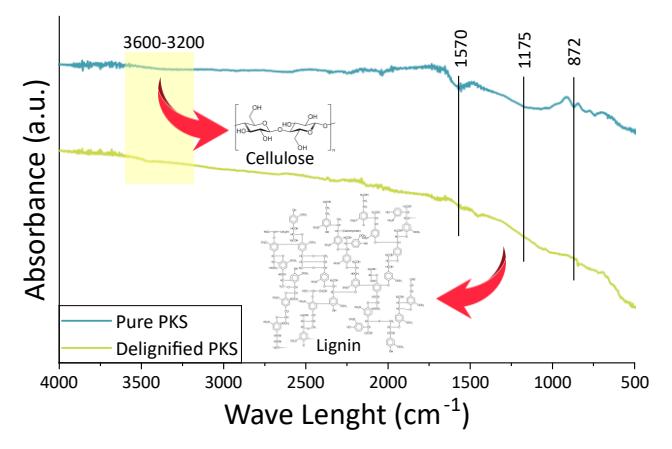
Figure 1 FTIR spectra of functional groups in pure and delignified PKS
Scanning Electron Microscope
The SEM analysis conducted at 3000x magnification provided insights into the microscopic structure of both AC and MAC derived from PKS, including both DMAC and NDMAC. The activation and magnetization enhanced the surface voids of PKS. Particularly, DMAC exhibited greater porosity than DAC, as shown in Figures 2a and 2b. DMAC displayed numerous elongated macro- and micro-scale pores, with larger cavities compared to DAC. The addition of iron ions
(Fe2+/Fe3+) and activating agents significantly promoted pore development in magnetic activated carbon. Similarly, NDMAC showed higher porosity than NDAC, as illustrated in Figures 2c and 2d. NDAC presented smaller and more irregularly distributed pores, whereas NDMAC had larger, more evenly distributed pores. These findings suggest that delignification is key to creating larger and more evenly distributed pores in PKS compared to its non-delignified counterpart. The addition of iron ions was found to play a dual role in enhancing pore development during carbonization. Specifically, these ions formed Fe₃O₄ nanoparticles that acted as catalysts during the pyrolysis process (Figure ), promoting the decomposition of the carbon precursor and facilitating the formation of both micropores and mesopores. This catalytic action not only helped create a more porous structure in the MAC but also contributed to a more uniform pore distribution. Consequently, in the case of non-delignified samples, NDMAC exhibited higher porosity than NDAC because the presence of iron ions enhanced pore expansion and connectivity, even without the delignification pretreatment.
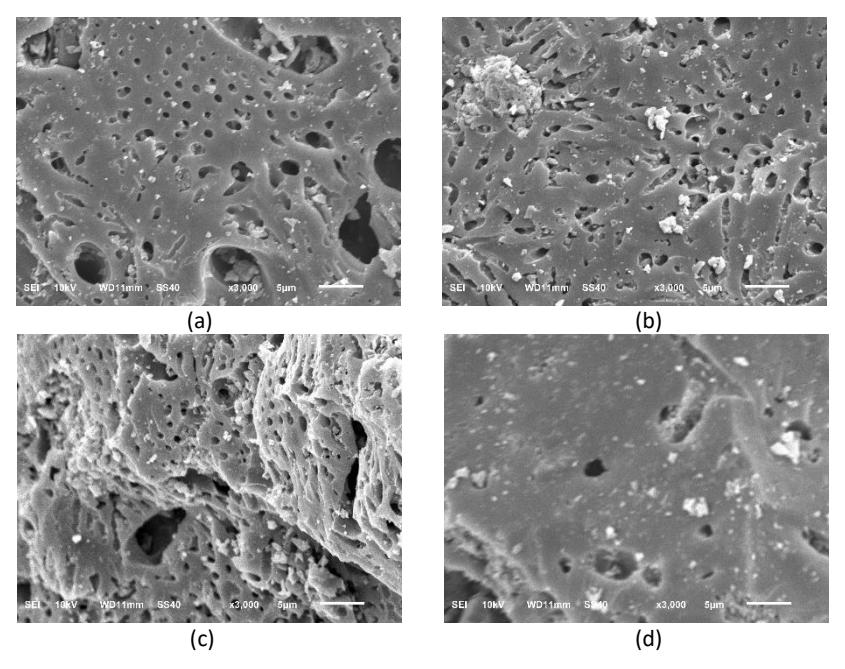
Surface analysis of a) DAC, b) NDAC, c) DMAC, and d) NDMAC.
X-Ray Diffraction
Figure 3 displays the XRD diffraction patterns for DP, DAC, and DMAC, revealing broad diffraction peaks indicative of structural transformations from organic crystals to finer graphite structures following high-temperature carbonization. Notably, DMAC exhibits three distinct Fe peaks at 31.68°, 36.14°, and 56.45°, confirming the successful synthesis of Fe3O4 integrated with activated carbon. Figure 3 also showcases the XRD diffraction patterns of NDP, NDAC, and NDMAC, mirroring the XRD analysis results for delignified biochar. The graph underscores the transition of the structure of nondelignified magnetic activated carbon from a crystalline compound to a crystalline compound with a graphite structure due to carbonization. Significantly, in NDMAC, three Fe peaks at 31.7°, 36.1°, and 47.3° signify the successful synthesis of Fe3O4, even in NDMAC.
Adhering to Figure 3, it can be inferred from the data that the DMAC exhibits superior quality compared to NDMAC, as evidenced by its elevated peak. The peak, representing the intensity of X-rays diffracted at a specific angle, signifies a higher level of diffracted X-ray intensity. This indicates a uniform atomic interplanar distance among crystals in the sample, leading to a more organized structure. Notably, the relevant peak in this instance corresponds to Fe3O4.
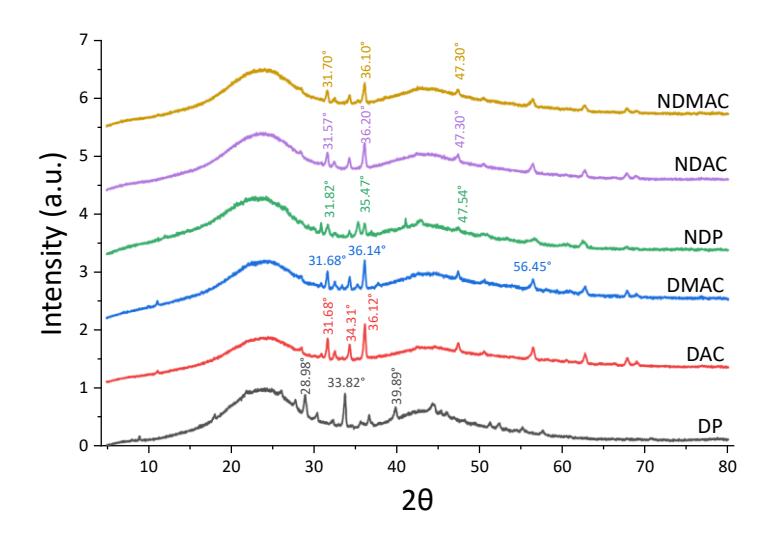
X-ray diffraction of DP, NDP, DAC, NDAC, DMAC, and NDMAC
Adsorption Study on MB Solution
Effect of Initial Methylene Blue Concentration on Adsorption and MB Removal
The adsorption capacity and dye removal efficiency of various activated carbon types were measured at different initial methylene blue (MB) concentrations (25–45 mg/L), as shown in Figure 4. Adsorption capacity increased with higher initial MB concentrations for all adsorbents. At 25 mg/L, the adsorption capacity ranged from 13.27 mg/g (NDP) to 21.85 mg/g (DMAC), and at 45 mg/L, it increased to a range of 17.16 mg/g (NDP) to 35.32 mg/g (DMAC). Among all adsorbents, DMAC consistently showed the highest adsorption capacity at each concentration level.
Dye removal efficiency showed a decreasing trend with increasing initial MB concentration. At 25 mg/L, removal efficiencies varied from 53.08% (NDP) to 80.24% (DAC), while at 45 mg/L, values decreased to 38.13% (NDP) and 78.49% (DMAC). Across all tested concentrations, DMAC exhibited the highest dye removal percentages among the adsorbents, and NDP recorded the lowest values. A two-way ANOVA test (α = 0.05) confirmed that both the initial MB concentration and the treatment type (delignification and/or magnetization) had a statistically significant effect on adsorption capacity and dye removal percentage, with p-values < 0.05.
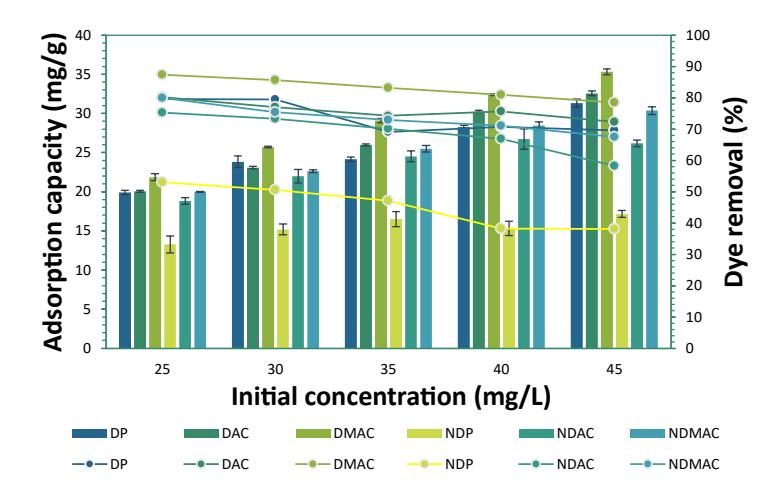
Initial concentration effect on Adsorption capacity (block) and dye removal (line)
Isotherm Models
Based on the data experiment and complying with the equation mentioned in the previous section. Figures 5a and 5b show the relationship between Ce and qe/Ce for DMAC and NDMAC. With a slope of 1/qm and an intercept of 1/qm KL, a straight line was generated. Ce and qe indicate the concentration and adsorbing capacity at the saturated phase of the MB solution (monolayer), and KL indicates the affinity of the adsorbate to the activated carbon on the surface. A maximum adsorption (qm) value of 50.2513 mg/g, a KL value of 4.1457, and an R2 value of 0.999 are obtained from Figure 5a, a slope of 0.0199, and an intercept of 0.0825. Conversely, in Figure 5b, the slope is 0.0232 with an intercept of 0.1446, resulting in a qm value of 43.1035 mg/g, a KL value of 6.2328, and an R² value of 0.9897. The Freundlich parameter can be determined from Figure 5c, which exhibits a slope of 0.4252 and an intercept of 1.1337, yielding an R² value of 0.9961. Additionally, Figure 5d demonstrates a slope of 0.4072 with an intercept of 1.0107 and an R² value of 0.9892. The parameters of both models were detailed in Table 1.
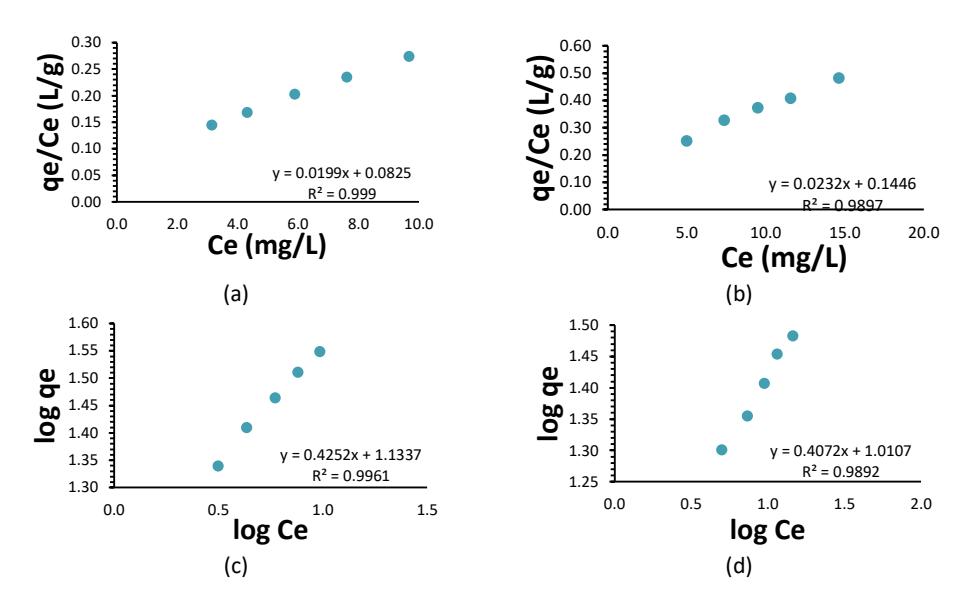
Langmuir model of: a) DMAC and NDMCA b); Freundlich model of: c) DMAC and d) NDMCA.
Figure 6 illustrates the correlation between initial concentration and RL. As the MB initial concentration increases (25 – 45 mg/L), there is a notable decrease in the RL value. Specifically, the RL value on DMAC decreases from 9.6 × 10⁻³ to 5.3 × 10⁻³ , while for NDMCA, it decreases by approximately half. The downward trend in RL indicates a favorable adsorption process for MB dye, as all RL values remain within the range of 0 < RL < 1, indicating successful adsorption. (Alardhi et al., 2023).
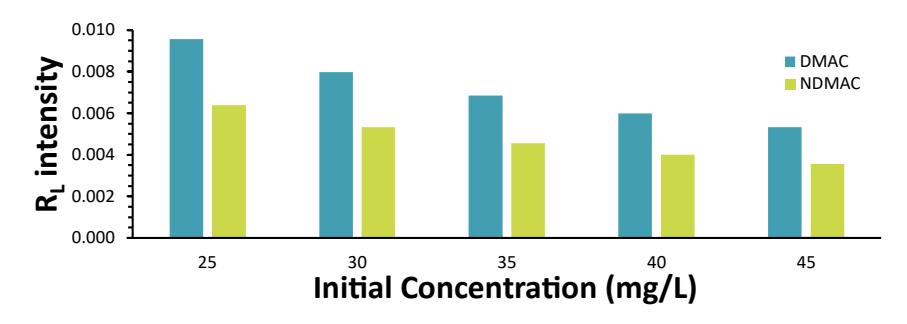
Correlation between initial concentration and separation factor values of DMAC and NDMAC.
Table 1 summarizes that the most suitable isotherm for MB adsorption is the Langmuir model, which suggests that adsorption occurs as a monolayer on a homogeneous adsorbent surface. This indicates that monolayer adsorption occurred on a homogeneous adsorbent surface. This conclusion is supported by a higher determination coefficient (R2 ) for DMAC than the Freundlich model (0.999 > 0.996). Similarly, the NDMAC also aligns with the Langmuir model, as evidenced by a higher R² value (0.9897 > 0.9892).
Table 1 Parameters of the Langmuir and the Freundlich isotherm models for DMAC and NDMAC.
| Langmuir model | Slope | Intercept | qm (mg/g) | KL (L/mg) | R2 |
|---|---|---|---|---|---|
| DMCA | 0.0199 | 0.0825 | 50.2513 | 4.1457 | 0.999 |
| NDMCA | 0.0232 | 0.1446 | 43.1035 | 6.2328 | 0.9897 |
| Freundlich model | Slope | Intercept | n | KF (L/mg) | R2 |
| DMCA | 0.4252 | 1.1337 | 2.3518 | 13.605 | 0.9961 |
| NDMCA | 0.4072 | 1.0107 | 2.4558 | 10.2494 | 0.9892 |
Kinetic Models
Table 2 and Figure 7 present a detailed comparison of the kinetic models used to describe the adsorption of methylene blue on both DMAC and NDMAC. Table 2 presents the kinetic parameters for both pseudo-first-order (PFO) and pseudosecond-order (PSO) models. The PFO model showed very low R² values (0.1428 for DMAC and 0.0045 for NDMAC), indicating poor fit with the experimental data. Conversely, the PSO model achieved R² values of 0.9958 for DMAC and 0.9954 for NDMAC, with the calculated equilibrium adsorption capacities (Q₂) closely aligning with the e perimental results. This strong correlation suggests that chemisorption predominantly drives the adsorption process, with the rate being controlled by electron sharing and valence forces between the adsorbate and the adsorbent.
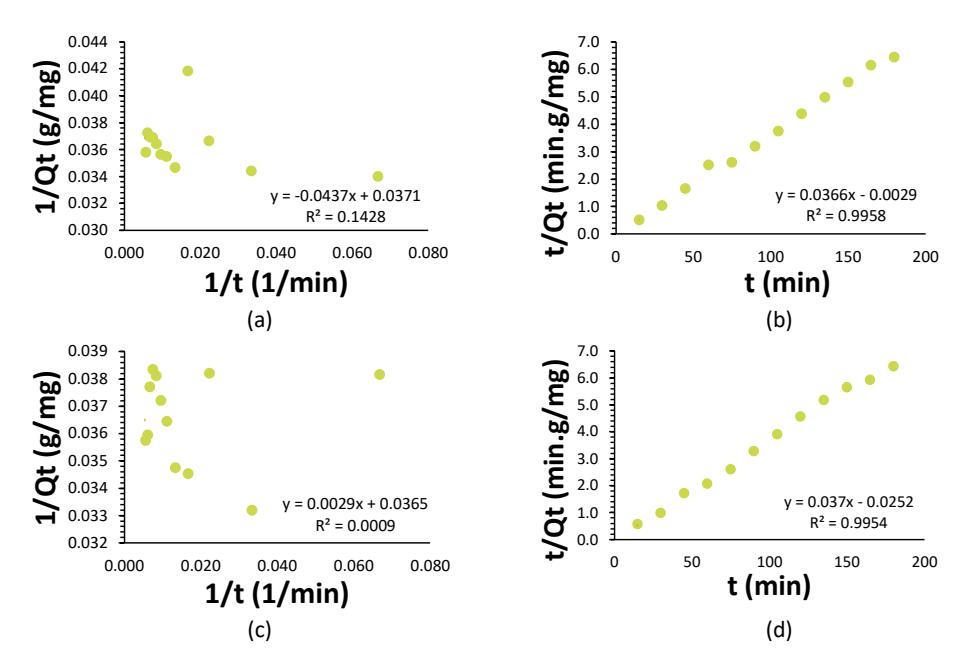
DMAC: (a) Pseudo-First Order and (b) Pseudo-Second Order; NDMAC: (c) Pseudo-First Order and (d) Pseudo-Second Order.
Figure 7 illustrates the kinetic behavior of DMAC and NDMAC through PFO and PSO models. The adsorption kinetics of MB onto DMAC and NDMAC were evaluated using these models, with results summarized in Table 2. The PFO model exhibited low correlation coefficients, with R² values of 0.1428 for DMAC and 0.0045 for NDMAC, indicating a weak fit to the e perimental data. The rate constants (k₁) were -1.177 min⁻¹ for MAC and 0.17 7 min⁻¹ for N MAC. The adsorption capacities (Q₁) were determined as . 5 1 mg/g for DMAC and 27.6243 mg/g for NDMAC.
In contrast, the PSO model provided a much stronger fit, with R² values of 0.9958 (DMAC) and 0.9954 (NDMAC), reflecting excellent agreement with the experimental results. The calculated equilibrium adsorption capacities (Q₂) were 7. mg/g for MAC and 7.0 70 mg/g for N MAC, closely matching the e perimental data. The rate constants (k₂) were -0.4619 g/mg.min for DMAC and -0.0543 g/mg.min for NDMAC.
| Model | Slope | Intercept | Adsorption capacity | Constant | R2 |
|---|---|---|---|---|---|
| PFO (DMAC) | -0.0437 | 0.0371 | 26.9541a | -1.1779c | 0.1428 |
| PFO (NDMAC) | 0.0064 | 0.0362 | 27.6243a | 0.1767c | 0.0045 |
| PSO (DMAC) | 0.0366 | -0.0029 | 27.3224b | -0.4619d | 0.9958 |
| PSO (NDMAC) | 0.037 | -0.0252 | 27.0270b | -0.0543d | 0.9954 |
Table 2 Kinetics model parameters for MB adsorption with DMAC and NDMAC.
Discussion
Impact of initial dye concentration and surface modification on adsorption performance
The pattern in Figure 4 is due to the increased availability of dye molecules in the solution, which boosts the driving force for mass transfer to the adsorbent surface. However, the increase in adsorption capacity was not proportional, a theoretical adsorption capacity of pseudo-first-order (Q₁, mg/g), b theoretical adsorption capacity of pseudo-secondorder (Q₂, mg/g), cpseudo-first-order rate constant (k₁, 1/min), dpseudo-second-order rate constant (k₂, g/mg.min)
indicating a trend toward saturation as the active sites become occupied (Safri et al., 2022). DMAC exhibited the highest adsorption capacities at all concentration levels, highlighting the effectiveness of delignification and magnetization in enhancing surface area and pore structure. These modifications likely enhanced accessibility for dye molecules, leading to increased adsorption.
Despite the enhancement in adsorption capacity, dye removal efficiency generally decreased with increasing dye concentration (Soltani et al., 2021; Waluyo, Rahmawati, et al., 2025). The limited number of active adsorption sites relative to the higher number of dye molecules at elevated concentrations can explain this inverse trend. At lower concentrations, most dye molecules are efficiently adsorbed, resulting in higher removal percentages, while at higher concentrations, competition for binding sites increases, and not all dye molecules can be captured, leading to reduced removal efficiency (Abdolhossein Rejali & Dinari, 2025; Hussain et al., 2025; Khaliha et al., 2023). This behavior is primarily attributed to an augmented driving force for mass transfer (Ismail et al., 2019).A larger concentration gradient between the bulk solution and the adsorbent surface promotes more dye molecules moving toward the active sites on the adsorbent (Aggour et al., 2025). This enhanced driving force allows more dye molecules to overcome mass transfer resistance and bind to the adsorbent, consequently leading to a higher amount of dye adsorbed per unit mass of the adsorbent (Gabelman, 2017). In contrast, the decline in dye removal efficiency at higher initial concentrations is due to the limited number of active sites available on a fixed amount of adsorbent. As the initial dye concentration rises, these active sites become increasingly saturated (Aggour et al., 2025). Among all the adsorbents, NDP consistently showed the lowest adsorption capacity and removal efficiency, indicating that the absence of both delignification and magnetization limits adsorption performance. In contrast, the consistently high performance of DMAC emphasizes the critical role of structural modifications in improving adsorption characteristics.
Additionally, the results of the two-way ANOVA test confirm that both the initial dye concentration and the type of surface treatment significantly influence adsorption behavior (p < 0.05). These findings suggest that optimizing initial conditions and modifying the adsorbent can substantially enhance dye removal efficiency in practical applications.
Isotherm Behavior, and Kinetic Evaluation of Modified Activated Carbons for Methylene Blue Removal
The isotherm results indicate that the Langmuir model more accurately describes the adsorption of methylene blue on both DMAC and NDMAC than the Freundlich model. The Langmuir model, which assumes monolayer adsorption on a surface with uniform energy sites, appears suitable for these adsorbents. This is evidenced by the higher R² values: 0.999 for DMAC and 0.9897 for NDMAC, significantly surpassing the values obtained from the Freundlich model.
The higher qm observed for DMAC than NDMAC suggests that delignification and magnetization treatments enhance the adsorbent's surface area, pore accessibility, and availability of active binding sites (Li et al., 2025; Yang et al., 2023). Furthermore, the Langmuir constant KL, which indicates the affinity between the adsorbate and adsorbent, was slightly higher for NDMAC, suggesting stronger binding interactions; however, this did not translate into a higher overall capacity, which implies that surface structure and site accessibility play a more dominant role in adsorption efficiency than affinity alone.
The Freundlich model, although somewhat descriptive of the adsorption behavior (especially for multilayer or heterogeneous surfaces), yielded slightly lower R² values for both materials (Figures 7a and 7c). This supports the hypothesis that adsorption in this case is more consistent with monolayer coverage, aligning well with the Langmuir assumption. These findings are consistent with previous studies, which also reported a better fit of the Langmuir model for methylene blue adsorption onto activated carbon (Azari et al., 2023; Tenea et al., 2024; Zakaria et al., 2021). In terms of adsorption kinetics, the data clearly support the PSO model as the best fit for both DMAC and NDMAC. The high R² values (above 0.995) and strong agreement between the calculated and experimental Q₂ values indicate that the ratelimiting step in the adsorption process is chemisorption (Parlayici & Aras, 2024). This mechanism involves valence forces and electron sharing between the MB molecules and the functional groups present on the adsorbent surface, particularly those introduced through delignification and magnetization.
The poor performance of the PFO model, as seen in the low R² values and mismatched q values, further confirms that physical adsorption is not the dominant process. This conclusion is reinforced by the linear PSO plots in Figure 7, where the close fit suggests a consistent and uniform chemical adsorption mechanism throughout the experiment. Furthermore, these results are consistent with literature findings on biomass-derived adsorbents, where chemical modifications such as surface oxidation, delignification, and magnetization significantly improve not only the adsorption
capacity but also the adsorption rate (Gao et al., 2021; D. Guo et al., 2023; T. Guo et al., 2023; Mashkoor & Nasar, 2020; Thakham et al., 2024; Zhu et al., 2020). The improvements in chemisorption behaviour observed for DMAC and NDMAC align with these trends, demonstrating that the surface modifications employed were successful in enhancing both kinetic and equilibrium adsorption performance.
In brief, methylene blue adsorption on DMAC and NDMAC adheres to the Langmuir isotherm and pseudo-second-order kinetics, suggesting that the process is primarily monolayer chemical adsorption. The superior performance of DMAC compared to NDMAC highlights how structural modifications greatly influence adsorption behavior and emphasizes the importance of optimizing adsorbent design for more effective dye removal.
Comparative Adsorption Performance
The adsorption performance of the synthesized MAC was evaluated in comparison with various adsorbents reported in the literature. Table 3 provides a comparative overview, considering key parameters such as initial MB concentration, maximum adsorption capacity (qm), and correlation coefficient (R²). This comparison highlights the efficiency of the synthesized MAC concerning different bio-based and composite adsorbents.
| Feedstock | Initial Conc. (mg/L) | qm (mg/g) | 2 R | Ref. |
|---|---|---|---|---|
| Coconut-based activated carbon fibers/Nano-Fe3O4 | 5 – 50 | 103.52 | 0.998 | (Ye et al., 2024) |
| Magnetic Biochar of palm oil empty fruit bunch | 30 | 31.25 | 0.958 | (Mubarak et al., 2015) |
| Magnetic/Activated Charcoal/β-Cyclodextrin/Alginate Polymer Nanocomposite | 5 | 2.08 | 0.992 | (Yadav et al., 2020) |
| Sugarcane bagasse-γ-Fe2O3 | 100 – 1000 | 36.14 | 0.999 | (Jiang et al., 2021) |
| Rice husk-Fe3O4 | 10 | 32.25 | 0.997 | (Rao Vaddi et al., 2024) |
| Magnetic zero-valent iron-activated grape wastes | 100 – 500 | 44.00 | 0.972 | (Shahbazi et al., 2020) |
| Natural magnetic sand | 10 – 100 | 1.01 | 0.990 | (Ozer, 2020) |
| Natural zeolite/Fe3O4 | 5 – 40 | 32.26 | 0.999 | (Wahyuni et al., 2021) |
| DMAC | 25 – 45 | 50.25 | 0.999 | This study |
| NDMAC | 25 – 45 | 43.10 | 0.999 | This study |
Table 3 Adsorption capacities (qm) of different magnetic-adsorbents for MB adsorption
Among the reviewed materials, coconut-based activated carbon fibers with Nano-Fe₃O₄ showed the highest adsorption capacity (qm = 103.52 mg/g), likely due to their large surface area and enhanced dye attraction. (Ye et al., 2024). Other adsorbents from biomass-derived sources, such as magnetic zero-valent iron-activated grape wastes (qm = 44 mg/g), sugarcane bagasse-derived γ-Fe₂O₃ (qm = .1 mg/g), magnetic Biochar of palm oil empty fruit bunch (qm = 1. 5 mg/g), and rice husk-Fe₃O₄ (qm = . 5 mg/g), showed moderate adsorption capacities, suggesting a dependency on their structural and textural properties (Jiang et al., 2021; Mubarak et al., 2015; Rao Vaddi et al., 2024; Shahbazi et al., 2020). Some materials, Natural sand and polymeric nanocomposites, demonstrated significantly lower adsorption capacities (qm = 1.01 mg/g and 2.08 mg/g, respectively), possibly due to limited porosity or weaker interaction with MB molecules (Ozer, 2020; Yadav et al., 2020).
In this study, the synthesized MAC materials—DMAC and NDMAC—showed adsorption capacities of 50.25 mg/g and 43.10 mg/g, respectively, within an initial dye concentration range of 25–45 mg/L. These results suggest that the MAC performed better than many other bio-based adsorbents and exhibited a very high correlation with adsorption models (R² > 0.99). The impressive adsorption performance is likely due to the combined effects of delignification, magnetization, and activation, which increased surface area, porosity, and active sites for dye removal. Overall, the results demonstrate that these synthesized MAC materials are highly effective for MB adsorption. Their efficiency surpasses that of several other biomass-derived adsorbents, providing a sustainable and economical alternative for wastewater treatment.
Conclusion
This investigation successfully synthesized various precursors, including DP, NDP, DAC, DMAC, and NDMAC, using ZnCl2 as an activator and magnetizing with Fe2+ and Fe3+. Each precursor underwent SEM, FTIR, and XRD analysis, as well as an absorption test using the methylene blue dye. The SEM analysis revealed that the delignified precursor exhibited larger and wider pores compared to the non-delignified precursor. XRD analysis showed that DMAC exhibited a more pronounced Fe peak, indicating higher Fe content and a more organized crystal structure. The absorption test identified a maximum wavelength at 665 nm, and variations in methylene blue concentrations (25–45 mg/L) demonstrated adherence to the Langmuir Isotherm model, indicating a monolayer adsorption mechanism with R² = 0.999 for both
DMAC and NDMAC. Additionally, the adsorption kinetics, modeled as pseudo-second-order, suggested that the methylene blue adsorption process by the magnetic activated carbon was primarily chemical in nature. For further development, it is essential to evaluate the potential leaching of Fe2+/Fe3+ ions from the adsorbent after adsorption to ensure environmental safety and stability of the adsorbent, including its post-treatment.
Nomenclature
Ce = equilibrium concentration (mg/L)
Ce = initial concentration (mg/L)
kL = Langmuir constant (L/mg)
kF = Freundlich constant (L/mg)
qe = adsorption capacity at equilibrium (mg/g)
qm = maximum adsorption capacity (mg/g)
w = Adsorbent mass (g)
n = heterogeneous factor
Q1 = max adsorption capacity of pseudo-first-order
reaction (mg/g)
Q2 = max adsorption capacity of pseudo-second-order
reaction (mg/g)
t = adsorption time (min)
v = volume of MB solution
Acknowledgement
The funding for this initiative was granted via Penelitian Unggulan Terapan Universitas Sebelas Maret, identified by the reference numbers 194.2/UN27.22/PT.01.03/2024.
Compliance with ethics guidelines
The authors declare they have no conflict of interest or financial conflicts to disclose. This article contains no studies with human or animal subjects performed by authors.