
Introduction
PT Industri Kereta Api (Persero), known as PT INKA, is developing The First High-speed Train (HST). The operational speed designed for the HST is 250 km/h (Rizal & Syaifudin, 2023). The operational speed of a conventional train is 100 km/h and that of a medium-speed Train (MST) is 160 km/h (Syaifudin et al., 2022). Increasing speed also increases the potential risk of accidents. Hence, the HST must be equipped with a safety system. There are two types of train safety systems: active safety systems and passive safety systems. An active safety system works before an accident occurs. Active safety systems work by halting the train during an emergency. In Indonesia, active safety systems are known by ATP (Automatic Train Protection) (Rizal & Syaifudin, 2023).
With an active safety system employed on the train, accidents can still occur. According to the Indonesian Transportation Safety Committee (KNKT) data for the last decade (2015-2024), The number of train accidents due to collisions was 7 accidents (Indonesian Transportation Safety Committee (KNKT): Investigasi Kecelakaan Perkeretaapian, n.d.). Hence, the passive safety systems need to be employed on the train to protect the passengers when the active safety system fails and an accident cannot be avoided. Passive safety systems are employed in the application of crashworthiness technology. Crashworthiness will reduce the risk of injury to the passengers by absorbing the impact of energy.
There are some studies about train crashworthiness for both the leading vehicle and the intermediate vehicle or train trailer. The research of intermediate crashworthiness includes evaluation of existing design crashworthiness (Kirkpatrick
Copyright ©2025 Published by IRCS - ITB J. Eng. Technol. Sci. Vol. 57, No. 5, 2025, 760-775 ISSN: 2337-5779 DOI: 10.5614/j.eng.technol.sci.2025.57.6.3
et al., 2001), crashworthiness improvement by modifying the end structure (Mayville et al., 2003; Gao & Tian, 2007; Xue et al., 2007; Baykasoğlu et al., 2011; Hosseini-Tehrani & Bayat, 2011; Molatefi et al., 2016), comparison study of crashworthiness between the steel-based and aluminum-based structure (Baykasoglu et al., 2012), and comparison study of crashworthiness between the 3 types of car body structure which constructed from structural carbon steel, structural stainless steel, and hollow aluminum extrusion (Zhu et al., 2019). The research about train crashworthiness in Indonesia has been carried out, including the research of leading vehicle e.g., the effect of crash-module shape variation and configuration of medium-speed train (Syaifudin et al., 2022), impact module of high-speed train (Syaifudin et al., 2023), and energy absorption system configuration of high-speed train (Rizal & Syaifudin, 2023). And for intermediate vehicle or passenger train trailer has been carried out for the K1 passenger train which has been started by basic design of passive safety system (Dharma et al., 2016), then continued by crashworthiness analysis (Setiawan & Pamintori, 2017), and continued by design and analysis of crash-zone impact energy absorption (Setiawan et al., 2019). The K1 passenger train as a conventional train, made from structural steel, while the Indonesian high-speed trailer is made from aluminum extrusion. Nevertheless, no crashworthiness study has yet addressed the passenger train trailer made from aluminum extrusion. What was found was only strength analysis of it (Syaifudin et al., 2021). In another country, crashworthiness study of passenger trailer made from aluminum structural (Baykasoglu et al., 2012) and aluminum extrusion (Zhu et al., 2019) was found as mentioned before.
Based on the findings of Zhu et al., the passenger train trailer constructed from aluminum extrusion demonstrates a notably high peak crash force, approximately 14 MN (Zhu et al., 2019). The higher the crash force, the higher the deceleration value. The higher the value of deceleration, the greater the chance of injury to passengers (Severson et al., 2004). The crash force should be maintained at a certain value that is not excessively high. The Indonesian K1 passenger train shows a peak crash force of 3.39 MN (Setiawan & Pamintori, 2017). The mean deceleration value in the passenger area is 8.8 g (Setiawan & Pamintori, 2017), which exceeds the allowable mean deceleration value of EN 15227/SNI 8826 (EN 15227 Railway Applications - Crashworthiness Requirements for Railway Vehicle Bodies, 2008; SNI 8826:2019 Aplikasi Perkeretaapian - Crashworthiness Pada Sarana Perkeretaapian, 2019). The peak crash force of the aluminum extrusion train studied by Zhu et al. is over three times that of the Indonesian K1 passenger train. It can be assumed that the deceleration value is also very high, although Zhu et al. did not present the deceleration result. The high crash force due to the high stiffness value of the crash zone structure. Additionally, the passenger cars of Indonesian highspeed trains will utilize full aluminum extrusion for their structures. When the carbody is made entirely from aluminum extrusions, it is important to focus on the vestibule area, which is designed as a crash zone. The inherent stiffness of aluminum extrusion leads to high deceleration values, making it necessary to thoroughly evaluate the vestibule area's ability to absorb impact energy in a controlled manner to reduce deceleration. Considering that the train structure constructed from the structural beam exhibits a lower crash force compared to the train structure made from the aluminum extrusion, this study proposes the use of a combination of the aluminum extrusion and the structural beams. The aluminum extrusion was used for the survival space due to its high stiffness, and the structural beam was used for the vestibule area as a crash zone area. This study also proposes a crashworthiness improvement strategy, similar to the notch implementation by Setiawan et al. (Setiawan et al., 2019), to reduce the longitudinal stiffness.
As a stage of developing the first HST in Indonesia, this study was carried out for compliance to the standards. This study also evaluates the crashworthiness of a passenger train structure with four different structures of the vestibule area, which can be used as a reference for implementing crashworthiness in a further study.
Material and Method
The crashworthiness analysis was carried out using the finite element method with an explicit approach. To help with this work, ANSYS software was employed. Modeling has begun from variation A as a base model in this study, referring to the rear end structure design of the Indonesian HST locomotive, which used full aluminum extrusion. This decision considering that the end structure (vestibule area) of the Indonesian passenger train is frequently the same as the rear end structure of its locomotive, like Jabodebek and Makassar-Parepare LRT. This design is further simplified by modeling the structure in the form of surfaces. This simplifying method was chosen because the shell elements will be used in the FE simulation. The modeling process was carried out by employing ANSYS Spaceclaim, which is dedicated to making or preparing FE models. The complementary components, i.e., HVAC and bogie were modeled by simple geometry or point mass, as shown in Figure 1(a).
Simulation model: (a) breakdown (b) meshed.
The element-type chosen was a shell element to define the surfaces prepared before with the original thicknesses. The element order was the first-order element or linear element with 4 nodes (quadrilateral shape). This element is then modeled using the Belytschko–Tsay formulation with 2 integral points through the shell thickness and 1 integral point on the plane element(Peng et al., 2015). The meshing process is supported by good geometry preparation for the good mesh result, as indicated in Figure 1(b).
Model variations: (a) variation A, (b) variation B, (c) variation C, (d) variation D.
There are four variation models evaluated in this study, as depicted in Figure 2. Variation (a), as a base model in this study, referred to the rear end structure design of the Indonesian HST, which used full aluminum extrusion. This decision considering that the end structure (vestibule area) of the Indonesian passenger train is frequently the same as the rear end structure of its locomotive, like Jabodebek and Makassar-Parepare LRT. Variations (b), (c) and (d) use a combination of aluminum extrusion and a structural beam considering that the design with full aluminum extrusion will be very stiff and cause high deceleration values.
Variation (b) used roof construction referred to Indonesian conventional passenger train which used structural beam construction (Setiawan & Pamintori, 2017). The top door frame and side sill under the door still used the aluminum extrusion, as did the floor. The floor of variation (c) no longer used the aluminum extrusion but used the checkered plate with the beam under it. The top door frame and side sill under the door still used aluminum extrusion. The vestibule area of variation D no longer used aluminum extrusion at all. The top door frame used the bent plate following the door shape. The side sill under the door used the bent plate following the shape of aluminum extrusion side sill. The longitudinal beams were added to support the floor. The notches were applied to the side sill and longitudinal beams, as depicted in Figure 2(d), to reduce the crash force, ensuring that the deceleration value was not excessively high (Setiawan et al., 2019). Shortly, variation B is used roof frame, variation C is used roof and floor frame, and variation (d) is used roof and modified floor frame.
The main structural material used was Aluminum 6005A-T6 with the Johnson–Cook material model to define the high strain rate properties. The material properties obtained from the previous research are described in Table 1.
| Parameter | Value | Unit |
|---|---|---|
| Density (ρ) | 2700 | Kg/m3 |
| Tensile Yield Strength | 230 | MPa |
| Tensile Ultimate Strength | 280 | MPa |
| Poisson Ratio (v) | 0.3 | - |
| Modulus elasticities (E) | 70 | GPa |
| Initial Yield Stress (A) | 270 | MPa |
| Hardening Constant (B) | 134 | MPa |
| Strain Hardening Coefficient (n) | 0.514 | - |
| Strain Rate Constant (C) | 0.0082 | - |
| Thermal softening exponent (m) | 0.703 | - |
| Melting Temperature (TM) | 893 | K |
| Room Temperature (TR) | 293 | K |
| Reference Strain Rate (epso) | 0.001 | 1/Sec |
| Specific heat (cp) | 910 | J/kg. K |
| Failure Parameter 1 (D1) | 0.06 | - |
| Failure Parameter 2 (D2) | 0.497 | - |
| Failure Parameter 3 (D3) | -1.551 | - |
| Failure Parameter 4 (D4) | 0.0286 | - |
Table 1 Material Properties of Aluminum 6005A-T6 (Børvik et al., 2005).
Failure Parameter 5 (D5) 6.8 - The connections between the structures are assumed to be perfect connections without any failures, defined by the mesh connections between the meshes of each part.
The actual crash scenario of passenger train was train-to-train impact scenario (This includes scenarios such as the front vestibule area of a passenger train impacting the rear vestibule area of a locomotive, or the front vestibule area of one passenger train impacting the rear vestibule area of another passenger train ahead of it). However, the collision scenarios simulated in this research are the collision of the train with a rigid wall, which serves as an idealized representation of a symmetric train-to-train impact scenario, following the simplification approach described in previous research (Kirkpatrick et al., 2001; Xue et al., 2007; Gao & Tian, 2007; Hosseini-Tehrani & Bayat, 2011; Baykasoglu et al., 2012; Molatefi et al., 2016; Setiawan & Pamintori, 2017; Setiawan et al., 2019; Zhu et al., 2019; Rizal & Syaifudin, 2023; Syaifudin et al., 2023). This scenario is selected to represent a worst-case condition for passenger safety. This approach is commonly used in crashworthiness assessments, as a rigid wall simulates a fully inelastic barrier, maximizing the energy transfer to the train structure (Baykasoğlu et al., 2011). The train model as constructed in Figure 3, characterized by a mass 2 , is assigned an initial condition with an initial velocity 2 . No external forces influence this condition, as both air resistance and the friction between the wheels and rails are neglected, thereby establishing a collision speed equal to 2 . The rear of the model is subjected to boundary conditions that permit only longitudinal motion towards a rigid wall.
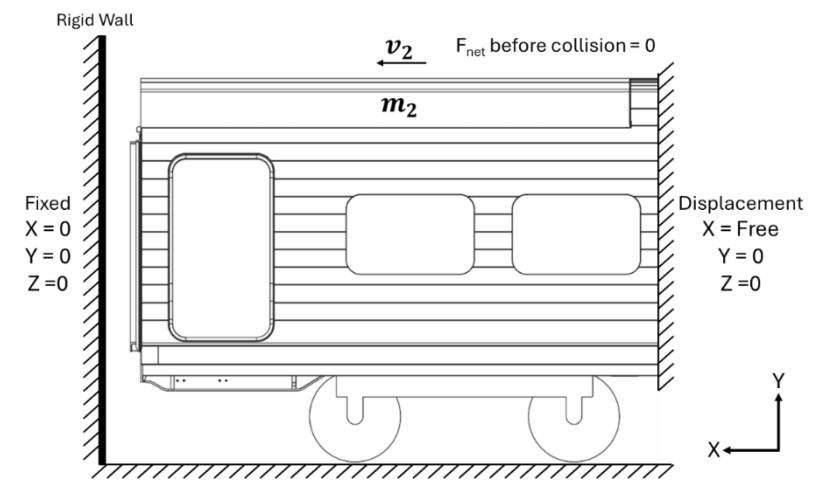
Boundary condition and collision scenario.
Two collision speed values were selected based on two referenced standards. The first is 10 m/s, refers to EN 15227 which adopted as the Indonesian crashworthiness standard, i.e. SNI 8826 (EN 15227 Railway Applications - Crashworthiness Requirements for Railway Vehicle Bodies, 2008; EN 15227 Railway Applications - Crashworthiness Requirements for Railway Vehicle Bodies, 2020; SNI 8826:2019 Aplikasi Perkeretaapian - Crashworthiness Pada Sarana Perkeretaapian, 2019), and the second is 11.176 m/s, refer to 49 CFR 238 Subpart H as a specific crashworthiness benchmark for high speed train due to EN 15227 does not categorize trains according to their speed (49 CFR PART 238 - PASSENGER EQUIPMENT SAFETY STANDARDS, n.d.). Hourglass control type 4, i.e. "Flanagan-Belytschko Stiffness Form" with a 0.04 coefficient is applied to avoid the hourglass energy (Wang et al., 2019).
Verification
To ensure the accuracy of the simulation results, some verification stage, i.e., mesh independence test, mesh quality evaluation, energy input checking and energy balance observation, have been carried out. Figure 4 depicts mesh independence test result. Mesh size variations ranging from 80 mm to 30 mm were chosen for this test. The maximum crash force decreases by decreasing the mesh size or increasing the number of elements. The test result shows that mesh under 60 mm have a slight difference with an error value less than 5%. Thus, the 50-mm mesh size was chosen due to its accuracy, while considering the computational cost.
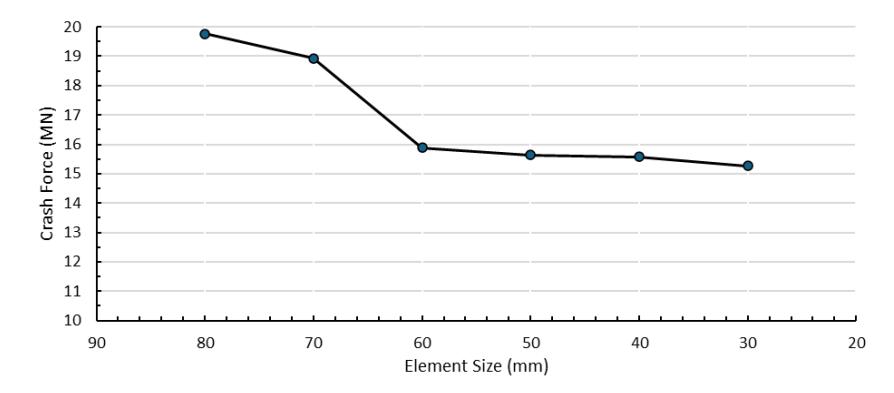
Mesh independence.
Table 2 shows the mesh quality of the FE model. The mesh quality was evaluated according to the acceptable value by ANSYS recommendation (ANSYS Guide, Introduction to ANSYS Meshing, Lecture 7: Mesh Quality & Advanced Topics, 2015). Maintaining good mesh quality for all elements is a big challenge for the complex geometry with vast amounts of mesh. The presence of poor-quality meshes in some elements can still be tolerated as long as the percentage is reasonable and not in a critical area. For this study, the aspect ratio ranged from 1.00 to 18.08. The meshes with not acceptable value of aspect ratio were not in critical area and its percentage just 0.033%. The skewness ranged from 0 to 0.98. The meshes with not acceptable value of skewness value just 0.003% from total meshes and not in the critical area. The element quality ranges from 0.14 to 1.00. The mesh with poor element quality is just 0.001% from the total meshes and not in the critical area.
| Parameter | Min value | Max value | Acceptable value | Not Acceptable (%) |
|---|---|---|---|---|
| Aspect ratio | 1.00 | 18.08 | 1-10 | 0.033% |
| Skewness | 0.00 | 0.98 | 0-0.94 | 0.003% |
| Element Quality | 0.14 | 1.00 | 0.15-1.00 | 0.001% |
Table 2 Mesh quality.
The final verification involves evaluating the energy resulting from the simulation by comparing the initial kinetic energy, as indicated in Figure 5, to the analytical calculation. With 46000 kg train mass and 10 m/s velocity, the initial kinetic energy is 2.300 MJ. The kinetic energy resulting from the simulation is 2.298 MJ. The energy input was verified with a difference of 0.08%. The system's energy balance was also observed. In this study, a train model is given an initial velocity, and no other force influences the system. Thus, the total energy should remain constant (Livermore Software Technology (LST), An Ansys Company (2001): LS-DYNA Keyword User's Manual Volume I, n.d.). Furthermore, the hourglass energy should not exceed 10% of the total energy (Bala & Day, n.d.). The hourglass energy of this simulation is 1,17%. Lastly, the contact energy or sliding energy should not be a negative value to ensure no contact issue (Livermore Software Technology (LST), An Ansys Company (2003): Contact in LS-DYNA, n.d.). Verifications were conducted for variation A as a base model of this study and is always monitored for every simulation in the further work of crashworthiness improvement.
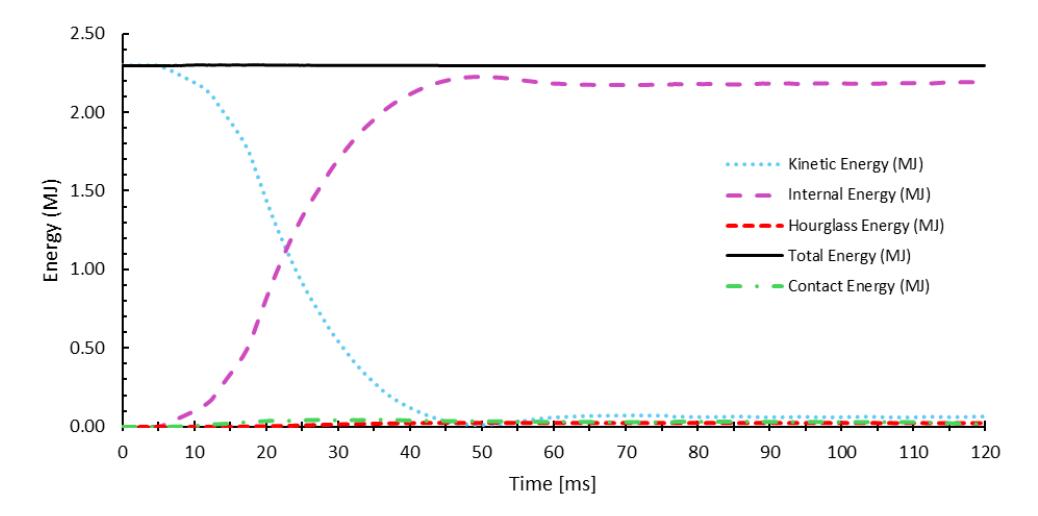
Energy balance of the numerical simulation.
Results
10 m/s Collision Speed
Simulations for the four model variations have been completed. The crashworthiness comparison of the four model variations is further reported.
Crash Force
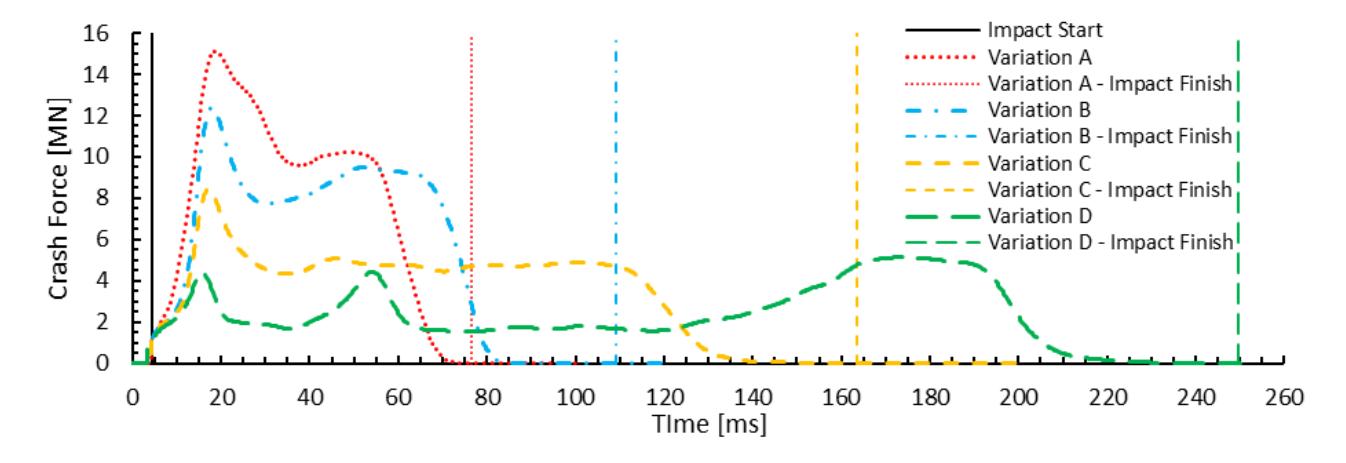
Figure 6 depicts the crash force comparison graphic from the four model variations at a 10 m/s collision speed. The Xaxis shows the time in milliseconds (ms), and the Y-axis shows the crash force in Mega Newtons (MN). Prior to 5 ms, the crash force value was zero because the collision had not yet begun. The initial distance between the walls is 50 mm. With a 10 m/s initial velocity, the collision will occur after 5 ms. After a while, the graph reached its peak and then gradually declined, indicating that the structure had collapsed.
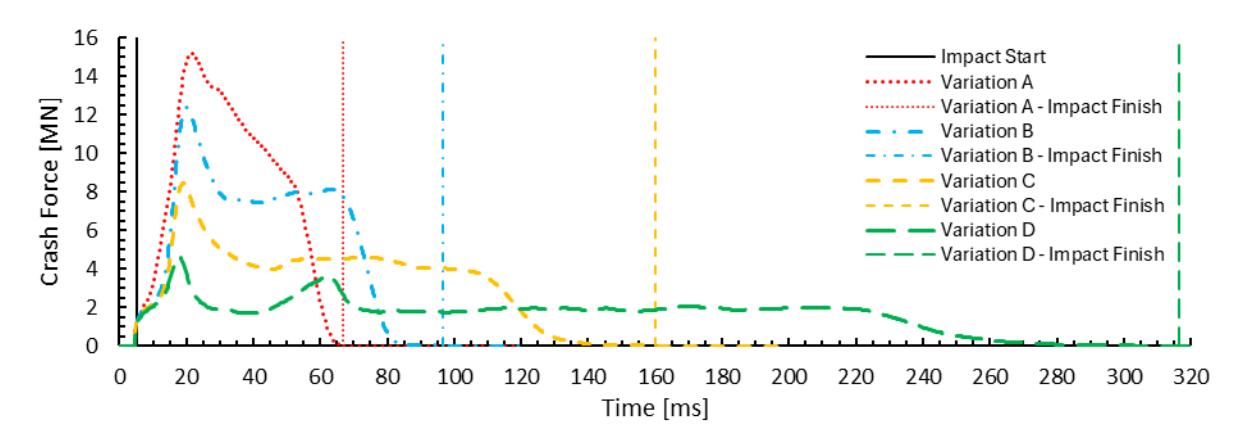
Crash force at the 10 m/s collision speed.
The peak crash force of Variation A, variation B, variation C, and variation D was measured at 15.16 MN, 12.40 MN, 8.44 MN, 4.66 MN, respectively. EN 15227:2008 / SNI 8826:2019 defines the collision time as the duration from when the crash force first exceeds zero until it returns to zero (EN 15227 Railway Applications - Crashworthiness Requirements for Railway Vehicle Bodies, 2008; SNI 8826:2019 Aplikasi Perkeretaapian - Crashworthiness Pada Sarana Perkeretaapian, 2019). According to this definition, the collision times for variations A, B, C, and D are 61.7 ms, 91.4 ms, 155.1 ms, and 311.4 ms, respectively.
Energy Absorption
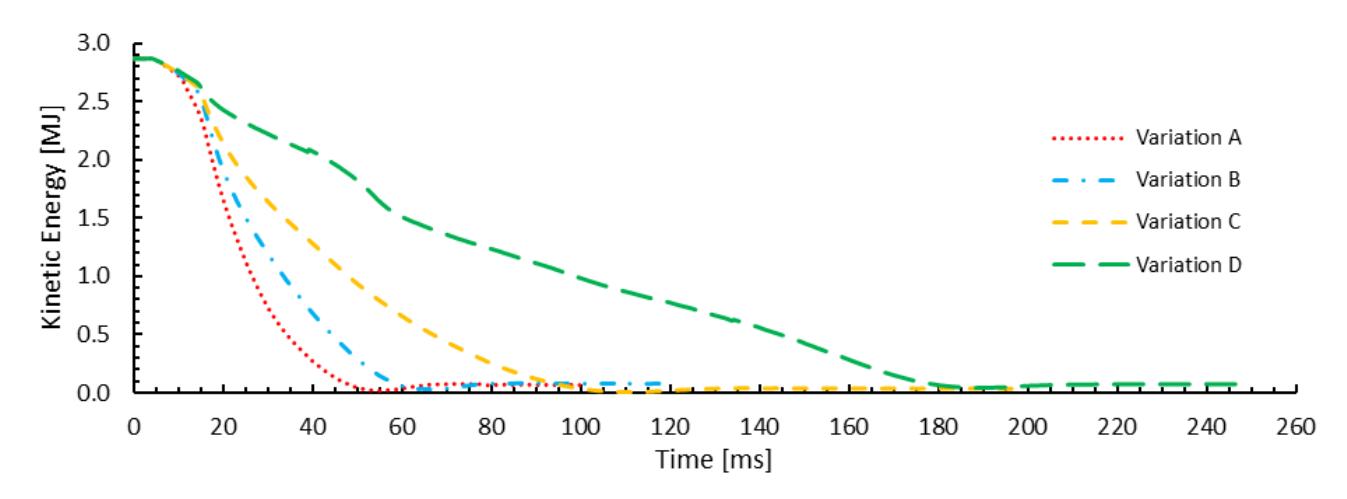
Kinetic energy graphics at the 10 m/s collision speed depicted in Figure 7. The X-axis shows the time in milliseconds (ms), and the Y-axis shows the kinetic energy in megajoules (MJ). The graphic revealed that variation A absorbed energy very quickly. Variation B exhibits a longer energy absorption duration compared to variation A, followed by variations C and D, respectively. The loss kinetic energy due to the collision of variation A, variation B, variation C, and variation D was 2.285 MJ, 2.287 MJ, 2.289 MJ, and 2.254 MJ, respectively. Or 99.4%, 99.5%, 99.6%, and 98.3% from the initial kinetic energy.
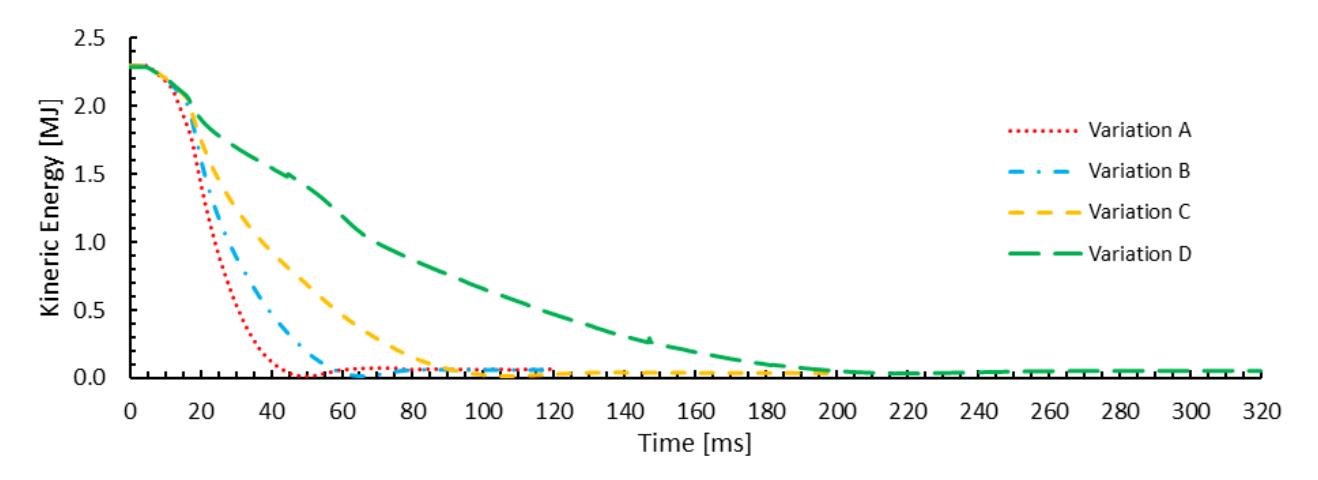
Energy absorption at the 10 m/s collision speed.
Length Reduction
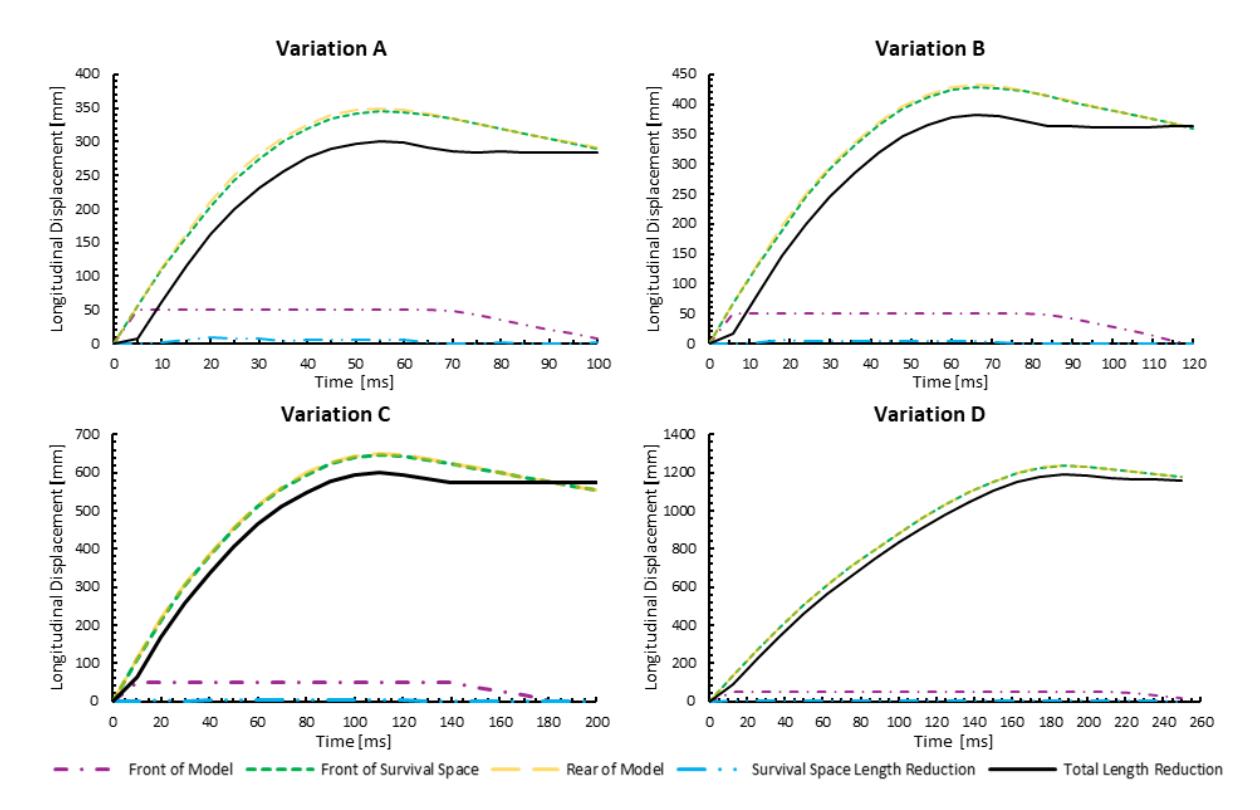
Figure 8 depicts the longitudinal displacement of 3 measuring nodes, which are located on the front of the model, front end of the survival space and rear of the model, at variations A, B, C and D. The X-axis shows the time in milliseconds (ms), and the Y-axis shows the longitudinal displacement in millimeter (mm). All variations show a similar trend in which the displacements occurring in the node located on the front end of the survival space is almost the same as the displacement occurring in the node located on the rear of the model. This shows that nearly all displacements occur in the vestibule area, not in the survival space. The summary of length reduction can be seen in Table 3.
The length reduction of the passenger survival space, which is expressed as the difference between the displacement of 2 measuring nodes mentioned above, is negligible. The maximum length reduction of variation A passenger survival space over the impact time is 9.0 mm, then decrease gradually until the value of 1.8 mm. The maximum length reduction of variation B passenger survival space over the impact time is 5.7 mm, then decrease gradually until the value of 0.8 mm. The maximum length reduction of variation C passenger survival space over the impact time is 4.0 mm, then decrease gradually until the value of 0.3 mm. Lastly, the maximum length reduction of variation D passenger survival space over the impact time is 1.3 mm, then decrease gradually until the value of 0.0 mm, which means no permanent deformation occurs.
Additionally, the maximum length reduction of the whole model of variation A is 247 mm, which then decreases gradually to the value of 231 mm. The maximum length reduction of the whole model of variation B is 329 mm, which then decreases gradually to the value of 308 mm. The maximum length reduction of the whole model of variation C is 501 mm, which then decreases gradually to the value of 475 mm. Lastly, the maximum length reduction of the whole model of variation D is 1036 mm, then decrease gradually until the value of 1000 mm.
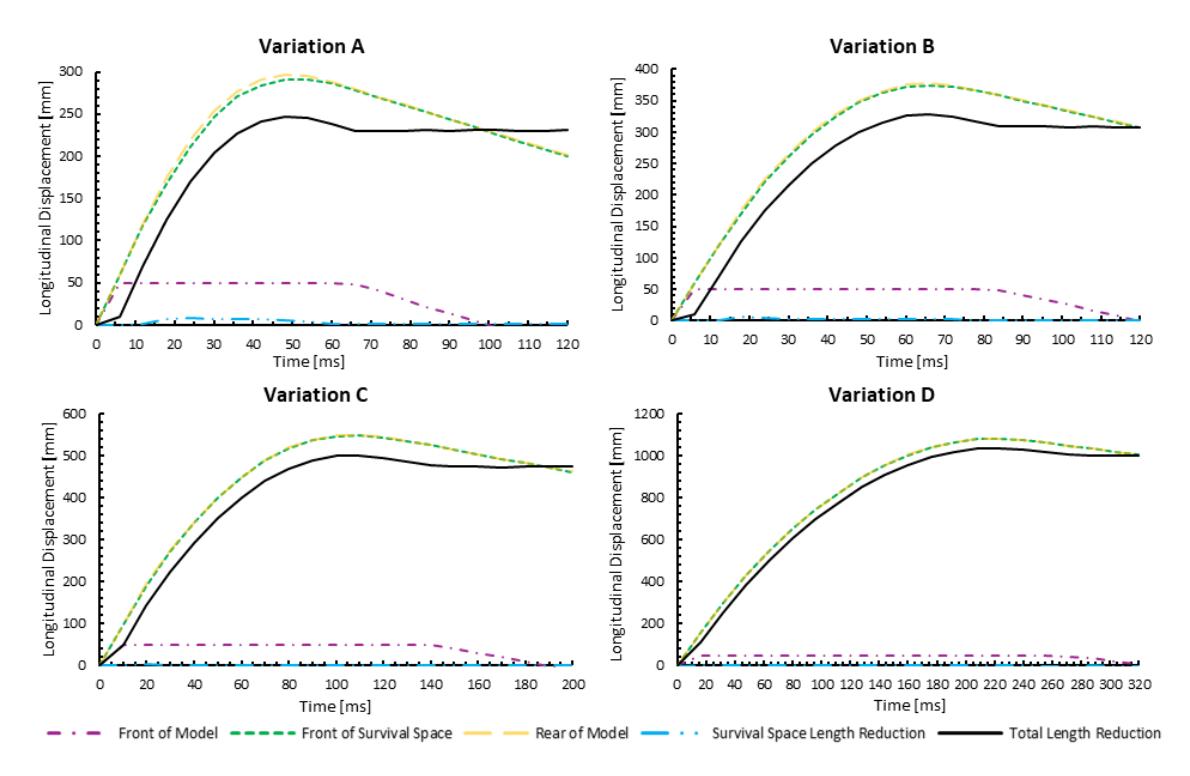
Longitudinal displacement of 3 reference nodes at each variation due to the 10 m/s collision speed.
Table 3 Length reduction summary at the 10 m/s collision speed.
| Length Reduction | |||
|---|---|---|---|
| Variation | Survival Space | Whole Model | |
| A | 1.8 mm | 231 mm | |
| B | 0.8 mm | 308 mm | |
| C | 0.3 mm | 475 mm | |
| D | 0.0 mm | 1000 mm | |
Deceleration
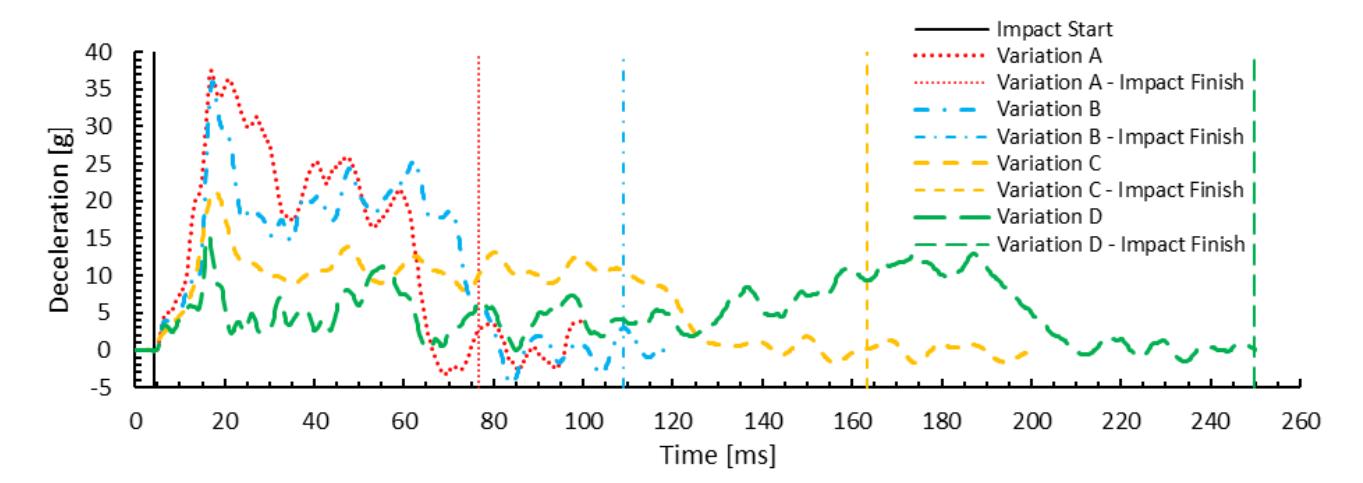
Figure 9 depicts the deceleration comparison from the four model variations over the crash period at a 10 m/s collision speed. The X-axis shows the time in milliseconds (ms), and the Y-axis shows the deceleration in gravitation (g). The mean deceleration over the collision time of variations A, B, C, and D was 18.89 g, 12.73 g, 7.27 g, and 3.52 g, respectively.
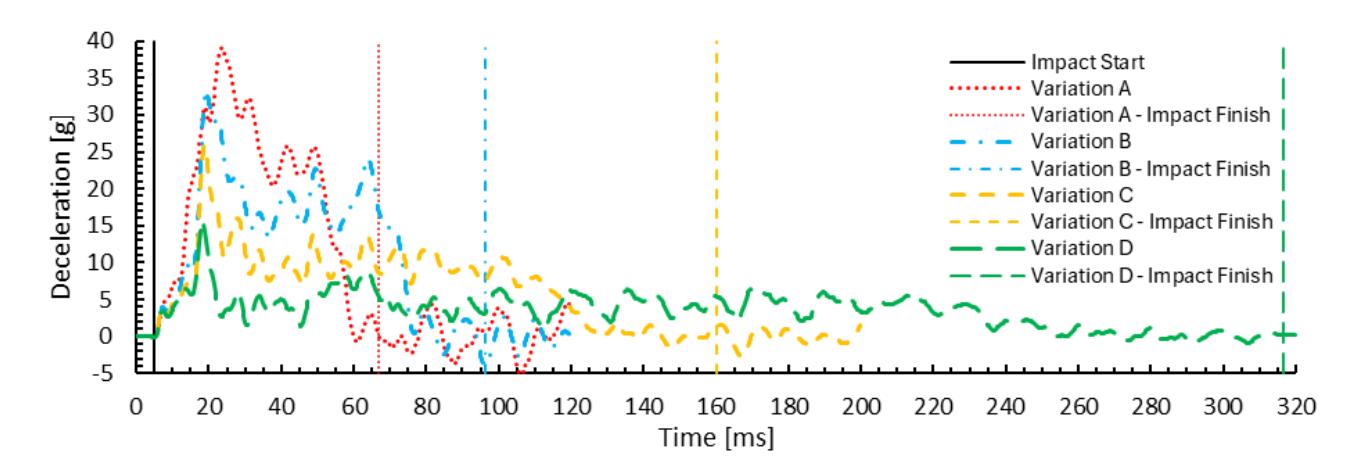
Deceleration at the 10 m/s collision speed.
The maximum deceleration value for the moving average duration of 30 ms of variations A, B, C, and D was 28.13 g, 20.22 g, 12.42 g, and 5.92 g, respectively. The maximum deceleration value for the moving average duration of 120 ms of variations A, B, C, and D was 9.77 g, 9.69 g, 9.33 g, and 4.94 g, respectively, as can be seen in Table 4.
| Variation | Mean deceleration value over the collision time | Maximum deceleration value for a 30-ms moving average duration | Maximum deceleration value for a 120-ms moving average duration |
|---|---|---|---|
| A | 18.89 g | 28.13 g | 9.77 g |
| B | 12.73 g | 20.22 g | 9.69 g |
| C | 7.27 g | 12.42 g | 9.33 g |
| D | 3.52 g | 5.92 g | 4.94 g |
Table 4 Deceleration value summary at the 10 m/s collision speed.
11.176 m/s Collision Speed
After completing the EN 15227/SNI 8826 simulation, the four model variations were simulated according to the higher collision speed standard, i.e., 49 CFR 238 Subpart H, as the final stage of this study. The crashworthiness comparison of the four model variations is further reported.
Crash Force
Crash force comparison graphic from four model variations at 11.176 m/s collision speed depicted in Figure 10. The Xaxis shows the time in milliseconds (ms), and the Y-axis shows the crash force in Mega Newtons (MN). Prior to 4.4 ms, the crash force value was zero as the collision had not yet started. The initial distance between the walls is 50 mm. With an initial velocity of 11.176 m/s, the collision will occur after 4.4 ms. The peak crash force of variations A, B, C, and D was 15.09 MN, 12.40 MN, 8.44 MN, and 5.13 MN, respectively. The impact durations of variations A, B, C, and D were 72.2 ms, 104.7 ms, 159.0 ms, and 245,4 ms, respectively.
Crash force at the 11.176 m/s collision speed.
Energy Absorption
Figure 11 shows a graphic representing the kinetic energy at the 11.176 m/s collision speed. The X-axis shows the time in milliseconds (ms), and the Y-axis shows the kinetic energy in megajoules (MJ). Variation D absorbed the kinetic energy with a longer duration than variation C, variation B, and variation A. The loss kinetic energy due to the collision of variation A, variation B, variation C, and variation D was 2.857 MJ, 2.844 MJ, 2.860 MJ, and 2.817 MJ, respectively. Or 99.5%, 99.1%, 99.6%, and 98.4% from the initial kinetic energy.
Energy absorption at the 11.176 m/s collision speed.
Length Reduction
Figure 12 depicts the longitudinal displacement of 3 reference nodes, which are located on the front of the model, the front end of the survival space, and the rear of the model, at variations A, B, C, and D. The X-axis shows the time in milliseconds (ms), and the Y-axis shows the longitudinal displacement in millimeter (mm). All variations show a similar trend in which the displacements occur in the node located on the front end of the survival space and the displacement occurs in the node located on the rear of the model with more or less overlap. This shows that nearly all length reductions occur in the vestibule area, not in the survival area. The length reduction of the passenger survival space, which is expressed as the difference between the displacement of 2 measuring nodes mentioned above, is negligible. The maximum length reduction of variation A passenger survival space over the crash period is 8.4 mm, then decrease gradually until the value of 1.2 mm. The maximum length reduction of variation B passenger survival space over the crash period was 7.0 mm, then decreased gradually until the value of 0.6 mm. The maximum length reduction of variation C passenger survival space over the crash period was 3.6 mm, then decreased gradually until the value of 0.3 mm. Lastly, the maximum length reduction of variation D passenger survival space over the crash period is 2.5 mm, then decrease gradually until the value of 0.0 mm, which means no plastic deformation occurs.
Longitudinal displacement of 3 references at each variation due to 11.176 m/s collision speed.
Additionally, the maximum length reduction of the whole model of variation A is 300 mm, which then decreases gradually to the value of 284 mm. The maximum length reduction of the whole model of variation B is 383 mm, which then decreases gradually to the value of 362 mm. The maximum length reduction of the whole model of variation C is 599 mm, which then decreases gradually to the value of 574 mm. Lastly, the maximum length reduction of the whole model of variation D is 1190 mm, then decreases gradually until the value of 1162 mm, as summarized in Table 5.
| Table 5 | Length reduction summary at the 11.176 m/s collision speed. |
|---|
| Length Reduction | |||
|---|---|---|---|
| Variation | Survival Space | Whole Model | |
| A | 1.2 mm | 284 mm | |
| B | 0.6 mm | 362 mm | |
| C | 0.3 mm | 574 mm | |
| D | 0.0 mm | 1162 mm | |
Deceleration
Figure 13 depicts a graphic representing the deceleration comparison from the four model variations over the crash period at the 11.176 m/s collision speed. The X-axis shows the time in milliseconds (ms) and the Y-axis shows the deceleration in gravitation (g). The maximum deceleration value for the moving average duration of 100 ms of variations A, B, C, and D was 12.93 g, 12.89 g, 11.26 g, and 7.35 g, respectively, as can be seen in Table 6.
Deceleration at the 11.176 m/s collision speed.
Table 6 Deceleration value summary at the 11.176 m/s collision speed.
| Variation | Maximum deceleration value for a 100-ms moving average duration |
|---|---|
| A | 12.93 g |
| B | 12.89 g |
| C | 11.26 g |
| D | 7.35 g |
Discussion
The simulation results for the four model variations have been completed and documented. The crashworthiness comparison of the four model variations is further analyzed and discussed to determine compliance with the EN 15227/SNI 8826 Standard for a collision speed scenario of 10 m/s. For a collision speed scenario of 11.176 m/s, the crashworthiness comparison of the four model variations is also analyzed and discussed to determine compliance with 49 CFR 238 Subpart H.
Crash Force
In 10 m/s collision speed, the peak crash force of Variation A was measured at 15.16 MN, significantly exceeding the peak crash force of the conventional Indonesian passenger train, which is recorded at 3.39 MN. (Setiawan & Pamintori, 2017). This due to the variation A uses full aluminum extrusion, resulting in higher stiffness compared to conventional passenger train that constructed from structural beam (Setiawan & Pamintori, 2017). Comparatively, the peak crash force value is not significantly different from the peak crash force of the aluminum extrusion train studied by Zhu et al., which is approximately 14 MN (Zhu et al., 2019).
The difference in the crash force values is influenced by differences in the position of the door and bolster areas, which are located further back, and the wider door designs. In a structure with a high crash force, energy is absorbed rapidly, resulting in a shorter collision duration. Conversely, if the crash force is low, the absorption of the same amount of energy takes longer. This was revealed in both 10 m/s collision speed and 11.176 m/s scenarios.
Energy Absorption
In 10 m/s collision speed, variation A absorbed energy very quickly, similar to what happened to the aluminum extrusion train studied by Zhu et al. (Zhu et al., 2019). This is due to the high rigidity of variation A that makes the kinetic energy absorbed immediately. All variations present a more favorable value compared to the Indonesian conventional passenger train studied by Setiawan, et al., which absorbs only 87% of the kinetic energy (Setiawan & Pamintori, 2017).
Variation B exhibits a longer energy absorption duration compared to variation A, followed by variations C and D, respectively. After the end of the collision, the kinetic energy shows a gently sloping curve, which indicates that the structure is no longer absorbing energy effectively. Variation D is well designed to absorb kinetic energy in a controlled manner so that the deceleration is controlled to the desired value. The energy absorption trend is similar in both 10 m/s collision speed and 11.176 m/s scenarios.
Length Reduction
A high crash force results in shorter deformation for the same amount of energy absorption (Setiawan et al., 2019). This aligns with the following equation (Urone et al., 2012).
\[W = F \cdot x = \frac{1}{2} k \cdot x \cdot x = \frac{1}{2} k \cdot x^2\] (1)
Where represents the work (in this context, energy absorption), denotes the applied force (crash force), is the stiffness, and is the displacement. The strategy employed to reduce acceleration involves decreasing the crash force by modifying the structure to exhibit lower stiffness. The energy absorption across the four variations does not differ significantly. Consequently, a structure with lower stiffness will undergo a longer deformation.
In 10 m/s collision speed, the survival space length reduction of all variations is lower than the length reduction of the Indonesian conventional passenger train, which is 38 mm (Setiawan & Pamintori, 2017). This is due to the stiffness of the Indonesian conventional passenger train structure not being too high both in the survival area and the vestibule area, so that the length reduction is high and distributed to the survival space. The length reduction of the whole Indonesian conventional passenger train carbody is 1004 mm (Setiawan & Pamintori, 2017). Almost the same with variation D. The longitudinal elastic and plastic deformation values of all variations are much lower than the allowable length reduction criteria of EN 15227/SNI 8826 i.e. 157.5 mm for 15750 mm passenger area length(EN 15227 Railway Applications - Crashworthiness Requirements for Railway Vehicle Bodies, 2008; EN 15227 Railway Applications - Crashworthiness Requirements for Railway Vehicle Bodies, 2020; SNI 8826:2019 Aplikasi Perkeretaapian - Crashworthiness Pada Sarana Perkeretaapian, 2019).
In 11.176 m/s collision speed, all design variations demonstrated satisfactory performance in survival space length reduction. The length reduction criteria of 49 CFR 238 Subpart H are the same as the EN 15227/SNI 8826 criteria. For the 15750 mm passenger area length, the length reduction of the survival space should not exceed 157.5 mm. The longitudinal elastic and plastic deformation values of all variations are much lower than the allowable length reduction criteria of 49 CFR 238 Subpart H.
Deceleration
As previously discussed, the crash force for variations B, C, and D has shown a successive decrease. This crash force reduction strategy aims to reduce the deceleration value, as considered from Newton's second law:
\[F = m \cdot a \tag{2}\] where is the force (in this case, the crash force), is the mass, and is the change in velocity (acceleration or deceleration). According to this law, the value of is directly proportional to the value of . The mass changes resulting from model modifications are not significantly different. Therefore, with a lower value, the value is also lower. Consequently, variations with lower crash forces experience longer deformations to achieve relatively the same energy absorption. In other word, The higher the value of deceleration, the greater the chance of injury to passengers (Severson et al., 2004).
In 10 m/s collision speed, the mean deceleration over the collision time of variation A was 18.89 g. The deceleration was substantially higher compared to the K1 passenger train, which exhibited a value of 8.8 g (Setiawan & Pamintori, 2017). This is due to the higher rigidity of the HST trailer made from aluminum extrusion than the K1 passenger train made from structural beams. In 10 m/s collision speed, the deceleration criteria were evaluated according to EN 15227/SNI 8826 in 3 methods. EN 15227:2008/SNI 8826:2019 limited the mean deceleration value over the collision time to 5 g (EN 15227 Railway Applications - Crashworthiness Requirements for Railway Vehicle Bodies, 2008; SNI 8826:2019 Aplikasi Perkeretaapian - Crashworthiness Pada Sarana Perkeretaapian, 2019). The deceleration criteria of EN 15227:2008/SNI 8826:2019 that cannot be fulfilled by variations A, B, C, and only can be fulfilled by variation D. The latest EN 15227 standard, i.e., EN 15227:2020, limited the maximum deceleration value for a 30-ms moving average duration to 10 g and the maximum deceleration value of a 120-ms moving average duration should not exceed 5 g. The deceleration criteria of EN 15227:2020 was also successfully fulfilled only by variation D.
In 11.176 m/s collision speed, the deceleration criteria were evaluated according to 49 CFR 238 Subpart H which regulated the maximum deceleration value of 100 ms moving average duration should not exceed 5 g. The four model variations cannot meet the deceleration criteria of 49 CFR 238 Subpart H. Variation D could not meet the deceleration criteria because the vestibule area was fully deformed. The maximum deceleration value for the moving average duration of 100 ms of variation D before the vestibule area is fully deformed was 4.95 g. The surge in the maximum deceleration value is caused by survival space structure which maintained using full aluminum extrusion. The actual crash involving 2 vestibule areas, which means there are 2 crash zone areas that can absorb energy until the end of the collision. However, this study does not cover the train-to-train impact scenario. This can be further studied to reveal whether variation D can meet the 49 CFR 238 Subpart H crashworthiness criteria in the train-to-train impact scenario.
Collision Process
Figure 14 illustrates a comparative analysis of the collision processes among the four variations. The colour plot illustrates the longitudinal deformation, as indicated by the legend, with measurements provided in millimeter (mm). As depicted in Table 3 and Figure 14, Variation A exhibits the least deformation due to its relatively stiff structure. Consequently, variation A has the shortest collision duration among the variations. This brief collision duration results in a high deceleration value as variation A absorbs energy rapidly. In contrast, variations B, C, and D are designed to undergo more extended deformation, allowing for a gradual and controlled energy absorption. This design approach ensures that the deceleration values for these variations meet the required criteria.
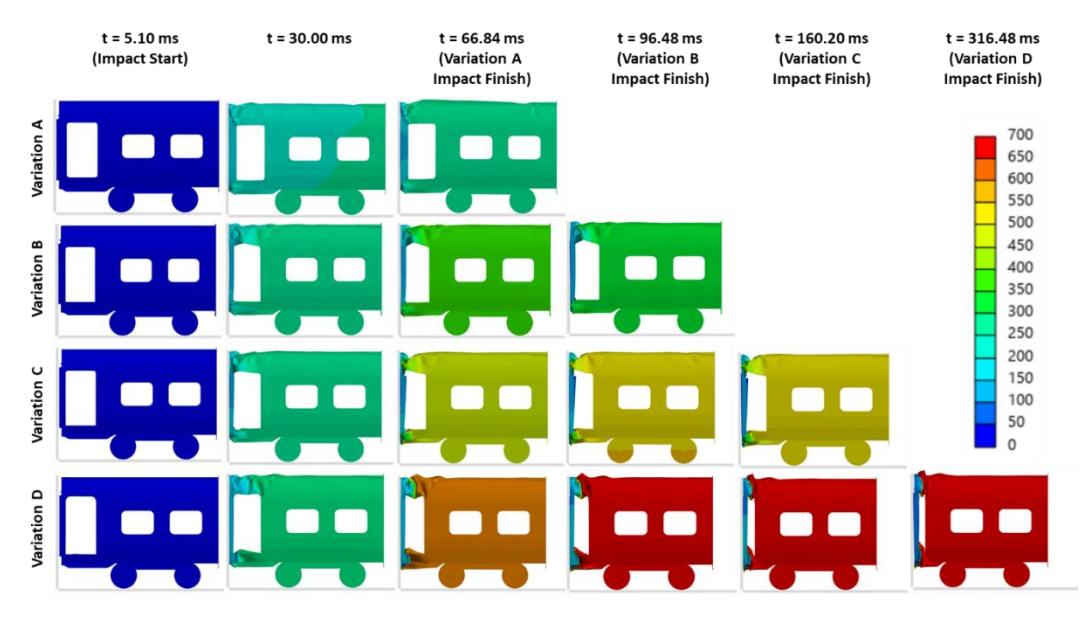
Structure Response due to the 10 m/s collision speed.
Figure 15 illustrates the collision processes of variations at a speed of 11.176 m/s. The colour plot illustrates the longitudinal deformation, as indicated by the legend, with measurements provided in millimeter (mm). Similar to the results at 10 m/s, variation A shows the least deformation due to its stiff structure. Consequently, variation A has the shortest collision duration among the variations. The rapid energy absorption by variation A leads to a high deceleration value. Conversely, variations B, C, and D are designed to deform over a longer period, allowing for gradual and controlled energy absorption.
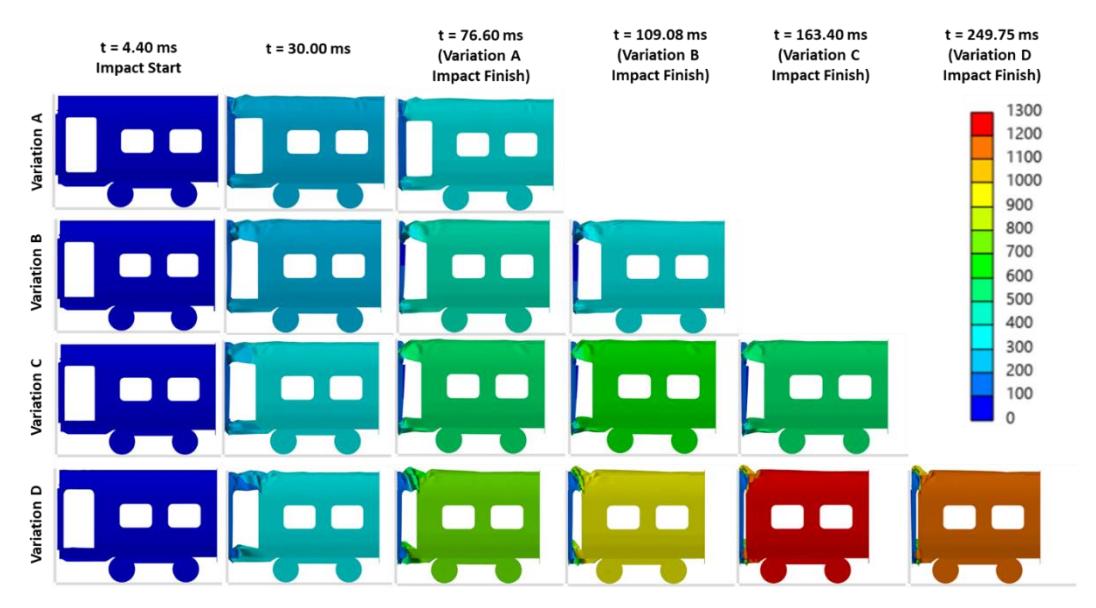
Structure Response due to 11.176 m/s collision speed.
Conclusion
The crashworthiness analysis of the first Indonesian HST trailer design was examined by simulating the collision of the train with a rigid wall. The collision speed was adjusted to meet the conditions regulated by EN 15227/SNI 8826 and 49 CFR 238 Subpart H standard. The evaluation of the crashworthiness parameters also referred to the criteria of the mentioned standards.
The crashworthiness performance of the train designs varies significantly based on the structural configuration of the vestibule area. The design with full aluminum extrusion demonstrates the highest peak crash force and deceleration, whereas replacing the aluminum with a roof frame structure reduces both values. Further improvements are observed when both roof and floor are framed, and the most favorable outcome is achieved with a modified floor frame that eliminates aluminum extrusion entirely in the vestibule. This configuration not only meets EN 15227/SNI 8826 deceleration criteria but also exhibits the lowest crash force, although it does not satisfy 49 CFR 238 Subpart H due to complete vestibule deformation. In terms of energy absorption, all designs perform effectively at collision speeds of 10 m/s and 11.176 m/s; however, the full aluminum structure absorbs energy very rapidly, while the designs with reduced stiffness—roof frame, roof and floor frame, and modified floor frame—enable more controlled and prolonged energy absorption, with the modified floor frame offering the longest duration. Regarding survival space reduction, the full aluminum design shows negligible reduction and meets all regulatory standards, yet as aluminum extrusion is progressively reduced, the length reduction becomes smaller, culminating in no reduction with the modified floor frame. All configurations comply with EN 15227/SNI 8826 and 49 CFR 238 Subpart H for survival space. Considering all aspects—crash force and deceleration, energy absorption, survival space reduction, and regulatory compliance—the design with a modified floor frame and no aluminum extrusion in the vestibule is deemed optimal for maximizing passenger safety, minimizing structural deformation, and ensuring controlled crash behavior, although partial aluminum retention may be necessary to meet all regulatory deceleration limits.
Based on the study results, it is recommended to utilize a combination of aluminum extrusion structures and structural beam structures. Specifically, the vestibule area should incorporate structural beam structures to mitigate high deceleration values during collisions. Additionally, extending the vestibule area is advised to enhance energy absorption, thereby ensuring that the survival space, constructed from aluminum extrusion, does not serve as the energy absorber.
Acknowledgment
The authors are greatly appreciative of the support provided by PT. INKA, including the provision of specification data and model geometry. The authors also gratefully acknowledge the financial support from Institut Teknologi Sepuluh Nopember (Sepuluh Nopember Institute of Technology) for this work, under the Publication Writing and IPR Incentive Program (PPHKI) 2024 project scheme.
Compliance with ethics guidelines
The authors declare they have no conflict of interest or financial conflicts to disclose.
This article contains no studies with human or animal subjects performed by authors.