
Introduction
Global warming is a critical global issue characterized by rising planetary temperatures and sea levels, primarily due to the melting of polar ice sheets. One of the main drivers of global warming is the accumulation of greenhouse gases, with carbon dioxide (CO2) emissions accounting for approximately 65% of total greenhouse gas emissions (Global Greenhouse Gas Overview, 2023). Currently, fossil fuels and petroleum products remain the dominant energy sources, particularly in the transportation sector, contributing significantly to CO2 emissions. Although electric vehicles offer a promising way to reduce these emissions, they face challenges such as underdeveloped infrastructure, limited power output, and the ongoing maturation of battery technologies. As a result, the development and adoption of carbon-free alternative fuels present a viable pathway to mitigating global warming (Hu et al., 2024).
Previous studies have investigated various alternative fuels, including hydrogen (Sapnken et al., 2024), biofuels (Kumar et al., 2024), and ammonia (Mohammed et al., 2024). Among these, hydrogen is particularly attractive due to its clean combustion, which primarily produces water (H2O). However, its widespread adoption is hindered by significant challenges related to storage (Hamedani et al., 2024) and transportation (Moriarty & Honnery, 2019). Hydrogen is prone to boil-off during transport and requires extremely high pressure and cryogenic temperatures for storage, leading to energy losses and safety concerns. In contrast, ammonia offers several practical advantages. It can be synthesized efficiently via the well-established Haber-Bosch process and has a higher volumetric energy density than hydrogen, making it easier to store and transport (Brandon et al., 2021). These characteristics position ammonia as a promising alternative fuel.
4Mechanical Engineering Department, Petra Christian University, Surabaya 60236, Indonesia
Although ammonia offers several advantages as an engine fuel, it also presents notable challenges, including toxicity (Hu et al., 2024), high ignition energy requirements (Lanni et al., 2022), and low laminar burning speed (Hayakawa et al., 2015). To address these limitations, researchers have explored strategies to enhance ammonia's combustion performance in internal combustion engines. One effective approach involves blending ammonia with more reactive co-fuels. Previous studies have investigated mixtures of ammonia with kerosene (Zhu et al., 2024) and ethanol (Uddeen et al., 2024). In addition, the use of sub-chamber in high-compression-ratio engines has been shown to enhance ammonia combustion (Ichiyanagi et al., 2024; Yilmaz et al., 2023; Guo et al., 2022). Ethanol is particularly promising as a co-fuel due to its renewable nature and carbon-neutral emissions profile. Compared to gasoline, ethanol offers a highoctane number, which helps suppress engine knocking (Li et al., 2022). These characteristics make ethanol a suitable co-fuel for ammonia. While previous research has examined the effects of ignition timing in engines fueled by ammonia and hydrogen, showing that earlier ignition timing increases in-cylinder pressure (Wang et al., 2024), the influence of ignition timing on ammonia/ethanol combinations remains underexplored. Therefore, this study investigates the effects of ignition timing on combustion performance using an ammonia/ethanol fuel mixture.
Building on previous studies, this research employs a high-compression-ratio spark-assisted compression ignition (SACI) engine modified with a sub-chamber to investigate the combustion characteristics of an ammonia/ethanol mixture (Ichiyanagi et al., 2024). Given the novelty of this fuel combination, the study focuses on analyzing the effects of ignition timing on combustion performance while maintaining stable operation across ammonia energy ratios of 40% to 60%.
Experimental Methods
Experimental Setup
For this experiment, a modified YANMAR TF120V diesel engine was used, selected for its high compression ratio and adapted from previous studies (Yilmaz et al., 2023). The engine specifications are summarized in Table 1, and the experimental setup is illustrated in Figure 1. The system includes fuel delivery components, oxygen and NOx sensors, a water-cooling system, a catalyst, intake and exhaust systems, a data acquisition system, temperature and pressure control mechanisms, and a sub-chamber.
Experimental schematic of the present engine experiment setup.
The engine has a displacement of 6.38 cm³, with a bore of 92 mm and a stroke of 96 mm (Table 1). The sub-chamber, ith an opening area o 52.6 mm², is integrated into the main combustion chamber, hich has a volume o 23.5 × 10⁻⁶ m³. Operating at a compression ratio of 17.7, the engine delivers nearly twice the power of a conventional spark-ignition (SI) engine. A spark plug is installed at the top of the sub-chamber, while an injector is positioned on the intake manifold, connected to ethanol and ammonia fuel tanks. Combustion pressure of the main chamber is monitored using a pressure sensor. The engine is coupled to an eddy current dynamometer via an electromagnetic clutch to control engine speed. Intake pressure is manually regulated using a throttle valve and measured with a pressure sensor. The engine control unit (ECU) processes sensor inputs, controls fuel ratio and quantity, and manages ignition and injection timing. A rotary encoder sends a top dead center (TDC) signal to the ECU every two crankshaft revolutions to track piston position. Emissions are monitored using NOx and oxygen sensors installed in the exhaust system. The cooling system consists of a heat exchanger, pump, coolant heater, and temperature sensors, all connected to the ECU for real-time monitoring and control. A catalyst in the exhaust line is used to reduce unburned gases.
Table 1 Engine specifications of the present experimental setup
| Type of Engine Used [-] | Single-cylinder Horizontal Oriented Diesel Engine |
|---|---|
| Max Speed [rpm] | 2400 |
| Engine Model [-] | YANMAR TF 120V - E |
| Ignition Method [-] | Spark Ignition |
| Valve Mechanism [-] | Overhead Valve |
| Type of Aspiration [-] | Naturally Aspirated |
| Fuel Injection Method [-] | Port Injection |
| Standard Injection Timing [°CA ATDC (Intake Stroke)] | 660 |
| Total Displacement [cm3 ] | 63.8 |
| Compression Ratio [-] | 17.7 |
| Bore x Stroke [mm] | 92 x 96 |
| Sub-chamber [-] | Spherical Swirl |
| Sub-chamber Volumetric Displacement [cm3 ] | 23.5 |
| Orifice count [-] | 1 |
| Orifice Area (Cross-section) [mm2 ] | 52.6 |
| Engine Cooling System [-] | Water Cooling with Heat Exchanger |
Experimental Conditions and Processes
This study examined the performance and combustion properties of ammonia/ethanol blends in a SACI engine equipped with a sub-chamber. The experimental conditions are summarized in Table 2, and data were recorded every 100 combustion cycles. Gaseous ammonia and liquid ethanol were delivered via port fuel injection into the intake manifold, with both ignition timing and fuel mixture ratios varied systematically. Ignition timings of 0°, 2°, 4°, 6°, and 8° crank angle before top dead center (°CA BTDC) during the compression stroke was tested with ammonia energy ratios of 40%, 50%, and 60%. The ammonia energy ratio refers to the ratio of energy contributed by ammonia relative to the total energy content of the fuel mixture, based on the lower heating values of the fuel. The ECU controlled the fuel ratio accordingly.
Table 2 Investigated Conditions for the Present Engine Study.
| Fuel used in the experiment [-] | Ammonia, Ethanol |
|---|---|
| Ammonia Energy Ratio [%] | 40 to 60 (with increments of 10) |
| Ignition Timing [°CA BTDC (Compression Stroke)] | 0, 2, 4, 6, 8 |
| Injection Timing [°CA ATDC (Intake Stroke)] | 660 |
| Engine [rpm] | 1000 |
| Excess Air Ratio [-] | 1.2 |
| Coolant Temperature [°C] | 70 |
| Intake Air Temperature [°C] | 25 |
| Intake Valve Opening (IVO) [°CA ATDC (Intake Stroke)] | -6 |
| Intake Valve Closing (IVC) [°CA ATDC (Intake Stroke)] | 215 |
| Exhaust Valve Opening (EVO) [°CA ATDC (Intake Stroke)] | -218 |
| Exhaust Valve Closing (EVC) [°CA ATDC (Intake Stroke)] | 7 |
Table 2 also provides the intake and exhaust valve timings. During the compression stroke, part of the air-fuel mixture was directed into the sub-chamber. Ignition was initiated slightly before the end of the compression stroke using a spark
plug installed in the sub-chamber. The ignited mixture then propagated into the main combustion chamber through the sub-chamber orifice during the power stroke, initiating combustion of the well-mixed charge in the main chamber.
Analytical Methods
Heat transfer from the combustion gases to the cylinder walls occurs primarily through convection and radiation. However, in this analysis only convective heat transfer is considered, as the contribution of radiative heat transfer is negligible in spark ignition engines (Lounici et al., 2011). Accordingly, the convective heat transfer at each crank angle, \(Q_{ht(\theta)}\), is calculated using Eq. (1).
\[Q_{ht(\theta)} = h_{c(\theta)} A_c (T_{(\theta)} - T_w \tag{1}\]
\(T_{\vartheta}\) corresponds to the in-cylinder temperature at every crank angle [K] and \(T_w\) corresponds to the average temperature of the wall cylinder [K]. \(A_c\) is the combustion chamber area [m²], and \(\theta\) is the instantaneous crank angle position in degrees [°CA]. Additionally, \(h_c\) is the convective coefficient for gas heat transfer [kW/m²K]. Eq. (2) expresses Hohenberg's correlation (Hohenberg, 1979), which serves as the foundation for the heat transfer coefficient, \(h_c\).
\[h_{c(\theta)} = 1879 P_{(\theta)}^{0.8} T_{(\theta)}^{-0.4} V_{(\theta)}^{-0.06} (S_{(p)} + c)^{0.8}\] (2)
\(T_{\vartheta}\) and \(P_{\vartheta}\) represent the volume [m<sup>3</sup>] and in-cylinder pressure [MPa] at every crank angle, respectively. c represents the Hohenberg recommended calibration factor with a value of 1.4 (Hohenberg, 1979). Eq. (3) is used to calculate \(S_{\rho}\), which is the average speed of the piston [m/s].
\[S_P = 2S \frac{n}{60} \tag{3}\]
n is the engine speed [rpm] and S is the piston stroke [m].
Eq. (4) is used to determine \(Q_{HRR(\vartheta)}\), which is the heat release rate (HRR).
\[Q_{HRR(\theta)} = \frac{1}{\kappa - 1} \left( v_{\theta} \frac{dP}{d\theta} + \kappa P_{\theta} \frac{dV}{d\theta} \right) + Q_{ht} \tag{4}\]
\(\frac{dV}{d\theta}\) and \(\frac{dP}{d\theta}\) are the rate of change of volume [m³] and pressure [MPa] in the main and sub-chamber for each crank angle, respectively, while \(\kappa\) is the specific heat ratio. The in-cylinder pressure data collected during the experiments were used to calculate the indicated mean effective pressure (IMEP), using Eqs. (5) and (6).
\[IMEP = \frac{1}{V_C} \cdot \oint PdV \tag{5}\]
\[IMEP = \frac{1}{V_S} \cdot \sum_{\theta=0}^{a-1} \frac{P_{\theta+1} + P_{\theta}}{2} \cdot (V_{(\theta+1)} - V_{(\theta)})\] (6)
a corresponds to the cumulative number of crank angles in a cycle, and Vs corresponds to the stroke volume [m³]. Eq. (7) defines the equation to calculate the combustion duration.
Combustion Duration = \[Ca90 - CA10\] (7)
CA10 and CA90 are the crank angles at which 10% and 90% of the total heat is released, respectively.
Eq. (8) is used to calculate the in-cylinder temperature[K].
\[T_{(\theta)} = \frac{P_{(\theta)} \cdot V_{(\theta)}}{P_{IVC} \cdot V_{IVC}} T_{IVC} \tag{8}\]
\(T_{IVC}\), \(T_{IVC}\), and \(V_{IVC}\) are the temperature [K], pressure [MPa], and volume [m<sup>3</sup>] during intake valve closing (IVC), respectively.
Eq. (9) determines \(\eta_i\), which is the indicated thermal efficiency.
\[\eta_i = \frac{W_i}{m_a H_{ua} + m_e H_{ue}} \tag{9}\]
Here, m<sub>e</sub> and m<sub>a</sub> represent the fuel masses [kg] of the injected ethanol and ammonia, respectively. H<sub>ue</sub> and H<sub>ua</sub> represent the lower heating values [kJ/kg] of ethanol (26,700 kJ/kg) and ammonia (18,600 kJ/kg), respectively.
\[W_i = (W_C + W_P) \cdot 1000 \tag{10}\]
\[W_C = \int_{180^0}^{360^0} P \, dV \tag{11}\]
\[W_C = \int_{360^0}^{540^0} P \, dV \tag{12}\]
\(W_i\) corresponds to the indicated work for each engine cycle [kJ]. \(W_C\) and \(W_P\) correspond to the amount of work required during the compression [kJ] and expansion [kJ] stages, respectively.
Experimental Results
Figure 2 presents the in-cylinder pressure results for various ignition timings and ammonia energy ratios tested in this experiment. Ignition timing was varied at 0°, 2°, 4°, 6°, and 8 °CA BTDC. Earlier ignition timing led to higher in-cylinder peak pressures, as combustion was initiated earlier in the compression stroke. Conversely, increasing the ammonia energy ratio resulted in lower peak pressure and delayed pressure rise. These trends are more pronounced at later ignition timings. The recorded in-cylinder pressure data were subsequently used to calculate both the heat release rate and IMEP for each ignition timing.
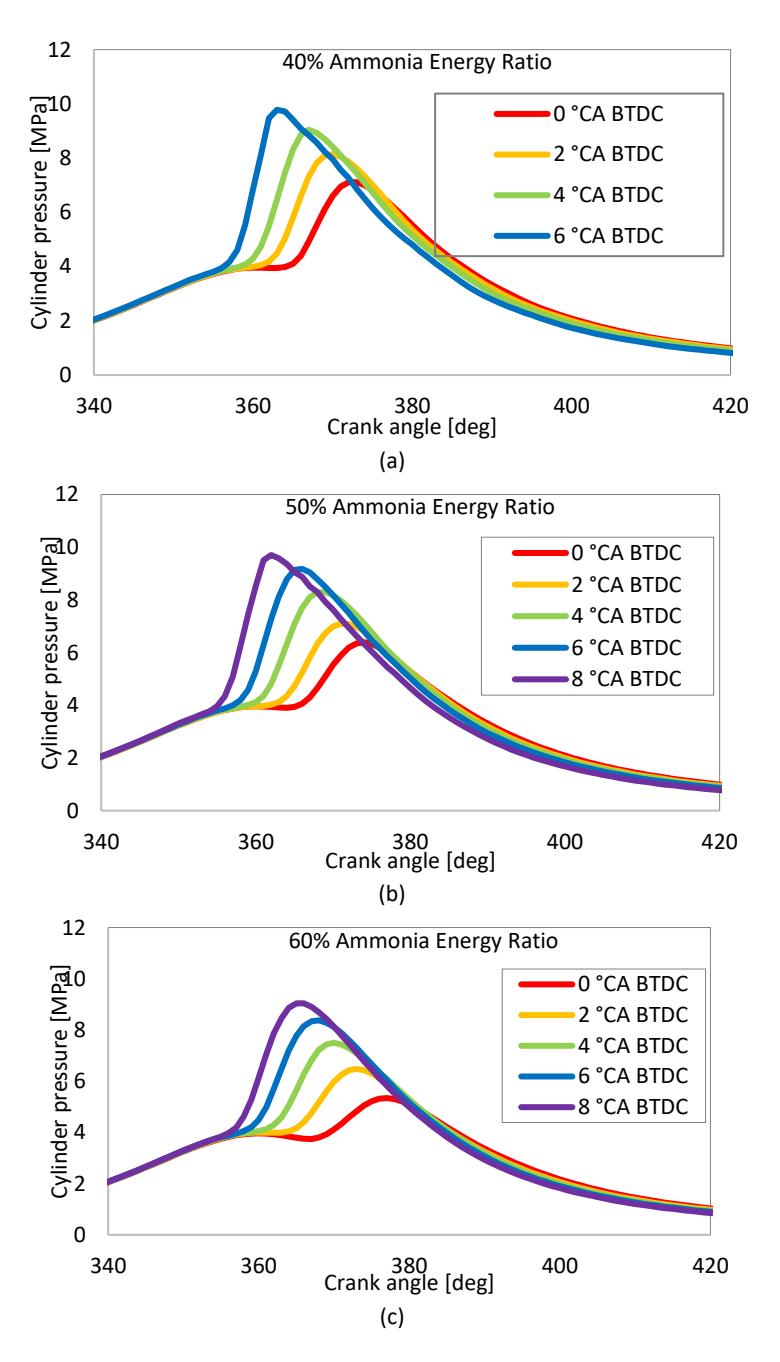
Figure 2 In-cylinder pressure with respect to crank angle position at various ignition timings.
Figures 3 illustrates the heat release rate for a single combustion cycle under varying ignition timings and ammonia energy ratios, as calculated using Eq. (4). Consistent with the in-cylinder pressure trends, advancing the ignition timing resulted in earlier and higher heat release rate across all ammonia energy ratios. Similarly, lower ammonia energy ratios produced higher peak heat release ratio values for each ignition timing. The highest heat release rate values for the 50% and 60% ammonia energy ratios were observed at 8 °CA BTDC, reaching 170 J/°CA and 139 J/°CA, respectively. In contrast, the 40% ammonia energy ratio yielded the highest overall heat release rate of 212 J/°CA at 6 °CA BTDC. These results indicate that lower ammonia energy ratios combined with earlier ignition timing enhance the combustion heat release rate.
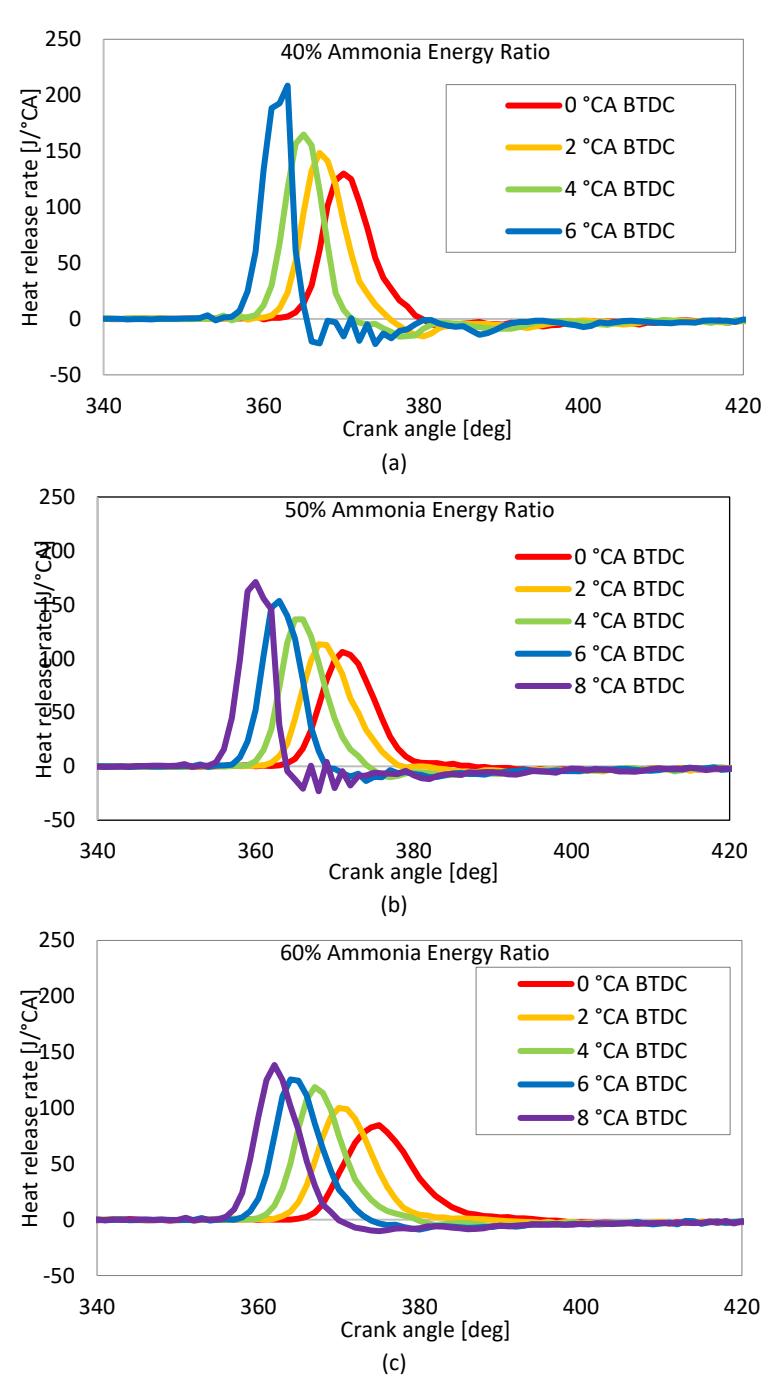
Figure 3 Heat release rate with respect to crank angle position at various ignition timings.
Figure 4 presents the IMEP results for various ignition timings and ammonia energy ratios. IMEP, defined in Eq. (6), represents the indicated work per unit stroke volume, and is a key parameter for evaluating engine performance. As the ammonia energy ratio increased, IMEP generally decreased. This trend is attributed to the slower flame speed of ammonia, which leads to delayed combustion and reduced pressure buildup. The decline in IMEP was more gradual at higher ammonia ratios due to the combustion's slower progression. For ammonia energy ratios of 50% and 60%, advancing the ignition timing up to 6 °CA BTDC had little effect on IMEP. However, for the 50% ratio, a further advance to 8 °CA BTDC caused a noticeable drop in IMEP, indicating potential combustion inefficiency at overly advanced timings.
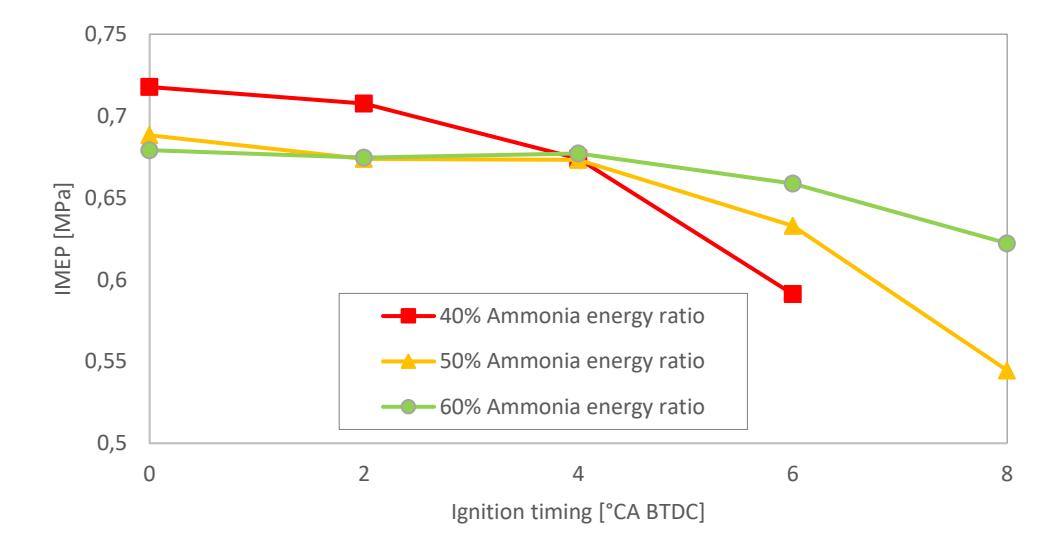
IMEP with respect to ignition timing with various ammonia energy ratios.
Figure 5 shows the combustion duration results for all tested conditions. Combustion duration was defined as the crank angle interval between 10% and 90% of total heat release (CA10 to CA90), as specified in Eq. (7). This interval represents the main phase of combustion ithin the c linder. he results indicate that combustion duration increases ith higher ammonia energ ratios, due to ammonia's slo er lame speed. he 40% ammonia blend consistentl exhibited the shortest combustion durations. The minimum recorded duration was 4 °CA, achieved with the earliest ignition timing for both the 40% and 50% ammonia blends. In contrast, the 60% ammonia energy ratio showed the longest combustion durations across all ignition timings. Across all conditions, advancing the ignition timing resulted in shorter combustion durations. The overall variation in combustion duration between the fastest and slowest cases was 7 °CA.
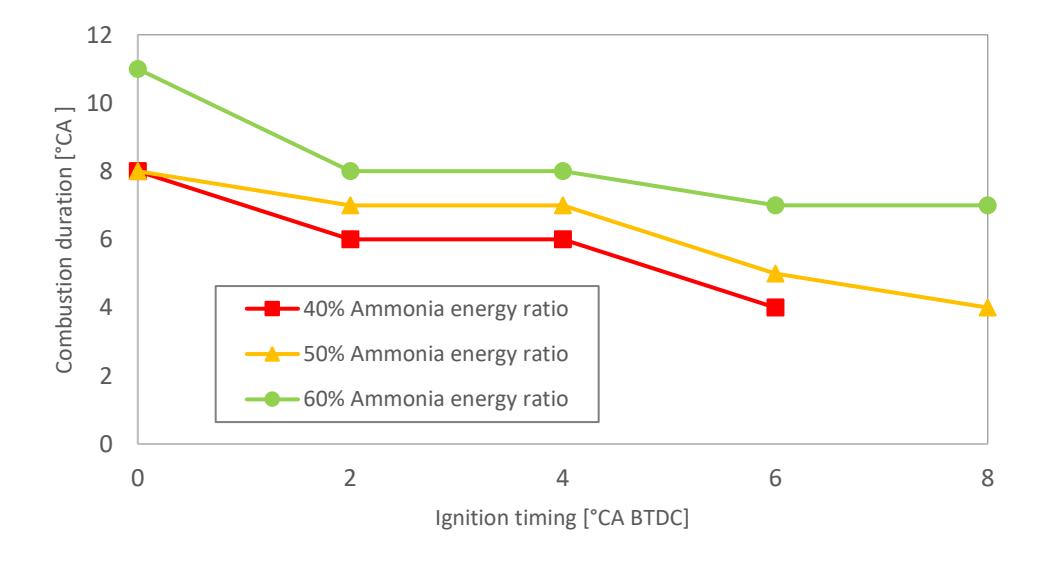
Combustion duration with respect to various ignition timing with various ammonia energy ratios.
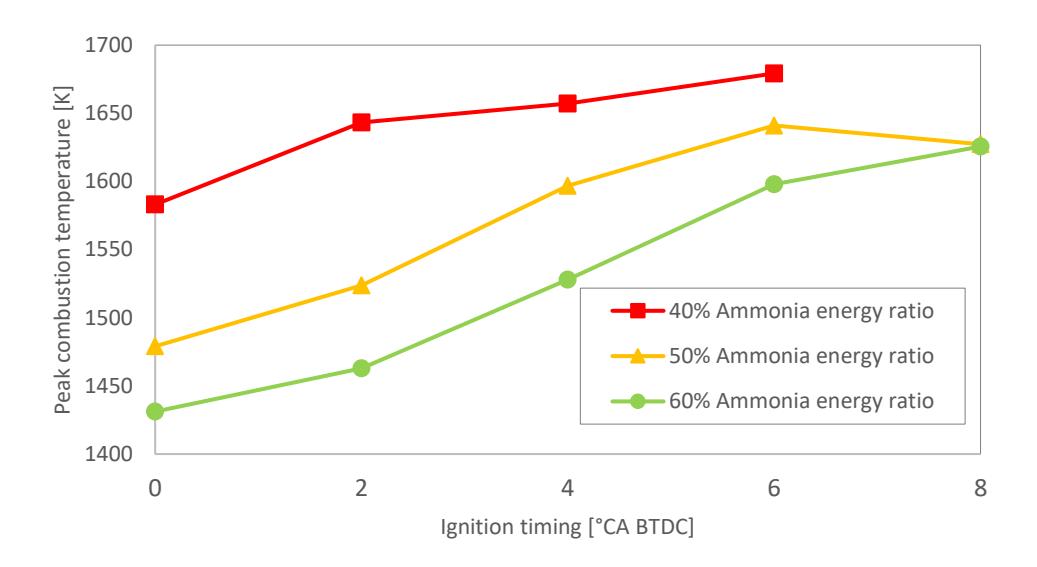
Peak gas temperature with respect to ignition timing with various ammonia energy ratios
Figure 6 presents the peak gas temperatures for each condition, calculated using Eq. (8). Advancing the ignition timing led to higher maximum combustion temperatures across all ammonia energy ratios. Conversely, for a fixed ignition timing, increasing the ammonia energ ratio resulted in a decrease in pea temperature due to ammonia's lo er lame speed and slower combustion characteristics. The highest peak temperature was observed at the earliest ignition timing and the lowest ammonia energy ratio. However, a slight decline in peak temperature was noted when advancing ignition to the earliest setting, likely due to early combustion phasing before optimal pressure buildup. Despite this, ammonia combustion inherently promotes NOx formation due to the nitrogen present in its molecular structure. Figure 7 shows that NOx emissions decrease with delayed ignition timing across all ammonia energy ratios. As previously discussed, and shown in Figure 6, NOx emissions correlate with combustion temperature and tend to rise with higher peak temperatures (Qian et al., 2024).
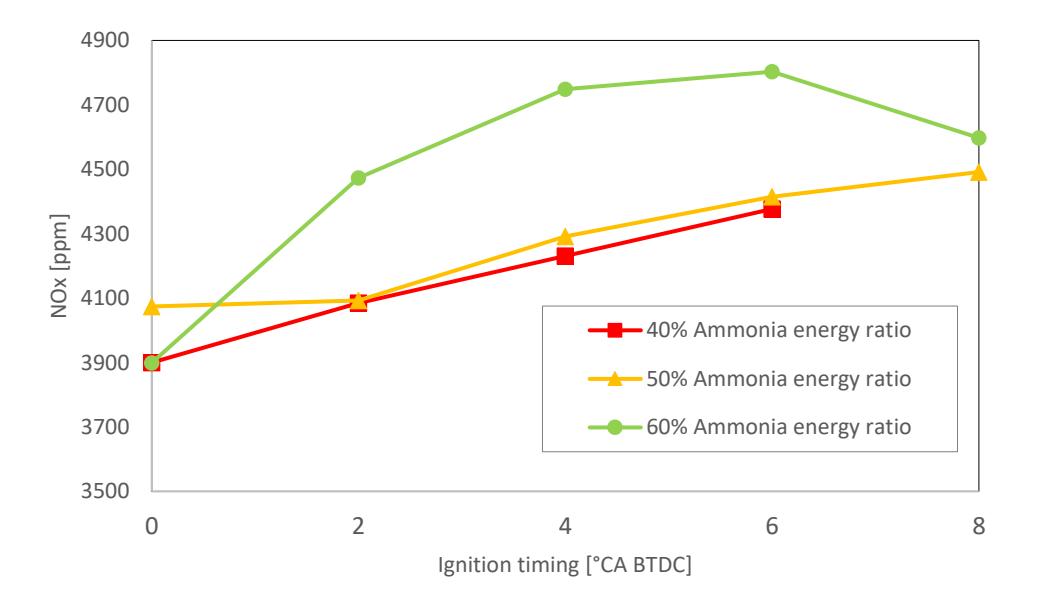
NOx emissions with respect to ignition timing with various ammonia energy ratios.
Figure 8 shows the indicated thermal efficiency for various ammonia energy ratios and ignition timings, calculated using Eq. (9). The trends closely follow those observed for IMEP (Figure 4), reflecting their dependency. At a 40% ammonia energy ratio, thermal efficiency was highest at later ignition timings but dropped sharply at 4 °CA BTDC and continued to decline with further ignition advance. For the 50% ammonia energy ratio, thermal efficiency remained relatively stable across later ignition timings, peaking at 4 °CA BTDC. However, advancing the ignition beyond this point led to a significant drop, with the lowest efficiency observed at the earliest timing. A similar pattern was observed for the 60% ammonia energy ratio. While efficiency remained stable at later ignition timings, it declined beyond 4 °CA BTDC. However, compared to the 50% ammonia energy ratio, the 60% ammonia energy ratio exhibited slightly higher overall efficiency values at earlier timings. In summary, the 40% ammonia blend achieved better efficiency at later ignition timings but showed a sharp decline with excessive ignition advance. In contrast, higher ammonia ratios (50% and 60%) offered more stable performance at later ignition timings but experienced efficiency losses at earlier ignition points.
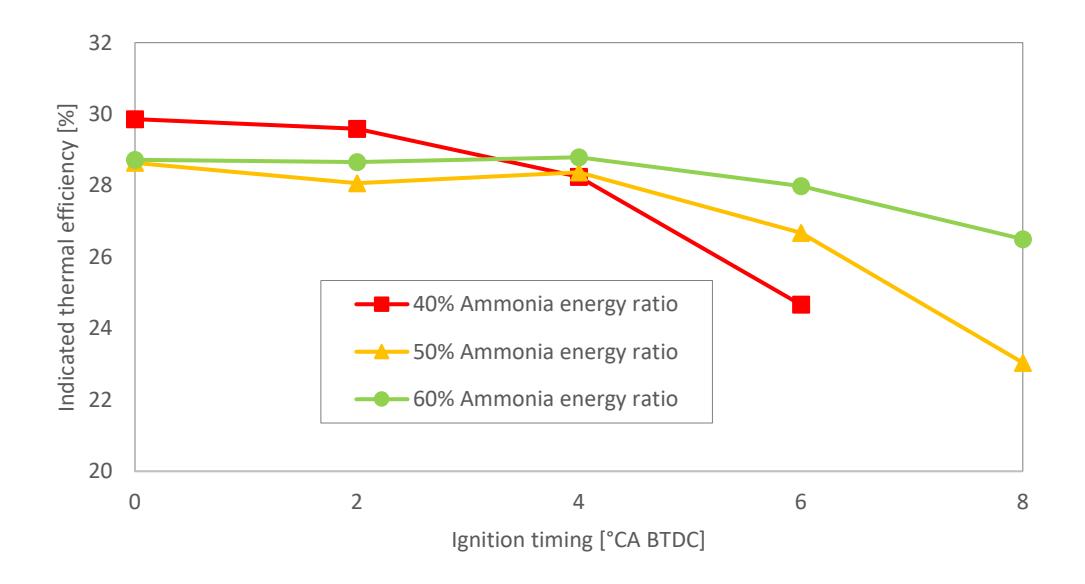
Indicated thermal efficiency with respect to ignition timing with various ammonia energy ratios.
Discussion
As shown in Figure 2, the peak in-cylinder pressure increased with advanced ignition timing due to the expansion of gases from early combustion, combined with the decreasing chamber volume during the compression stroke. This also explains why the peak pressure occurred earlier in the cycle as ignition was advanced. The ammonia energy ratio significantly influenced cylinder pressure. Lower ammonia ratios resulted in higher peak pressures. This is primarily due to ammonia's high ignition temperature and low reactivity, resulting in an incomplete combustion with higher ammonia concentrations. Additionally, ammonia has a slower laminar flame speed compared to ethanol (Wang et al., 2022), which slows overall flame propagation in the mixture. n contrast, ethanol's higher lame speed enhances combustion when present in greater proportions (Yang et al., 2020). As a result, increasing the ammonia content leads to delayed and less intense combustion, as reflected in the lower and later-occurring pressure peaks in the in-cylinder pressure traces.
As shown in Figure 3, advancing the ignition timing consistently led to earlier combustion onset and increased peak heat release rates across all ammonia energy ratios. Additionally, lower ammonia energy ratios produced higher peak heat release rates, regardless of the ignition timing. The highest heat release was observed at 6 °CA BTDC, with a 40% ammonia energy ratio. These results indicate that lower ammonia content, combined with earlier ignition timing, promotes more rapid and intense combustion, as reflected by the higher and earlier heat release rates.
As shown in Figure 4, the IMEP decreases with increasing ammonia energy ratio. This trend is primarily due to the low laminar burning velocity of ammonia, which results in reduced in-cylinder pressure and, consequently, lower engine efficiency at higher ammonia concentrations (Dong et al., 2023). A notable drop in IMEP was observed for the 40% and 50% ammonia energy ratios when using advanced ignition timings. This is attributed to early combustion phasing, where the higher reactivity and flame speed of ethanol cause combustion to begin while the piston is still near bottom dead center. In this condition, the cylinder volume is relatively large, reducing the effective work output and leading to a lower IMEP.
Figure 5 further supports this behavior, showing that combustion duration is primarily governed by the low combustion speed of ammonia. Earlier ignition timings consistently resulted in shorter combustion durations across all ammonia energy ratios. This is due to the higher in-cylinder pressure achieved with advanced ignition, which increases the heat
release rate and accelerates flame propagation. In contrast, delayed ignition resulted in slower, less efficient combustion, especially at higher ammonia concentrations.
Figure 6 and 7 illustrate the relationship between ignition timing, ammonia energy ratios, peak gas temperature, and NOx emissions. Lower NOx emissions observed at later ignition timings are primarily due to incomplete combustion, which leaves excess unreacted ammonia in the cylinder. This residual ammonia can participate in post-combustion reactions with NOx, forming nitrogen and water vapor, a process known as DeNOx (Tian et al., 2024). The DeNOx mechanism involves selective non-catalytic reduction (SNCR), where ammonia react with NOx species under specific temperature ranges. These reactions reduce NOx concentrations and yield harmless products, as described by the following reaction pathways (Tian et al., 2024). This effect is evident at 0°CA BTDC, where the 60% ammonia energy ratio, despite its higher ammonia content, exhibited NOx emission levels comparable to those of lower ammonia energy ratios.
\[4NO + 4NH_3 + O_2 \rightarrow 4H_3 + 6H_2O\]
\(NO + NO_3 + 2NH_3 \rightarrow 2H_2 + 3H_2O\)
\(6NO_2 + 8NH_3 \rightarrow 7N_2 + 12H_2O\)
As shown in Figure 8, the indicated thermal efficiency results follow a trend consistent with the minimum spark advance for best torque (MBT), as described by Nora et al., (2018). For each ammonia energy ratio, thermal efficiency increased with ignition advance up to a certain point, corresponding to the MBT, after which it began to decline. This peak represents the optimal ignition timing for maximum efficiency, beyond which further advancement leads to early combustion, reduced pressure buildup, and lower efficiency. These results indicate that the thermal efficiency of the ammonia/ethanol mixture is strongly influenced by both ignition timing and ammonia content.
Conclusion
This study investigated the effects of ignition timing and ammonia energy ratio on the combustion performance of an ammonia-ethanol dual-fuel engine using a SACI configuration with a sub-chamber. The key findings are summarized as follows
Increasing the ammonia energ ratio dela ed the combustion process due to ammonia's inherentl slo lame speed. This was evident in the heat release rate, in-cylinder pressure, and thermal efficiency results. Among all tested conditions, the lowest ammonia energy ratio (40%) yielded the best overall combustion and efficiency performance.
Advancing ignition timing led to higher heat release rate and in-cylinder pressure. For the 40% ammonia blend, optimal performance was achieved at 2 °CA BTDC, while for the 50% and 60% blends, optimal efficiency was obtained at 4 °CA BTDC. Overall, 4 °CA BTDC was identified as the most favorable ignition timing across different ammonia ratios.
Higher ammonia energy ratios extended combustion duration due to slower flame propagation. Advancing ignition timing shortened combustion duration by up to 4°CA. The maximum difference observed across all conditions was 7°CA, with the fastest combustion occurring at the lowest ammonia ratio and earliest ignition timing.
NOx emissions increased with both earlier ignition timing and higher ammonia ratios. However, in some cases, higher ammonia content led to lower NOx emissions due to the DeNOx process, in which excess unburned ammonia reacts with NOx to form nitrogen and water.
Acknowledgments
This research was supported by the Japan Society for the Promotion of Science, Grants-in-Aid for Scientific Research (No.19K04244), Sophia University, and Petra Christian University (project code 097/PSTM/ST/2023) as part of an international collaborative project. The authors gratefully acknowledge the support of these institutions.
Compliance with Ethics Guidelines
The authors declare they have no conflict of interest or financial conflicts to disclose.
This article contains no studies with human or animal subjects performed by authors.