
Introduction
Global warming has been one of the most critical global challenges faced by the world. It is characterized by a rise in Earth's average temperature. Over the past 50 years, this temperature increase has been primarily driven by intensified human activities resulting in heightened greenhouse gas emissions (U.S. Global Change Research Program, n.d.). In 2020, global greenhouse gas emissions reached approximately 48,000 Mt CO2 (Wiloso et al., 2024). Various countries have undertaken numerous mitigation and adaptation strategies to address climate change and its impacts. Among these efforts, reducing fossil fuel consumption has emerged as a significant approach to mitigating climate change. The transportation sector is the second-largest contributor to greenhouse gas (GHG) emissions in Indonesia, accounting for approximately 24.64% of total emissions, with land transportation contributing 90% of the sector's emissions (Ministry of Energy and Mineral Resources, 2020). This sector remains heavily reliant on fossil fuels, making it a significant source of GHG emissions in the country.
Indonesia's transportation sector almost entirely requires fuel oil (BBM) and produces GHG emissions. The transportation sector contributed 138.5 million tons of CO2e in 2013. This value has increased by 6.5% per year since 2000 (Pamudji et al., 2015). The target for reducing emissions from the energy and transportation sectors in Indonesia
Copyright by authors ©2026 Published by IRCS - ITB J. Eng. Technol. Sci. Vol. 58, No. 1, 2025, 31-46 is 0.038 Giga tons of CO2e (26%) and 0.056 Giga tons of CO2e (41%). This is stated in Presidential Regulation (Perpres) Number 61 of 2011 concerning the National Action Plan for Reducing Greenhouse Gas Emissions.
Railway transportation is widely recognized as one of the most environmentally friendly high-capacity transport options. Globally, rail transport accounts for approximately 8% of passenger travel and 7% of freight movement, while contributing only about 2% of total transportation sector emissions (Farooq et al., 2024). This efficiency is largely attributed to its lower energy consumption and emissions per transportation unit compared to road and air transport (da Fonseca-Soares et al., 2024). A study on CO2 emissions from diesel locomotives in Indonesia conducted in 2010 revealed that CO2 emissions depend on various factors, including the daily frequency or number of round trips, engine type, travel distance, and speed (Wibisono, 2011). Analysing carbon dioxide emissions from rail transport is crucial for enhancing its role as an environmentally friendly mass transportation option, particularly in reducing CO2 emissions from other transport modes on Java Island, Indonesia.
The increase in mobility and accessibility has driven the public's demand for public transportation. The development of agglomeration areas such as Jakarta, Bogor, Depok, Tangerang, and Bekasi (Jabodetabek) have further amplified the need for efficient transportation solutions. Rail transport has emerged as a prominent mode of public transit, supported by improvements in service quality and passenger comfort. According to data from the Central Statistics Agency, the number of train passengers in Java experienced significant growth between 2021 and 2022. In the Jabodetabek region, passenger numbers increased by 91,225,000 (71.98%), while the non-Jabodetabek regions saw an increase of 33,673,000 passengers (162%). Overall, this amounted to a total increase of 124,898,000 passengers (84.6%) across Java, as illustrated in Figure 1.
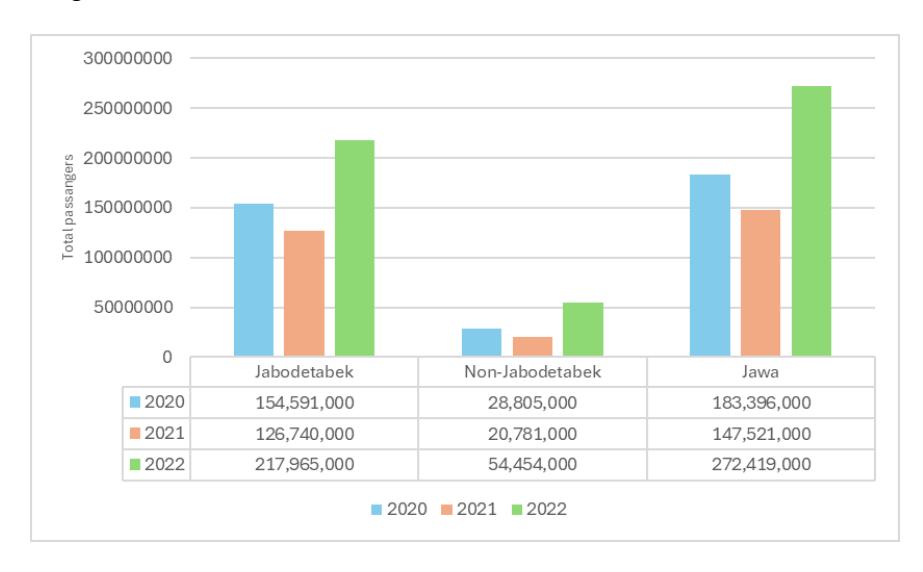
Growth in number of railway passengers across Java Island (Source: Statistics Indonesia)
Given the fuel conversion and the increased frequency of train operations, this study aims to calculate emissions and emission per capita from passenger rail transports. The results are expected to provide insights into the effectiveness of railways as a public transportation option and the impact of environmentally friendly fuel conversion on emission reduction (Zimakowska-Laskowska & Laskowski, 2022).
This study aims to analyze total CO2 emissions and per capita emissions from long-distance and local rail transport operating on the island of Java in 2023. The research focuses on passenger rail services, including long-distance trains, local trains, and commuter trains (excluding airport trains) operated by PT Kereta Api Indonesia (PT KAI) and PT Kereta Commuter Indonesia (PT KCI) on Java Island in 2023. This is achieved by comparing the calculated emissions with those from previous studies. Further, the results are analyzed using spatial analysis methods and subsequently applied to mitigation strategies aimed at reducing the climate change risks associated with the railway transportation sector.
Literature Review
One of the fundamental aspects of railway systems is their inherent energy efficiency. Previous study highlight that rail systems can serve as a climate-friendly alternative to road and air transport, particularly when considering passenger transport (Givoni et al., 2009). The efficiency of railways helps produce lower carbon emissions per passenger-kilometer compared to cars and planes, making them a vital asset in strategies aimed at reducing overall transport emissions (da Fonseca-Soares et al., 2024). Railways can significantly reduce carbon emissions compared to other modes of transportation and should be prioritized in transport policy to achieve long-term GHG reductions (Roy et al., 2023). Java Island, the most densely populated region in Indonesia, accommodates over half of the nation's population within a relatively limited area (Rizkia & Haryatiningsih, 2023). The combination of high population density, rapid urbanization, and economic expansion has significantly increased transportation demands, leading to greater environmental pressures, particularly regarding emissions. Research indicates that the development of efficient urban rail systems can help ease traffic congestion and reduce carbon emissions in highly populated urban centers. Transitioning from roadbased transportation to rail alternatives offers a promising approach to minimizing environmental impacts and advancing broader sustainability goals.
As Indonesia's most densely populated region, Java Island is home to more than half of the country's inhabitants, concentrated in a relatively small area (Dsikowitzky et al., 2019). This high population density, coupled with rapid urbanization and economic growth, intensifies transportation needs and contributes to environmental challenges, particularly in terms of emissions. Studies suggest that well-developed urban rail networks can alleviate traffic congestion and lower carbon output in densely populated cities (Yang & Jia, 2022). Shifting from road-dependent transportation to rail-based alternatives presents a viable strategy for reducing environmental impact, supporting broader efforts to meet sustainability targets. Significant changes have occurred in Indonesia's railway sector in recent years. These changes include an increase in the annual number of passengers, an increase in the frequency of passenger train operations, the expansion of electric train fleets, and the transition to alternative fuels. Such developments inevitably influence the volume of emissions produced by railway transportation.
Railways in Java are critical for reducing transportation emissions due to their efficiency relative to other transport modalities. Research indicates that rail transport emits considerably less CO2 per passenger or ton-kilometer than road or air transport, thus presenting a viable pathway for reducing overall emissions in the transportation sector (da Fonseca-Soares et al., 2024; Żak et al., 2014). This efficiency in emissions is attributed not only to the inherent designs of railway systems but also to the potential for electrification, which allows for a significant decrease in reliance on fossil fuels (Hu et al., 2022). In addition, shifting freight transportation from roads to railways carries significant economic benefits. Research shows that moving goods by rail not only reduces greenhouse gas emissions but also improves economic efficiency by lowering fuel consumption. Transporting cargo via railways results in a smaller environmental footprint compared to road-based freight systems, positioning rail as a more sustainable option (Ćetković et al., 2020) . These findings highlight the critical need for continued investment in railway infrastructure and technological advancements to maximize the environmental advantages offered by rail transport (Watson et al., 2018). Moreover, the economic implications of shifting freight from road to rail are substantial. Studies reveal that the modal shift to rail can lessen greenhouse gas emissions while enhancing economic performance through lower fuel consumption. For example, the transportation of goods by rail reduces the pollution footprint when compared to road transport, making it a sustainable choice (Ćetković et al., 2020). This evidence underscores the importance of investment in railway infrastructure and technology, which could further promote the environmental benefits associated with rail transport (Watson et al., 2018).
This research makes a distinct contribution from previous studies by calculating railway emissions in Java, Indonesia one of the most densely populated islands in the world—using the latest data from 2023, much more recent than the data used by Wibisono (2011). The Wibisono's study highlighted that CO2 emissions from diesel locomotives depend on several factors, including daily frequency or the number of round trips per day, engine type, travel distance, speed, and environmental interventions such as tree planting around train stations to reduce emissions through natural photosynthesis. Similarly, Esters & Marinov (2014) examined both direct and indirect emissions from railway rolling stock in the UK. The rolling stock was categorized into three types based on their fuel and operational models: diesel, electric, and biodiesel. Their findings revealed that electric-powered trains exhibit higher emissions compared to diesel trains, with high-speed trains requiring greater energy consumption. The study also highlighted biodiesel as a promising alternative fuel for rail transport. Furthermore, Riza et al. (2023) investigated energy requirements, emissions, and fuel consumption in high-speed rail systems. Their research indicated that the development of high-speed rail on the island of Java could significantly reduce carbon emissions, lowering CO2 emissions from the transportation sector by 848,000 tons annually.
The distinct contribution of this research is the use of Geographic Information Systems (GIS) to calculate, visualize, and assess train emissions across Java Island. Departing from traditional approaches that typically utilize aggregated data, this study applies spatial interpolation methods to create detailed, high-resolution emission distribution maps along railway networks. Drawing inspiration from the methodology of Çolak et al. (2024), this technique allows for a nuanced depiction of the carbon footprint resulting from fuel combustion in rail transport, while also revealing spatial variations in emission intensity. The novelty of this study lies in its application of Geographic Information Systems (GIS) to calculate, map, and analyze railway train emissions on Java Island. Unlike conventional methods that often rely on aggregate data, our approach employs spatial interpolation techniques to develop high-resolution emission distribution maps along railway corridors.
Methodology
Data Inventory
This study utilized secondary data obtained from PT Kereta Api Indonesia and PT Kereta Commuter Indonesia (Table 1). Due to the broad geographical scope of this research, direct field measurements are not possible and use secondary data (Chan et al., 2018). The use of secondary data combined with Geographic Information Systems (GIS) analysis to produce spatial distribution of emissions and per capita emissions in each operational area (OP) (Jansakoo et al., 2022). The use of secondary data allows for temporal analysis, whether daily, monthly, or annually. The published secondary data has been validated and is representative, thus supporting comprehensive analysis (Ellram & Tate, 2016). Secondary data allows for a comprehensive analysis of railway emissions. The use of secondary data is subject to inaccuracies, such as emission factors, specific train conditions, train load, speed, or route characteristics, which can significantly impact emissions calculations. Secondary data on energy consumption are inaccurate and based on estimates. This can potentially lead to errors in carbon emission calculations. This study did not calibrate measurements that influence carbon emission calculations.
The data includes operational regions, train names, train numbers, passenger counts, and travel distances. For data on trip frequency over one year and locomotive types, this study references the 2023 Train Travel Graph (GAPEKA 2023) and other sources such as news platforms for trains not listed in GAPEKA (e.g., additional or special trains). The Ministry of Transportation, through the Directorate General of Railways (Direktorat Jenderal Perkeretaapian), has implemented adjustments to train schedules in the 2023 Train Travel Graph (Grafik Perjalanan Kereta Api/ GAPEKA). GAPEKA 2023 serves as the basis for railway operations and was formalized under the Director General of Railways Decree Number KP-DJKA 67 of 2023 regarding the Train Travel Graph on the National Railway Network in Java for 2023. This graph replaces the 2021 GAPEKA and incorporates several updates, including the addition of double tracks, infrastructure speed enhancements, and changes to signalling systems. Based on GAPEKA 2023, there has been an increase of 48 passenger train trips compared to GAPEKA 2021.
The Government of Indonesia (GOI) has implemented several improvements to promote environmentally friendly transportation. For locomotive trains, there have been transitions from fossil fuels to more sustainable alternatives. Since 2023, locomotives have shifted from using conventional diesel fuel to B30 biodiesel. B30 biodiesel is a type of diesel fuel with a cetane number (CN) of 48 to 51, comprising 70% pure diesel fuel (B0) and 30% biodiesel derived from renewable sources (B100) (Hidayat et al., 2023). B30 biodiesel is a type of diesel fuel with a cetane number (CN) of 48 to 51, comprising 70% pure diesel fuel (B0) and 30% biodiesel derived from renewable sources (B100) (Hidayat et al., 2023). This transition has positively impacted on emissions, as B30 produces lower emissions compared to B0 diesel fuel. In addition to fuel conversion, electric trains, initially developed exclusively in the Jabodetabek region, have now been expanded to Yogyakarta.
Table 1 Data Inventory
| Data type | Unit | Source |
|---|---|---|
| Names and codes of train | - | |
| Number of passengers in the year 2023 | People | PT KAI and PT KCI |
| Mileage | Kilometer | |
| Travel frequency year 2023 | times | GAPEKA 2023 and news platforms |
Formulation
Long-distance trains and several local trains are currently powered by locomotives that utilize B-30 biodiesel as their fuel. Three types of locomotives remain actively in service for passenger trains on the island of Java: CC 201, CC 203, and CC 206. Additionally, certain local trains operate as diesel multiple units (DMUs). Each type of locomotive and train has varying fuel consumption requirements, as presented in Table 2.
Table 2 Spesific Fuel Consumption (SFC).
| Locomotive/ train type | SFC (Liters/kilometers) |
|---|---|
| Type CC 201 / CC 203 | 2.59 |
| Type 206 | 2.93 |
| KRD | 0.7 |
Source: PT Kereta Api Indonesia
To estimate the annual fuel consumption per train, calculations were performed by considering the type of locomotive, the annual trip frequency, and the distance travelled per trip. The calculation formula is presented in Eq. (1).
\[TC = D * F * SFC (1)\]
As presented in Equation (1), TC refers to total fuel consumption for each train in a year (in liters); D is the annual travel distance or mileage for each train in kilometers; F is the annual travel frequency for each train; and SFC is specific fuel consumption as listed in Table 2.
Carbon emissions were calculated using the formula provided by the IPCC (IPCC, 2006).Carbon emissions were calculated using the formula provided by the IPCC (IPCC, 2006). The fundamental method for emissions inventory involves estimating the emission load without directly measuring ambient air quality. Instead, it incorporates activity data and emission factors. In this study, the activity data used is the total fuel consumption.
The obtained fuel consumption data is expressed in liters. Therefore, as outlined previously, it needs to be converted into Terajoules (TJ) as follows in Eq. (2):
\[E = V * D * NCV (2)\]
Here in Eq. (2), E represents total energy consumed for each type of fuel (MJ); V is the volume of fuel consumption in m3 , D is the density of the fuel (kg/m3 ), and NCV is the net calorific value expressed in MJ/kg.
As previously mentioned, trains on the island of Java use B-30 biodiesel as the fuel for their locomotives. Therefore, the density used in the calculations refers to the minimum density standard (at a temperature of 15°C), which is 815 kg/m³. For the Net Calorific Value (NCV) of B-30, since no national standard has been established, a value of 44.025 MJ/kg is used (Apriyana et al., 2023).
Emission calculations use the approach method from Sebos's research (Sebos, 2022) and the IPCC approach (IPCC, 2006). The IPCC and the Indonesian government have not established an official method to calculate emission CO2 for B-30 biodiesel fuel. B30 is a fuel consisting of 30% Fatty Acid Methyl Ester/FAME and 70% diesel. There are 2 steps to calculate CO2 emissions from using biodiesel fuel. The first step calculates emissions of 70% of the diesel composition using the IPCC emission factor method. The emissions calculated in this study are expressed as carbon dioxide equivalent (CO2) for each train journey. The emission estimation follows the Tier 1 methodology outlined in the IPCC Guidelines for National Greenhouse Gas Inventories (Mobile Combustion - Railways), using the formula presented in Eq. (3):
\[Em = \Sigma(Ej * Efj) * \frac{1}{1000} \tag{3}\]
In Eq. (3), Em represents total CO2 emission in tons of CO2, while Ej is total energy consumed per fuel type in MJ, Ef is emission factor in kg CO2/MJ, and j is energy type (fuel or electricity).
The second step, calculates 30% FAME emissions CO2 (Fatty Acid Methyl Ester) using the Eq. 4 and total emissions CO2 using Eq. (5):
\[FOCO_2 = \left(v * CC \text{ of } FAME * 30\% * \frac{44}{12}\right) * \frac{1}{1000}\] (4)
Here in Eq. (4), FO CO2 refers to Fossil-Origin CO2 emission from FAME in tons of CO2, v is fuel consumed in kg, while CC of FAME is carbon content which is set at 0.764 kgC/kg FAME.
\[Total\ Emission = Em + FO\ CO_2 \tag{5}\]
Total emission in Eq. (5) is the sum of Em from Eq.(3) and FO CO2 from Eq. (4).
The calculation of total energy in electric trains differs from diesel train as shown in Eq. (6).
\[TE = H * SPC \tag{6}\]
TE represents total energy consumption as the total amount of electricity consumed by electric trains in a certain period in kilowatt hours (kWh). Calculating total electricity consumption requires data on the series of electric trains to determine H, which refers to total travel time on each series (in hours), and SPC (specific power consumption), which is the electrical power for each series (in kilowatt). Specific power consumptions for each train serial are shown in Table 3.
Table 3 Specific Power Consumption (SPC)
| Train Series | SPC (kilowatt) | |
|---|---|---|
| JR 205 SF 10* | 31,840 | |
| JR 205 SF 12 | 56,712 | |
| Tokyo Metro 6000 VVVF SF 10 | 12,720 | |
| Tokyo Metro 6000 SIV+MG SF 8 | 49,728 | |
| Tokyo Metro 8500 SF 8 | 16,960 | |
Source: PT Kereta Commuter Indonesia
Electric train emissions are calculated by assigning them to the emissions released during the electric generation at power plants. Therefore, the emission factor for grid electricity in Jawa, Madura, and Bali (JAMALI) is 0.87 tons of CO2/MWh (CM Ex-Post) (Kementrian Energi dan Sumberdaya Mineral, n.d.). The total emission is calculated by using Eq. (7):
\[CO2\ electric = TE * FE\] (7)
In Eq. (7), CO2 Electric denotes as emissions from electric trains in tons of CO2, which is count by multiplying TE as total energy consumption for each serial (in MWh) and FE as emission factor in JAMALI which set at 0.87 tons of CO2/ MWh.
One of the novelties this study offers is its focus on measuring CO2 emissions per capita. The unit of analysis employed is based on Operational Areas (OP) or Operational Regions (WOP). Emission data for each train number is aggregated within their respective OP/WOP and divided by the total number of passengers to calculate the average CO2 emissions per capita. The equation utilized for this calculation is presented in Eq. (8).
\[PCE = TE \div TP \tag{8}\]
Here in Equation (8), PCE refers to per capita emissions in tons of CO2 /capita /year as the ratio of TE or total emission (tons of CO2) and TP or number of passengers (capita or person).
Data Analysis
The calculation results of CO2 emissions are expressed in tons of CO2 meanwhile for the emission percapita are expressed in tons of CO2/capita/year. The data analyzed is based on operational areas for trains managed by PT Kereta Api Indonesia (KAI) and operational regions for trains managed by PT Kereta Commuter Indonesia (KCI). A spatial analysis was conducted to examine the spatial distribution of CO2 emissions from railway transportation.
Result
Railways are one of the most widely used modes of land transportation in Indonesia. This mode of transportation has a positive development in management and services (Yunani et al., 2024). Currently, railway transportation in Indonesia is only available on the islands of Java and Sumatra, while other major islands such as Kalimantan, Sulawesi, and Papua have yet to develop railway infrastructure. According to data from Statistics Indonesia (BPS), the number of railway passengers in Java showed an increasing trend during the 2014–2019 period. However, in 2020–2021, there was a significant decline in passenger numbers due to the Covid-19 pandemic, followed by a recovery trend through to 2023 (Figure 2). Government-imposed mobility restrictions, combined with public concern over the risk of COVID-19
* As no data for SPC of JR 205 SF 8, this research used the same SPC as JR 205 SF 10
transmission, led to a sharp decline in rail ridership around the world. Passenger demand in European rail systems dropped significantly during the first wave of the pandemic, with reductions ranging from 70% to 90% (Gkiotsalitis & and Cats, 2021).
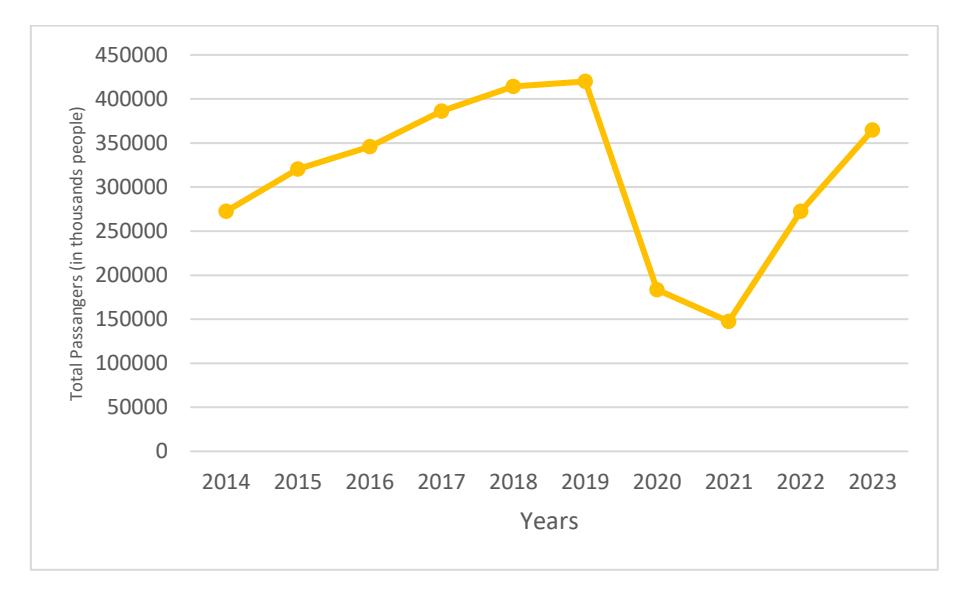
Total Trains Passengers in Java (source: Statistics Indonesia)
The calculation of CO2 emissions from passenger train operations in Java during 2023 revealed variations across operational areas (OP) for long distance railways managed by PT KAI and operational regions for local railways and commuter line managed by PT KCI. PT KAI handles 9 operational areas including OP I (Jakarta), OP II (Bandung), OP III (Cirebon), OP IV (Semarang), OP V (Purwokerto), OP VI (Yogyakarta), OP VII (Madiun), OP VIII (Surabaya), and OP IX (Jember). These variations are primarily attributed to differences in travel frequency and distance, as presented in Table 4 and Table 5. For passenger trains operated by PT KAI, OP VI recorded the highest number of total trips, while OP VIII led in total travel distance, fuel consumption, and passenger volume. OP VI achieved the highest number of trips, with 14,559 trips in a single year, largely due to its coverage of Yogyakarta, a popular tourist destination with a high demand for train services.
Meanwhile, OP VIII recorded the longest total travel distance, reaching 8,211,584.60 km annually. This is due to its location in the easternmost part of Java, resulting in longer travel distances for trains compared to other OPs, particularly for routes to western Java destinations such as Jakarta or West Java. Most of the trips are made for business purposes as Jakarta and Surabaya have role as economic center hubs (Lubis et al., 2019). Consequently, OP VIII also had the highest fuel consumption, using 23,103,362 liters of B30 biodiesel for passenger train operations in 2023. Additionally, OP VIII accommodated the highest passenger volume with 7,931,589 passengers.
In contrast, OP IX, operating in the Jember area, reported the lowest figures for total trips, total travel distance, and total fuel consumption. Meanwhile OP III, operating in Cirebon area, had lowest total passengers with only 1,530,626 passengers in 2023. This is because most stations within these OPs serve as transit points rather than major terminals, with primary stations located in Bandung (OP II) and Surabaya (OP VIII). The lower passenger numbers in these regions also reflect a reduced demand for train services.
| Operation Area | Total Frequency | Total Mileage (km) | Total Fuel Consumption (liters) | Total Passengers | |
|---|---|---|---|---|---|
| OP I | 4,242 | 2,885,070.52 | 8,305,637 | 2,788,482 | |
| OP II | 11,998 | 5,241,679.76 | 15,000,493 | 5,079,339 | |
| OP III | 3,063 | 1,175,804.41 | 3,445,107 | 1,530,626 | |
| OP IV | 9,232 | 3,074,053.68 | 8,488,707 | 3,234,517 | |
| OP V | 11,589 | 4,796,741.59 | 13,091,954 | 5,711,954 | |
| OP VI | 14,559 | 7,542,281.73 | 20,786,771 | 7,639,469 | |
| OP VII | 3,012 | 2,336,389.65 | 6,051,249 | 1,938,888 | |
| OP VIII | 12,698 | 8,211,584.60 | 23,103,362 | 7,931,589 | |
| OP IX | 2,190 | 1,108,104.96 | 2,870,012 | 1,716,925 | |
Total 72,583 36,371,710.90 101,143,291 37,571,789
Table 4 Summary of Long-Distance Train Operation in Java Island in 2023
Local trains operated in Java Island are categorized into two types based on management, local non commuter managed by PT KAI and local commuter managed by PT KAI handles 9 operational areas, KCI has 5 operational areas encompass the Greater Jakarta area (Jabodetabek), Cikarang, Banten, Region 1 (Rangkasbitung-Merak), Region 2 (Bandung), Region 6 (Yogyakarta), and Region 8 (Surabaya). Each operational region operates local commuter trains providing intra-provincial or intra-agglomeration travel services.
For local non commuter trains, OP I records the highest figures in terms of the number of trips, travel distance, total fuel consumption, and passenger count than any other operational area as shown in Table 5. The local non commuter trains serving this area include the Pangrango train, which operates on the Bogor–Sukabumi route (round trip), and the Siliwangi train, which serves the Sukabumi–Cipatat route (round trip). Both trains are local services operating within the West Java region. In contrast, OP VIII reports the lowest figures for the number of trips, total travel distance, and passenger count. OP VIII operates only one type of train service, the Arjuno Ekspres.
| Operation Area | Name of Train(s) | Total Frequency | Total Mileage (km) | Total Fuel Consumption (liters) | Total Passengers |
|---|---|---|---|---|---|
| OP I | Pangrango/ Siliwangi | 4,380 | 271,938.87 | 796,780.89 | 2,198,263 |
| OP IV | Blora Jaya/ Kedung Sepur/ KA Wisata Ambarawa | 2,190 | 190,530 | 266,588.7 | 483,039 |
| OP VI | Bandara BIAS/ Batara Kresna | 4,380 | 156,623 | 458,905.39 | 209,825 |
| OP VIII | Arjuno Ekspres Banyubiru/ KA | 1,309 | 121,471.27 | 355,910.83 | 144,342 |
| OP IX | Tambahan JR KTG/ Pandanwangi | 2,318 | 256,118.60 | 663,423.41 | 1,325,238 |
| Total | - | 14,577 | 996,681.74 | 2,541,609.22 | 4,360,707 |
Table 5 Summary of Local Non-Commuter Train Operations in Java Island in 2023.
The final category of trains is local commuter line. Commuter trains provide transportation services between city centers and surrounding suburban areas. Currently, all commuter train services in Indonesia are managed by PT KCI. Each OP operates local commuter trains providing intra-provincial or intra-agglomeration travel services. Commuter trains are categorized into two types based on fuel: diesel-powered commuter lines and electric-powered commuter lines.
For diesel-powered commuter trains, Region 8 (Surabaya) operates the highest variety of local commuter lines, with 8 distinct train services. Meanwhile Region 2 Bandung manages 4 train services. In contrast, Region 1 (Rangkasbitung-Merak) operates only a single service, the Merak commuter line and Region 6 operates two train services which are Commuter Line Prameks and Commuter Line Yogyakarta. Region Jabodetabek operated 5 (five) train services and had able to surpasse all other regions in terms of total trips, total distances, and passenger volume.
Electric-powered local commuter trains operate exclusively in the Jabodetabek-Cikarang-Banten area and Region 6 (Yogyakarta and surrounding areas). Reflecting the demand for transportation in densely populated areas, the Jabodetabek-Cikarang-Banten commuter rail system (KRL) significantly outpaces other regions in operational metrics. The Jabodetabek-Cikarang-Banten KRL system recorded 406,707 trips in 2023, with 1,143 trips in weekday and 1,051 trips in weekend (Saturday and Sunday) and holiday. This high frequency results in a substantial total travel distance of 15,791,808.47 km in a year. Electric trains in Jabodetabek area accommodate 973,366 residents in daily commuting (Wijayanto et al., 2022). Moreover, the high ridership and extensive operations are driven by chronic traffic congestion and the prevalence of private vehicles in the Jabodetabek area, encouraging a shift toward public transportation as a practical alternative (Wijayanto et al., 2022).
Similarly, Region 6 (Yogyakarta, including cities like Solo and Klaten) is witnessing gradual development in public transportation infrastructure. Some facilities have been developed along the train route to support the growth of railway transportation in this area, not only transit station but also connecting system to other public transportation (Irawan et al., 2017; Putri et al., 2023). However, while the demand for high-frequency commuter rail services is growing in this region, the availability of such services remains limited with only one kind of train available (CL Yogyakarta), aligning with current demand and regional development trends. These patterns highlight the critical role of commuter trains in addressing urban mobility challenges in high-density areas like Jabodetabek, while also pointing to emerging
opportunities for growth in regions like Yogyakarta as urbanization progresses. This distribution highlights regional differences in train operations and service demands, with specific regions focusing on high-frequency services tailored to local commuting patterns as shown in Table 6.
| Operational Region | Name of Train (s) | Total Frequency | Total Mileage (km) | Total Passenger |
|---|---|---|---|---|
| Region Jabodetabek | CL Bogor/ CL Cikarang/ CL Rangkasbitung/ CL Tangerang/ CL Tanjungpriuk | 406,707 | 15,791,808.47 | 290,086,218 |
| Region 1 Rangkasbitung Merak | CL Merak | 5,110 | 344,444.66 | 3,610,544 |
| Region 2 Bandung | CL Walahar/ CL Jatiluhur/ CL Bandung Raya/ CL Garut/ | 21,900 | 1,120,422.25 | 14,691,529 |
| Region 6 Yogyakarta | CL Prameks/ CL Yogyakarta | 15,330 | 995,521.44 | 7,320,149 |
| CL Arjonegoro/ CL Blorasura/ | ||||
| Region 8 Surabaya | CL Dhoho/ CL Jenggala/ CL Penataran/ CL Sindro/ CL Supas/ CL Tumapel | 35,770 | 2,743,937.51 | 13,332,811 |
Table 6 Summary of Local Commuter Train Operations in Java Island in 2023.
Based on CO2 emission calculations (Figure 3), Operational Area (OP) VIII produces the highest CO2 emissions compared to other OPs, reaching 42,700.67 tons of CO2. Meanwhile, the lowest emissions were recorded in OP III and OP IX, with 6,367.4 tons of CO2 and 5,403.48 tons of CO2, respectively. This pattern aligns with the total fuel consumption required for train operations in each OP, higher fuel consumption corresponds to greater CO2 emissions.
However, high total CO2 emissions do not always correlate with high CO2 emissions per capita. For instance, the highest per capita CO2 emissions were found in OP I and OP VIII, amounting to 0.006 ton of CO2/capita/years (Figure 3), whereas the emissions in OP I and OP VII were only 15,350.85 tons of CO2 and 11,184.19 tons of CO2 in 2023. These findings emphasize the importance of maximizing train occupancy to reduce per capita emissions and highlight the variability in operational efficiency across different regions.
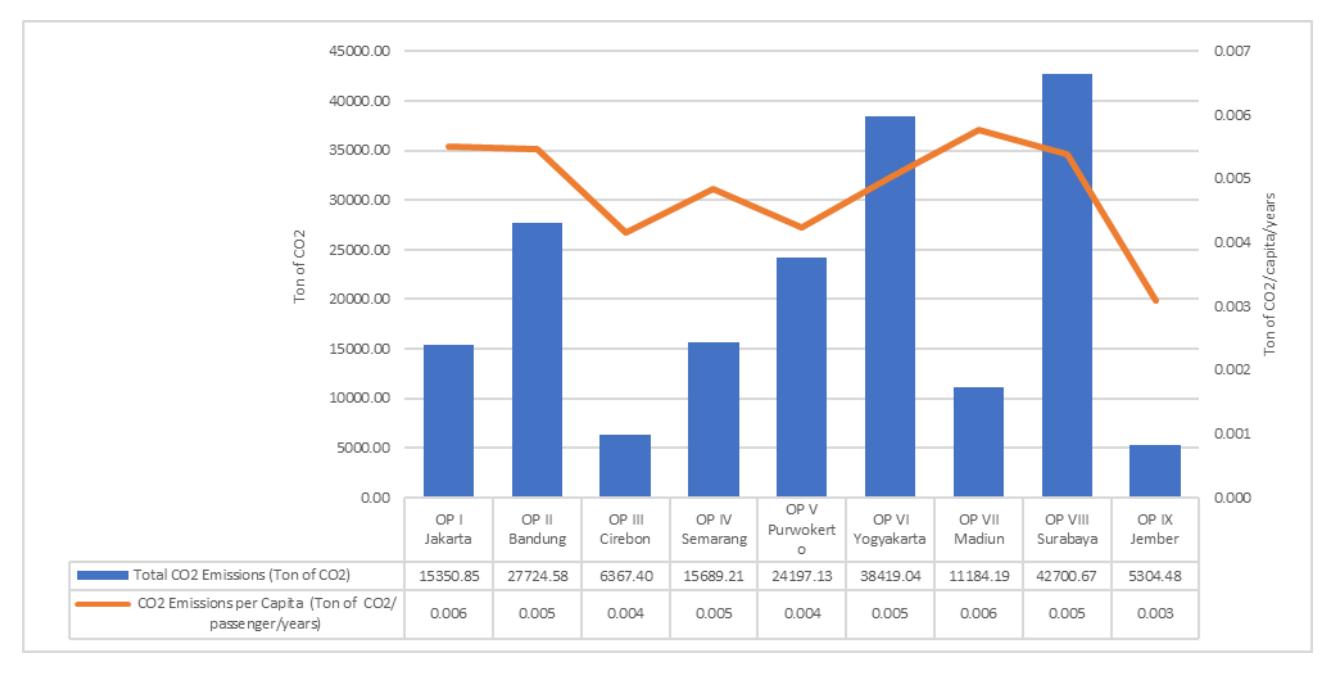
Graphic of Emissions and Emissions Per Capita Long-Distance Railways on Java Island in 2023
Railways are claimed to be the most environmentally friendly means of transportation because they have low per capita emissions (Ahsan et al., 2023). Jakarta is the largest megalopolis in Java Island. Large urban areas on the Java Island located in OP I Jakarta and OP III Cirebon have low long-distance trains emissions CO2 (<20,000 tons of CO2). Several areas outside the city centers have high CO2 emission levels (Figure 4). The distribution CO2 emissions show that OP VIII Surabaya and OP VI Yogyakarta have high emission levels (> 30,000 tons of CO2).
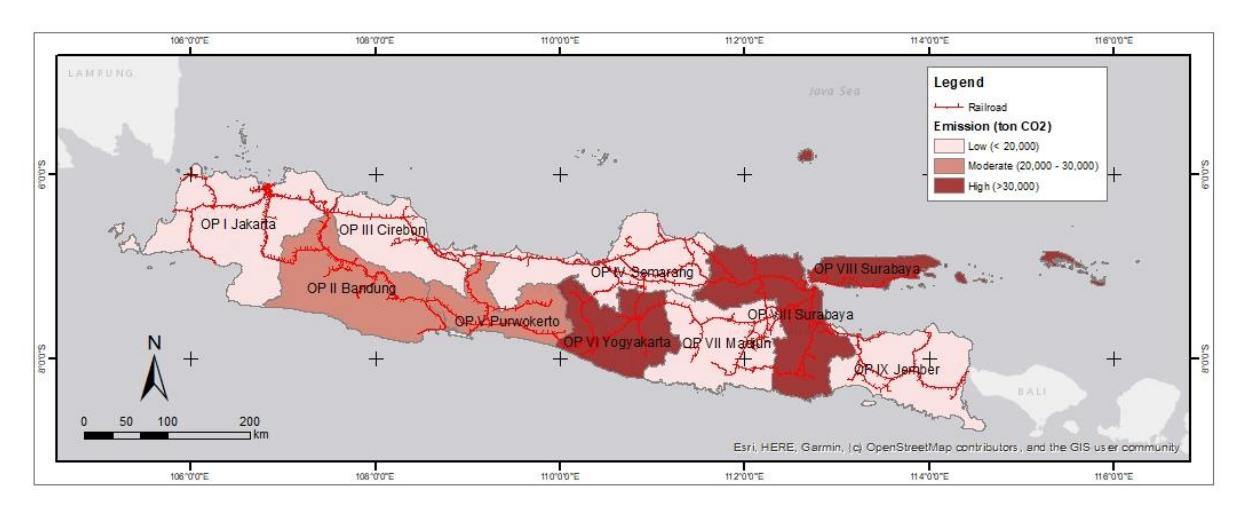
Map of Long-Distance Railways CO2Emissions Distribution on Java Island in 2023.
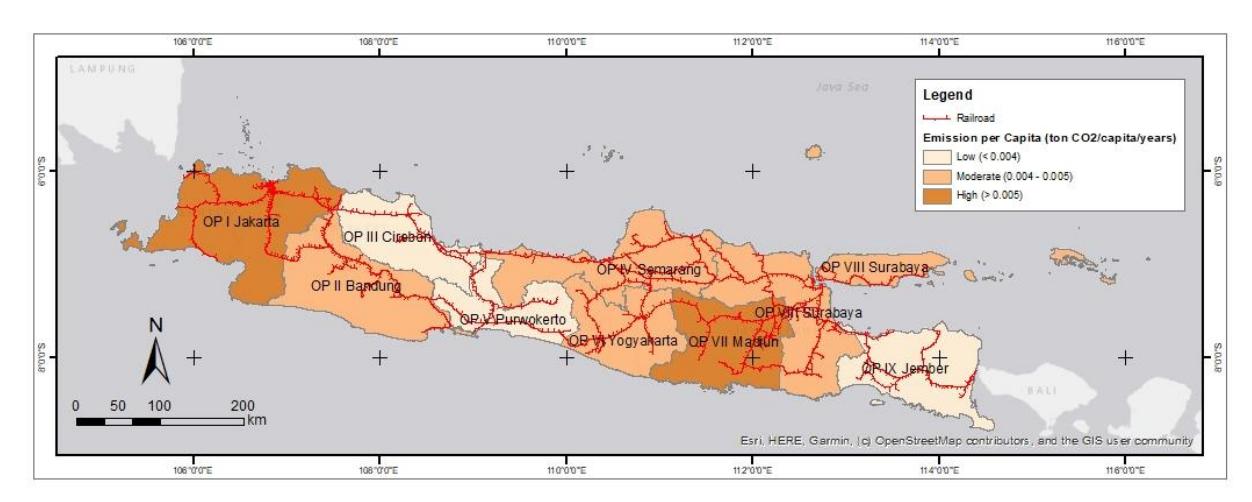
Map of Long-Distance Railways CO2 Emissions per Capita Distribution on Java Island in 2023.
As previously explained, in addition to long-distance railways, there are also local trains that serve passengers traveling between cities over shorter distances. The emissions produced by local trains fall within a smaller range compared to long-distance railways. This is primarily due to the lower number of trips and trains involved. Furthermore, the average CO2 emissions per capita are also lower compared to long-distance railways, ranging between 0.0007 and 0.0046 tons of CO2/passenger/years. The results of the CO2 emissions calculations for local trains are presented in Figure 6.
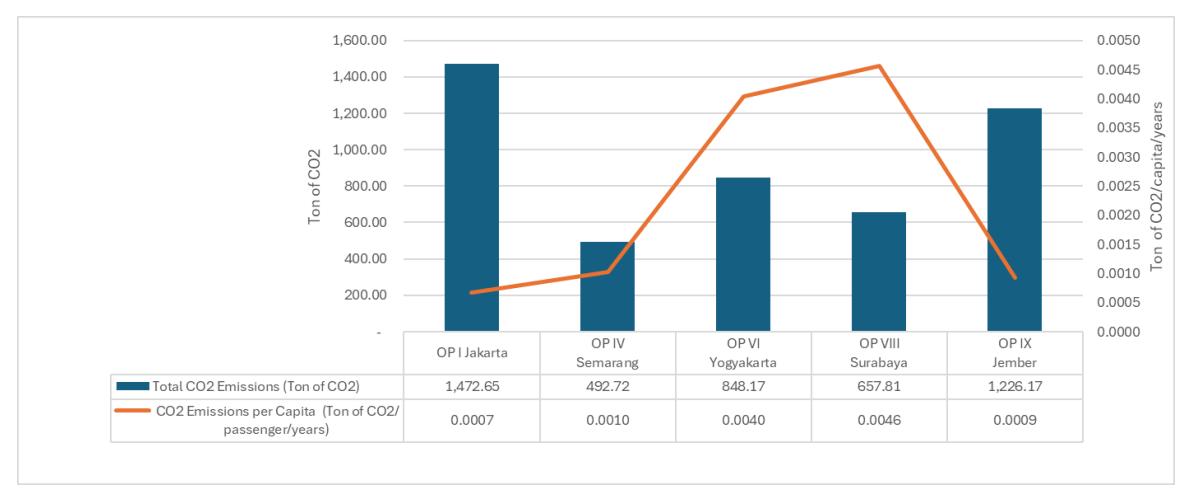
Graphic of Emissions and Emissions Per Capita Local Non-Commuter Trains on Java Island in 2023.
There are 2 types of local commuter trains in Java Island, diesel based (CL Merak, CL Bandung, CL Prameks, and CL Surabaya) and electric based (CL Jabodetabek and CL Yogyakarta). Total CO2 emissions differ significantly between railway lines. Commuter Line Jabodetabek is the largest emitter (Figure 7), followed by the Commuter Line Yogyakarta. On the other hand, CL Merak and CL Prameks have relatively small total emissions. The OP 2 Bandung railway line has the lowest per capita emissions compared to other commuter trains. This indicates that the number of passengers carried on the OP 2 routes became the most effective trip compared to other routes.
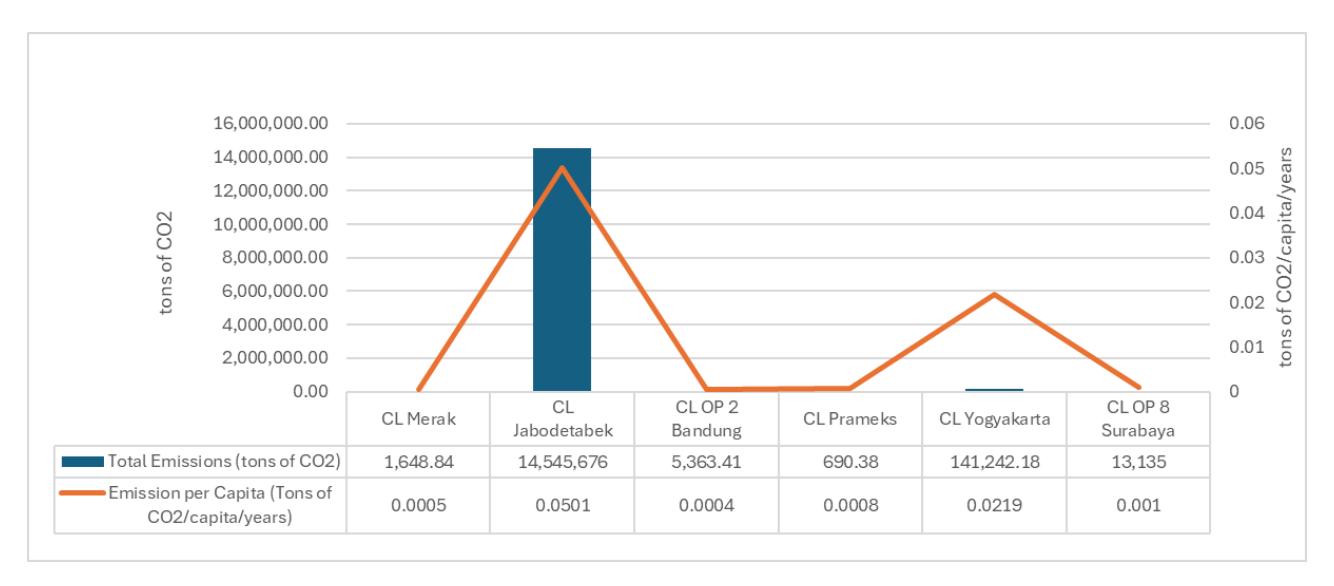
Graphic of Emissions and Emissions Per Capita Local Commuter Trains on Java Island in 2023.
Discussion
The emissions calculated in this study are significantly higher than those estimated in the model developed by Wibisono. Compared with previous research (Wibisono, 2011), there is an increase in the calculated results from 50,458 tons of CO2 to 14,899,390.88 tons of CO2. This discrepancy is attributed to the increased number of trains and higher travel frequencies, which reflect the ongoing development of the railway sector in Indonesia. Wibisono's study used an emission factor of 2.7 kg CO2/liter of diesel, while this study uses an emission factor of 73,280 kg CO2/TJ, where 1 liter of diesel produces approximately 38 megajoules (MJ) of energy, or 0.000038 terajoules (TJ). Wibisono's study excluded emissions from electric commuter trains, as such modes of transportation were not yet operational in Java as of 2011.
The calculation results of total CO2 emissions from trains in Java in 2023 are only 10% of the total CO2 emissions from the transportation sector in Indonesia in 2022. In 2022, total CO2 emissions from the transportation sector in Indonesia reached 142.21 million tons of CO2 /year (Data Explorer | Climate Watch, n.d.). The only trains in Java that use fossil fuels are long-distance trains, local trains, and some commuter trains. Total emissions from trains using fossil fuel (B30 diesel) in Java amounted to 217,472.70 tons of CO2 in 2023. Global CO2 emissions from trains using fossil fuels (diesel) were 94.64 million tons of CO2 in 2022 (Figure 8). In comparison, emissions from trains using fossil fuels in Java account for only about 0.2% of total global CO2 emissions.
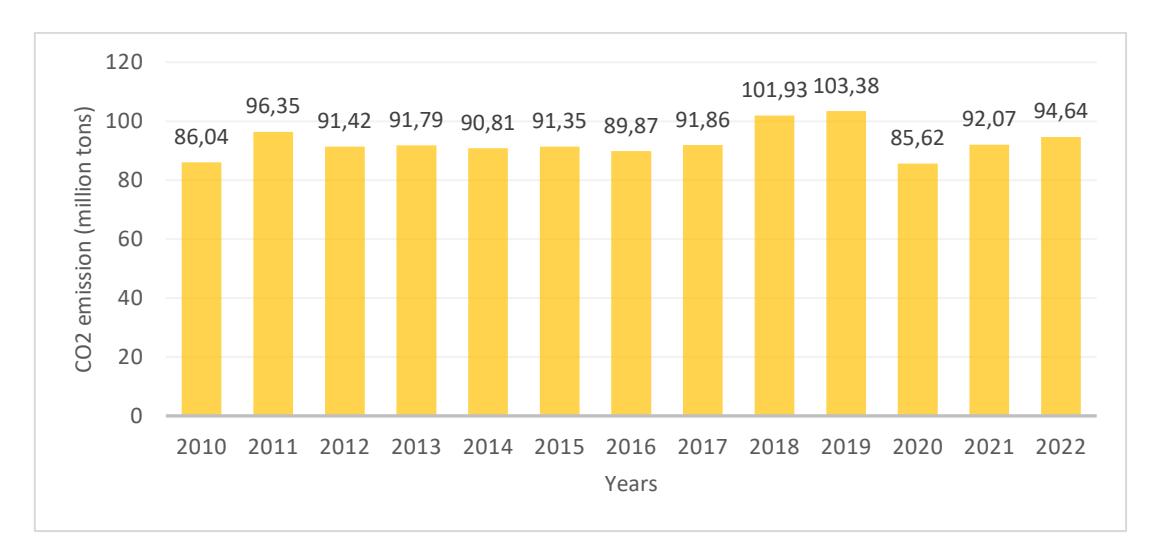
CO2 emissions from fossil fuel trains in the Net Zero Scenario, 2010-2030 in the world (IEA, 2023)
Long-distance railway CO₂ emissions in OP VI Yogyakarta and OP VIII Surabaya were higher than in other regions. However, their per capita emissions are classified as moderate. In contrast, OP I Jakarta and OP VII Madiun recorded the highest per capita emissions on Java Island. This variation is influenced by train frequency, total mileage, and passenger volume. In OP VI Yogyakarta and OP VIII Surabaya, the total mileage reached 7–8 million kilometers, resulting in maximum fuel consumption (Table 4). These regions also served more passengers than other areas, which explains their per capita emissions remain in the moderate category despite the high mileage. Several factors contribute to differences in frequency and passenger distribution, with urbanization being one of the most significant. Regions such as OP I Jakarta, OP II Bandung, and OP III Cirebon are megacities, which reduces the demand for long-distance rail travel since most residents already live in urban centers. By contrast, many people from Central and East Java migrate to these cities for work and return to their hometowns during holiday periods and Eid. This seasonal movement drives higher train frequencies in the eastern regions (especially Yogyakarta and Surabaya) compared to West Java due to the increased number of ticket requests. The number of train passengers is not large, causing the per capita emission level in urban areas to be high while the per capita emission level outside urban areas is low (Figure 5). This indicates that energy consumption patterns and demand for route tickets to operational areas which are dominated by rural areas are much higher.
Some previous studies accounted that electrification in railway transport is potential in reducing carbon emissions. Railway electrification can reduce carbon emission 8.9% up to 65.4% (Ahsan et al., 2023; Dincer & Zamfirescu, 2016; Xu et al., 2021). The total emissions generated by local commuter trains in Java reached 99% of the total train emissions on Java Island in 2023. This is because commuter trains operate at higher operating hours and frequencies than longdistance and local trains. Large cities like Jakarta and Yogyakarta contribute the most emissions to commuter trains. This is due to the high number of commuter workers from the outskirts of Jakarta and Yogyakarta who work in these cities.
The calculations show that per capita emissions produced by electric trains specifically in Jabodetabek and Yogyakarta are higher compared to those generated by diesel-powered trains. This difference in per capita emissions can be influenced by several factors, including line length, type of locomotive used, travel frequency, and the number of drivers. The characteristics of passengers on each line can also affect the level of per capita emissions. Additionally, the higher emission is partly due to higher energy load required for providing passenger amenities aimed at improving comfort, such as air conditioning and lighting, as well as the installation of higher motor power to reduce travel time. Electric trains don't produce direct emissions at sites like diesel trains because they use electricity from the grid. This makes CO2 emissions dependent on the power generation source. Therefore, electrification on railway transportations can reduce emissions more efficiently if some energy managements are implemented such as on- board energy storage, the ability to return power to the national grid, and regenerative braking (McFadden, 2010). Diesel trains directly emit greenhouse gases and pollutants from the combustion of diesel fuel in their engines. Electric trains are more environmentally friendly because emissions from power plants can be managed to be cleaner, while diesel trains produce pollution from the direct use of fossil fuels.
Emission factors also contribute to the results observed. Most power plants in Indonesia still rely on coal as their primary energy source (Kusuma et al., 2023; Maskun et al., 2022; Putra et al., 2021). This condition leads to higher upstream emissions. Therefore, decarbonizing energy sources is also a crucial step in the transition from diesel locomotives to electric trains. When emission reduction policies are applied solely to energy consumers—such as the transportation sector—while energy producers continue to rely on environmentally harmful fuels, emission reduction targets will not be achieved. A comprehensive, end-to-end program—from upstream to downstream—is essential to ensure the realization of Net Zero Emissions.
Furthermore, this study compares emissions generated by various categories of train services—namely long-distance, local, and commuter trains. Emissions are calculated in detail for each type of locomotive, including both diesel and electric variants, to produce more accurate and comprehensive results. These findings highlight the importance of conducting regular emission assessments in the railway sector to support emission reduction policies and to facilitate the advancement of railway technologies in Indonesia. Further research, such as the development of emission projection models, is also necessary particularly in the context of achieving the national target of net zero emissions by 2060. Given that the largest share of emissions in the transportation sector is associated with car usage (Erahman et al., 2019), enhancing railway services could contribute significantly to mitigating this issue.
Emission regulations in Indonesia's transportation sector have thus far been predominantly directed toward road vehicles, through the implementation of Euro-based emission standards, electric road vehicle, vehicle emission testing policies (Damanik et al., 2024; Fajar et al., 2024; Nugroho et al., 2012). In contrast, railway-specific emission regulations remain highly limited. Diesel locomotives and other combustion engine-based trains are not yet subject to nationally established emission standards. Moreover, Indonesia does not currently have a nationally recognized emission factor specifically for the railway sector, meaning that emission estimations often rely on international data or generalized approaches. This regulatory gap poses a challenge for transportation sector decarbonization, particularly given that the majority of Indonesia's railway fleet still depends on fossil fuels.
Achieving net zero emissions cannot be accomplished through a single pathway but rather requires a comprehensive approach. In this regard, mitigating the climate impact of the railway sector is not only attainable through a transition toward environmentally friendly, low-emission energy sources, but also through the establishment of robust policy and regulatory frameworks that can accelerate and sustain such a transition. Indonesia has formalized this direction through the National Energy Plan (Presidential Regulation No. 22/2017), which promotes energy diversification in transportation by 2050, including a shift from petroleum-based fuels toward bioenergy, natural gas, and electricity. More specifically, mitigation actions for the railway sector have been set out in Minister of Transportation Decree No. 8/2023, which outlines initiatives such as the development of rail-based mass transportation, utilization of solar power, and adoption of alternative fuels. These actions have also been incorporated into PT Kereta Api Indonesia's Environmental Social Governance (ESG) roadmap. The roadmap sets a long-term target that by 2060, up to 93% of locomotives and trains will utilize renewable energy sources. Of this 93%, approximately 75% is expected to be supplied by electricity and batterybased technologies, while the remaining 25% will rely on hybrid systems, biodiesel, and hydrogen. This constitutes an ambitious target which, if elevated into national regulation to achieve strong policy support, could serve as a catalyst for broader stakeholder engagement in achieving emission targets and decarbonization goals. Substantial investment is also needed to ensure its feasibility and effective implementation.
Conclusions
The measurement results show that there are many factors that influence train emissions in Java, including distance travel, frequency, type of locomotive, type of fuel, and emission factors. Operational areas with high amounts of CO2 emissions do not always have high per capita emissions. This is because the number of emissions per capita is greatly influenced by the number of passengers. Local trains (electricity trains) have higher emissions than diesel trains. This study could suggest that electric trains have contributed to emissions more than diesel trains if their frequency is higher than diesel trains.
This research has many limitations, especially related to the determination of emission factors for biodiesel fuel and national electricity which are not available. Emission factors are a critical component in accurately estimating greenhouse gas (GHG) emissions at the national level. The absence of standardized national emission factors for B30 biodiesel blends may compromise the precision of GHG inventories and introduce significant uncertainties. International and national studies and standards regarding B30 emissions are still very difficult to find. This study adapts the method from Sebos (2022), which calculates emissions from biofuel (B100). Sebos's other studies have shown that emissions from two sources can be separated: diesel and fatty acid methyl ester (FAME). This limitation could, in turn, affect the reliability of the emission estimates presented in this study. In future research, it is hoped that train emission calculations can be carried out with more reliable factor emissions. This study did not calibrate measurements that influence carbon emissions. The results relied entirely on secondary data to calculate and estimate emissions. The Indonesian government, specifically PT KAI and KCI, do not have emissions data from individual locomotives. Future research is expected to calibrate CO2 emissions based on surveys using tools to measure emissions directly or using secondary data with guaranteed accuracy from governments or organizations.
Acknowledgement
The author wishes to extend sincere gratitude to Universitas Gadjah Mada (UGM) for the generous financial support provided through the 2024 Academic Excellence Improvement Program with number 6529/UN1.P1/PT.01.03/2024. This support has been instrumental in the successful execution of this research. Furthermore, the author would like to express his deep appreciation to PT Kereta Api Indonesia (PT KAI) and PT Kereta Commuter Indonesia (PT KCI) for their invaluable assistance in providing the essential data that greatly contributed to the advancement of this study. The data supplied by these organizations has played a crucial role in the achievement of this research's objectives. The completion of this research would not have been possible without the support and contributions from all parties involved.
Compliance with ethics guidelines
The authors declare they have no conflict of interest or financial conflicts to disclose.
This article contains no studies with human or animal subjects performed by the authors.