
Introduction
The reliable and economical electrical power system is needed for modern society around the world. The most important element of the electrical power system is the distribution system grid as it is the link for managing and connecting the generation system with the consumer(Farrag et al., 2021).The electrical distribution grid is. a vital element in the electrical power system as it manages and delivers the generated electricity to customers The design and planning of distribution system is a difficult task as it contributes to achieving the higher system reliability with reducing overall cost of the system(Selatan & Asikin, n.d.).
The distribution of electric power plays a very important role in the economic growth of a country. Therefore, it is desirable of all consumers to have an efficient and reliable power supply(Soleh, 2017) . Blackouts will affect the continuity and quality of the distribution of electric power to customers. Regarding the quality of the services, the continuity of the power supply and the quality of the supplied voltage are most essential and influential factors. The voltage of the system should be always within the defined limits in order to protect the equipment from overheating and damage(Wattimena, 2022). The voltage profile improvement and power loss minimization has been a topic for the researchers for the last decades. The voltage can be improved by using On Load Tap Changer (OLTC) transformers, adding capacitive or inductive loads, power flow control and automatic voltage regulator(Žarković et al., 2019)(Sadiq & Antar, 2024). Another factor that has a great impact of the voltage system and power losses rate is the location of the distribution transformer. Several factors need to be taken into consideration when selecting the transformer location. The decision on the location of transformer id a complicated task and should undergo the detailed study, initial design and final design. It is essential to consider all factors affecting the selection of best location for distribution transformer. The main factors that contribute the choice of best location for transformers are(Yan et al., 2019)(Melikuziev, 2023)(Rasheed et al., 2022):
- 1. Near the load centre.
- 2. Occupying minimum land
- 3. Easily accessible
Copyright by authors ©2026 Published by IRCS - ITB J. Eng. Technol. Sci. Vol. 58, No. 2, 2026, 287-297 ISSN: 2337-5779 DOI: 10.5614/j.eng.technol.sci.2026.58.2.10
4. Protecting the environment
However, for the case study of Duhok city, the distribution transformers are installed without conducting a feasibility study and the some of them are installed in inappropriate location. This has an impact on the voltage drop as well as the power losses of the system. This study, has selected four number of transformers which are expected to be installed far from the load centre. By relocating these transformers and installing them close to load centres, the voltage drops and power losses are evaluated.
This study investigates the impact of transformer relocation on voltage profile and power losses in Duhok city's distribution network. Four distribution transformers identified as being installed far from their respective load centers were selected for evaluation. The main contribution of this work is to demonstrate, through simulation and analysis, that relocating these transformers closer to load centers significantly improves voltage regulation and reduces technical losses. The findings highlight the importance of proper transformer placement and provide a practical approach for optimizing transformer location in urban distribution networks.
Literature Review
The efficiency and reliability of electrical distribution systems have been a key research focus for decades, as they directly impact the performance of the overall power system and the quality of electricity supplied to end users. Several studies highlight that the distribution grid forms the most critical part of the power system infrastructure, acting as the final link between generation and consumption (Alam & Arefifar, 2019). The complexity of designing and planning distribution systems lies in balancing system reliability with cost-effectiveness (Vahidinasab et al., 2020).
Reliable power supply is essential for national development, and uninterrupted electricity access significantly supports industrial growth, public services, and living standards. Numerous researchers have examined the causes of blackouts and the importance of maintaining voltage levels within permissible limits to avoid equipment damage and system instability (Nonthapot et al., 2025).
Voltage regulation and power loss reduction have been addressed through various strategies, including the use of On Load Tap Changer (OLTC) transformers, reactive power compensation, and advanced control systems like automatic voltage regulators and FACTS devices (Karuppiah et al., 2020; Xu & Taylor, 2008). These methods aim to maintain a stable voltage profile across all parts of the distribution network.
However, one of the less complex but highly impactful factors influencing system performance is the physical location of distribution transformers. Proper placement of transformers can significantly reduce technical losses and voltage drops in the network. Several studies emphasize that installing transformers close to load centers minimizes power losses and improves voltage quality (Hegde et al., 2014; Pinzón et al., 2020) Optimal transformer location is influenced by several criteria, such as proximity to load demand, accessibility, minimal land use, and environmental safety(Sebestyén, 2021)(Chamandoust et al., 2020).
Despite the existing body of work, some distribution networks—particularly in developing regions—lack the application of these planning principles. For instance, in Duhok city, improper transformer placement without feasibility studies has led to inefficiencies in voltage delivery and increased technical losses. Similar issues have been reported in other studies focusing on unplanned expansion and weak infrastructure in distribution systems, where transformer relocation has proven effective in performance improvement.
Therefore, this research contributes to the literature by evaluating the impact of transformer relocation in a real-world setting. It builds on previous studies by focusing on measurable improvements in voltage profile and power loss reduction when transformers are installed closer to load centers.
Status of Low Voltage System of Duhok City
The low voltage (LV) distribution networks consist of the LV distribution lines and consumer service connections. (Distribution transformers are taken as a part of medium voltage (33 kV and 11 kV) distribution system in this analysis. About 285,000 consumers are connected to LV networks and 66% of the total system demand is finally dispatched through the LV distribution system.
Out of the 10,340 distribution transformers installed in Duhok Governorate, 6,950 belong to the 'general' consumer category whereas balance are 'private' transformers serving bulk supply consumers.
The 'retail' consumers are connected to these general category transformers via low voltage distribution lines. The total demand handled through these transformers during 2016 winter is estimated to be 1037 MW. The estimated number of LV feeders connected to these transformers are 14,000. The estimated total length of LV lines is 5,600 km(E. Distribution & Plan, 2022).
Based on the observations made during the field surveys and analysis carried out on a sample of distribution schemes in Kurdistan, the following issues have been identified. Mostly these issues relate to old networks which needed rehabilitation.
- 1. Presence of significant number of aged distribution transformers in the network which contribute to high failure rates. These include transformers with significant oil leaks, corroded tanks, impending bushing failures and deteriorated insulation oil conditions.
- 2. Issues in distribution transformer installations; these include absence or improper earthing, damaged LV circuit breakers, bypassing of circuit breakers (due to tripping), aged or non-operational lighting arrestors, improper earthing and safety issues relating to transformer installations.
- 3. High degree of phase unbalance in LV feeders which is common to most of the LV networks.
- 4. Overloading problems in LV distribution feeders and voltage drops caused by combination of upstream voltage drop in MV feeders and voltage drops in LV lines.
- 5. Deteriorated conditions and safety (clearance) issues in some of the LV distribution feeders in the city as well as in rural areas. Presence of third-party networks in LV lines (ex. private generator wires) in also cause certain safety risks.
- 6. Issues in consumer supply connections such as non-standard installations, inaccurate or old energy meters and unauthorized connections or tampering / bypassing of energy meters.
Methodology
The design of low voltage distribution network usually requires several points to be taken into consideration such as the maximum load, centre of the loads, source of the transformer, topology of the area and the paths for the low voltage feeders. Provided that the mentioned data are in hand, the optimal size and location of the distribution need to be determined. This study focuses on development of the existing network by relocating of the distribution transformers that are installed far from the load centres. The distribution network of Duhok city has been mapped using Geographic Information System (GIS) which helps to visualize the location of substations, transformers and feeders. The physical locations of transformers as well as the route for medium and low voltage feeders can be easily located on GIS map.
The procedure included:
- 1. Determining the transformers that are expected to have installed far from the load centres and have high rate of power losses and the large amount of voltage drop. A visual review of the GIS map can help the system operator locate transformers positioned away from the main load areas
- 2. The next step includes drawing the single line diagram of the transformers and its low voltage feeders using ETAP program.
- 3. The load flow analysis will be conducted in order to find the best location for the transformers in term of power losses and voltage profile.
- 4. Several locations will be proposed to find the location where the losses are minimum and have lowest voltage drop.
- 5. Later, the percentage of reduction in losses and improvement in voltage profile is demonstrated.
- 6. In addition to loss reduction and voltage improvement, there will be a substantial saving of conductors and more handling capacity of the transformers
Voltage Drop Calculations
The difference between the sending end voltage and receiving end voltage is called the voltage drop. The causes of the voltage drop are the resistance of the conductors and the amount of the current passing through the conductor(Wattimena, 2022)(Sadiq et al., 2022)(Zainuddin & Wiraputra, 2017). With an increase in the amount of the current passing through the conductor, the amount of the voltage drop is higher. The higher the impedance or resistance of the conductors, the greater is the amount of the drop in the voltage. The conductor resistance increases with an increase in the length of the conductor. Moreover, the larger the cross-section area of the conductor, the lower is the resistance of the conductor. Another factor that contribute to increase in the voltage drop is the power factor. The higher the power factor, the lower is the amount of the voltage drop. the main drawbacks of the voltage drop are undesirable voltage at consumer end, high power loss in the lines and lowering the handling capability of system equipment such transformers, busses and conductors(Sadiq, Mohammed, et al., 2024)(Sadiq & Antar, 2025)(Ashraf et al., 2021).
Voltage drops occur along transmission lines due to the line's inherent resistance and inductance. These drops can lead to several negative impacts, such as insufficient voltage reaching the end-user, higher power losses along the line, and decreased capacity of feeders and buses within the system. Inductive loads, in particular, worsen the issue by drawing more current, which further increases the voltage drop across the transmission line(P. Distribution & Voltage, n.d.).
The equivalent circuit of the distribution line is shown in Figure 1.
Equivalent circuit of distribution line(Zainuddin & Wiraputra, 2017).
Where Vs is the voltage on the sending side (Volts), Vr is the voltage on the receiving side (Volts), I is the current flowing in the line (Amperes) , R is the resistance of the line (ohms) and X is the reactance of the line (ohms)
The combination of resistance (R) and reactance(X) is called impedance (Z) which is expressed in ohms. The impedance formula is shown in Eq. (1)
\[Z = R + jX\] \[|Z| = \sqrt{R^2 + X^2}\] (1)
The voltage drop can be calculated using Eq. (2)
\[\Delta V = I * R * \cos \phi + I * X * \sin \phi \tag{2}\]
∆V is the voltage drop and ∅ is the angle between the voltage and current.
The magnitude of the voltage drop can be calculated using Eq. (3) (Tanjung, 2018).
\[\Delta V = I * Z \tag{3}\]
The voltage regulation in a distribution line is expressed by the Eq.(4)
\[V_{reg} = \frac{V_s - V_r}{V_r} \times 100\% \tag{4}\]
Where is the voltage regulation, Vs and Vr are sending and receiving voltage respectively.
The voltage limits for this study are shown in Table 1.
Table 1 Range of voltages
| Function | Critical | Marginal |
|---|---|---|
| Overvoltage | 105% | 102% |
| Undervoltage | 94% | 96% |
Power Loss Calculations
A distribution system consists of several components which contribute and have an impact on the power losses of the system. Therefore, when the electricity is generated, stepped up, transmitted, stepped down and delivered to the consumers, a part of this power is lost. The amount of the power losses can be controlled to some extent by appropriate design, operation and maintenances of the network. The power losses in distribution network is directly proportional to the resistance of the conductor and to the square of the current flowing in the conductor as shown in Eq.(5) (Tanjung, 2018)(Sadiq, Ameen, et al., 2024)(Faqishafyee et al., 2024).
\[\Delta P = I^2 * R \tag{5}\]
∆P is the power losses on the network (Watt), I is the current on the network (Ampere) and R is the resistance of conductors (Ohm).
The power losses in three phase networks are calculated using Eq.(6)
\[\Delta P = 3 * I^2 * R \tag{6}\]
Case Study
This study investigated the power loss rates and voltage profiles of several 11/0.416 kV transformers located in Duhok city. The selected units represent a sample of transformers that are installed far from load centres, leading to increased power losses and significant voltage drops. Each transformer in the network is assigned a unique identification number within the GIS map. The details of selected transformers are shown in Table 2.
Table 2 Data of transformer for selected case study
| Transformer ID | Transformer capacity kVA | 11kV feeder ID |
| 2016 | 630 | F6 |
| 1760 | 250 | F3 |
| 1623 | 250 | F551 |
| 1153 | 400 | F551 |
The GIS mapping for transformer with ID=2016 which has been selected for the case study are shown in Figure 2.
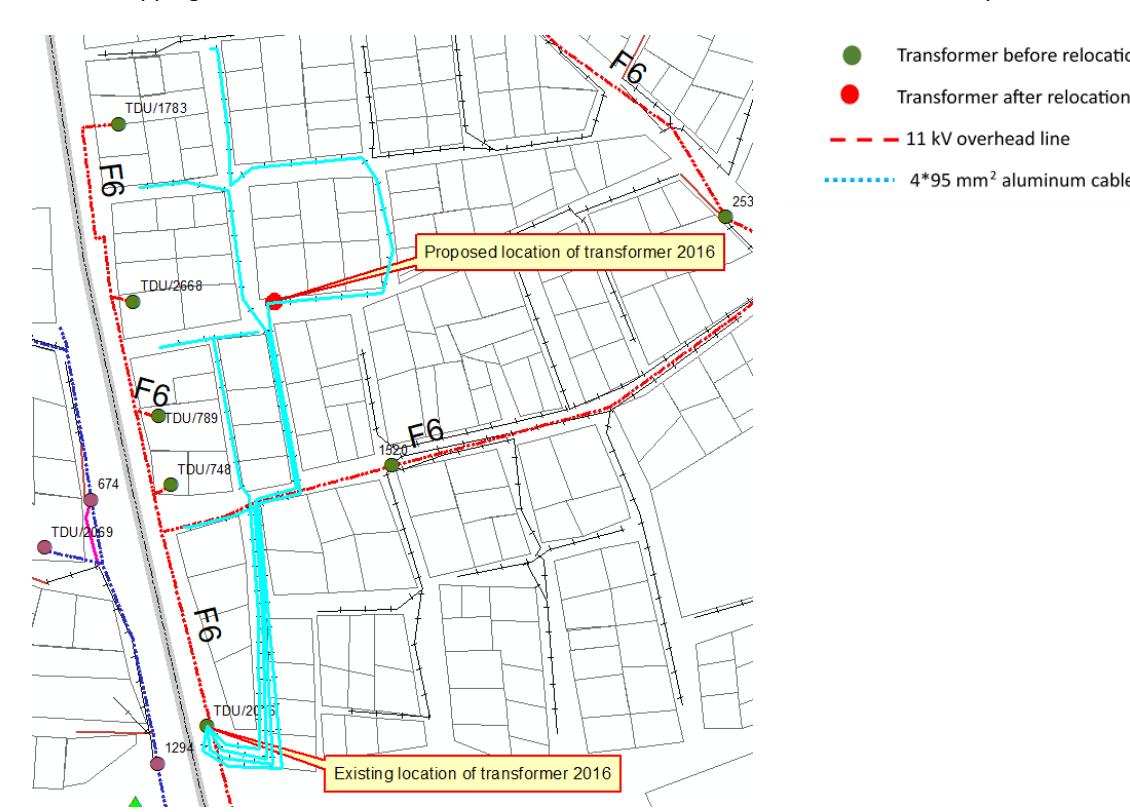
GIS layout for transformer 2016.
Centre- Duhok (DMCC), the load flow analysis of the transformer 2016 before relocation is shown in figure 3.
Based on the information obtained from GIS map and data provided by the Directorate of Control and Communication
ETAP load flow analysis for transformer 2016 before relocation.
Margin voltage drop Critical voltage drop
The load flow analysis shows the current of the source, branches as well as the voltage of busses. The load flow illustrates that all busses at consumer end are subjected to either margin or critical voltage drop. Table 3, is extracted from the load flow which shows the voltage of busses and amount of the load for each bus.
| Bus ID | Nominal kV | Voltage % | MW Loading Status | |
|---|---|---|---|---|
| Bus1 | 11 | 100 | 0.41 | Normal |
| Bus2 | 0.416 | 97.24 | 0.402 | Normal |
| Bus3 | 0.416 | 95.59 | 0.104 | Margin |
| Bus4 | 0.416 | 94.94 | 0.081 | Margin |
| Bus5 | 0.416 | 94.66 | 0.0516 | Margin |
| Bus6 | 0.416 | 94.6 | 0.0225 | Margin |
| Bus7 | 0.416 | 94.53 | 0.081 | Margin |
| Bus8 | 0.416 | 94.06 | 0.0582 | Margin |
| Bus9 | 0.416 | 93.83 | 0.029 | Critical |
| Bus11 | 0.416 | 92.47 | 0.0869 | Critical |
| Bus12 | 0.416 | 92 | 0.0577 | Critical |
| Bus13 | 0.416 | 91.84 | 0.0288 | Critical |
| Bus14 | 0.416 | 90.2 | 0.109 | Critical |
| Bus15 | 0.416 | 89.64 | 0.0796 | Critical |
| Bus16 | 0.416 | 88.92 | 0.0505 | Critical |
| Bus17 | 0.416 | 88.67 | 0.022 | Critical |
Table 3 Voltage and power of busses before transformer relocation.
After selecting the location for the transformer which guarantees minimum power losses and good improvement in voltage profile, the related ETAP load flow is shown in Figure 4
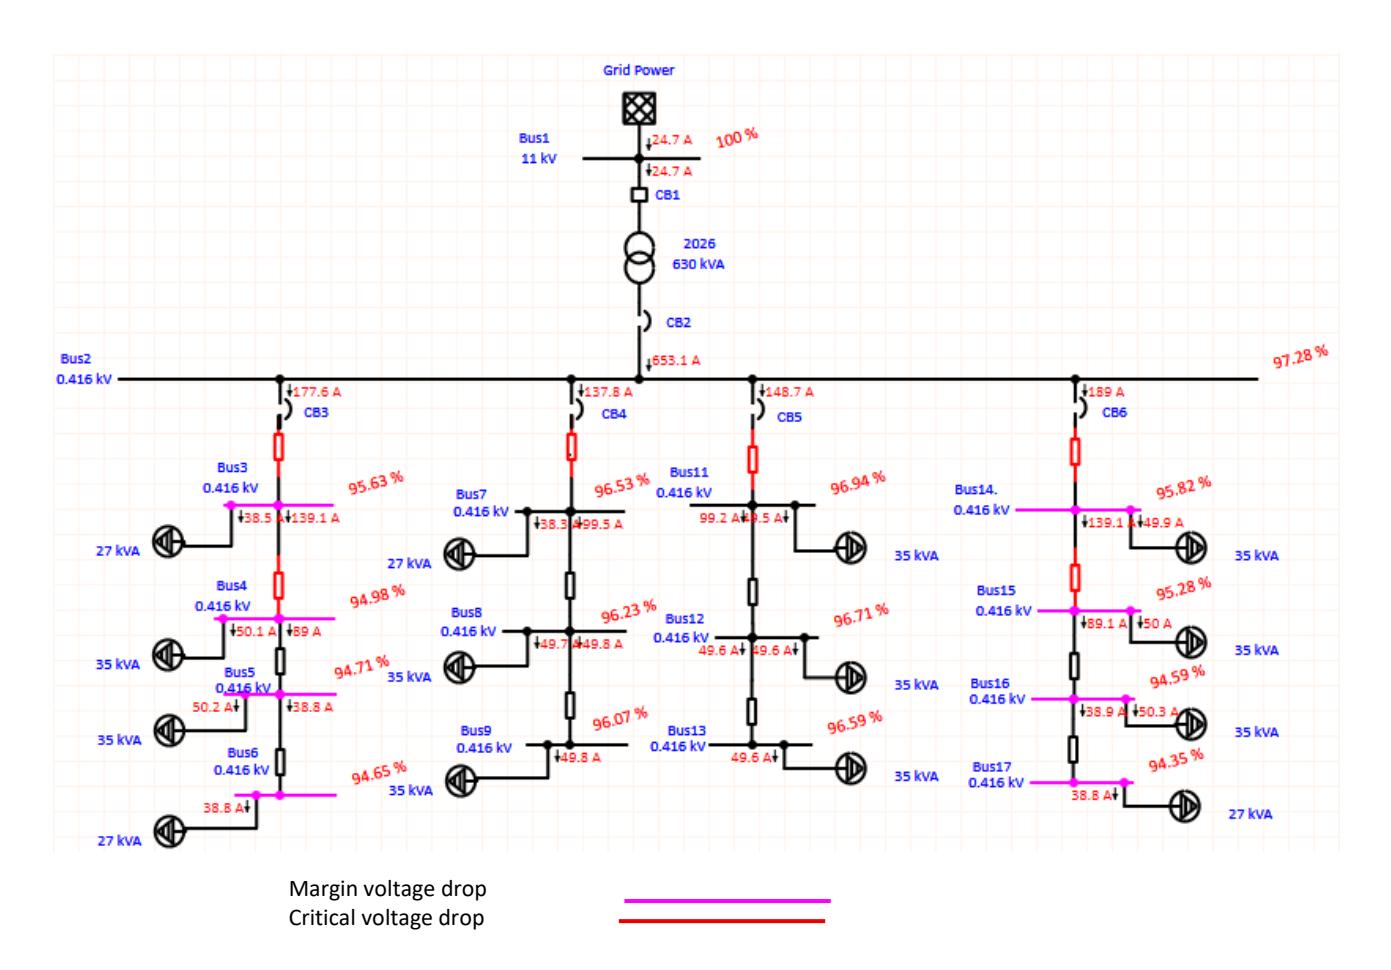
Load flow analysis for transformer 2016 after relocation.
The voltage and power of the busses after the transformer relocation are shown in Table 4.
Table 4 Voltage and power of busses after transformer relocation.
| Bus ID | Nominal kV | Voltage% | MW Loading | Status |
|---|---|---|---|---|
| Bus1 | 11 | 100 | 0.399 | Normal |
| Bus2 | 0.416 | 97.28 | 0.391 | Normal |
| Bus3 | 0.416 | 95.63 | 0.104 | Margin |
| Bus4 | 0.416 | 94.98 | 0.0809 | Margin |
| Bus5 | 0.416 | 94.71 | 0.0515 | Margin |
| Bus6 | 0.416 | 94.65 | 0.0224 | Margin |
| Bus7 | 0.416 | 96.53 | 0.0816 | Normal |
| Bus8 | 0.416 | 96.23 | 0.0587 | Normal |
| Bus9 | 0.416 | 96.07 | 0.0293 | Normal |
| Bus11 | 0.416 | 96.94 | 0.0885 | Normal |
| Bus12 | 0.416 | 96.71 | 0.0588 | Normal |
| Bus13 | 0.416 | 96.59 | 0.0293 | Normal |
| Bus14 | 0.416 | 95.82 | 0.111 | Margin |
| Bus15 | 0.416 | 95.28 | 0.0814 | Margin |
| Bus16 | 0.416 | 94.59 | 0.0516 | Margin |
| Bus17 | 0.416 | 94.35 | 0.0224 | Margin |
A comparison between Figure 4 and Table 3 indicates a significant reduction in the number of low-voltage buses experiencing voltage drop after the transformer was relocated. As a result, none of the buses are subjected to excessive voltage drop.
The data of power generated, load consumption and power lost before and after transformer relocation are shown in Table 5.
| Study ID | Before transformer relocation | After transformer relocation | |
|---|---|---|---|
| Study Case ID | FL | FL | |
| Data Revision | Base | Base | |
| Configuration | Normal | Normal | |
| Loading Cat | Design | Design | |
| Generation Cat | Design | Design | |
| Diversity Factor | Normal Loading | Normal Loading | |
| Buses | 16 | 16 | |
| Branches | 15 | 15 | |
| Power Grids | 1 | 1 | |
| Loads | 14 | 14 | |
| Load-MW | 0.378 | 0.382 | |
| Load-Mvar 0.234 | 0.237 | ||
| Generation-MW | 0.41 | 0.399 | |
| Generation-Mvar | 0.251 | 0.25 | |
| Loss-MW | 0.0322 | 0.0164 | |
| Loss-Mvar | 0.0167 | 0.0133 | |
Table 5 Data of the loads before and after transformer relocation.
Referring to Table 4 and using the Eq. (7), the power losses before and after the transformer relocation can be obtained
\[Power losses = \frac{Power generated - power consumed}{Power generated} * 100\%\] (7)
Before transformer relocation
Power losses = \[\frac{(410+j251)-(378+j234)}{(410+j251)} * 100\% = (0.07526 - j0.0053) * 100\% = 7.5454\%\]
After transformer relocation
Power losses = \[\frac{(399+j250)-(382+j237)}{(399+j250)} * 100\% = (0.04451 + j0.0054) * 100\% = 4.4844\%\]
The Eq. (8), is used to calculate the percentage of power loss reduction
Power loss reduction (%) = \[\left(\left(\frac{\text{Power losses after transformer relocation}}{\text{Power losses before transformer relocation}}\right) - 1\right) * 100\%\] Power loss reduction (%) = \(\left(\left(\frac{4.4844}{7.5454}\right) - 1\right) * 100\% = 40.81\%\)
Similarly, the voltage drops and power losses can be obtained for the rest of transformers that are listed in Table 2.
Tables 6 and 7 demonstrates the voltage drop improvement and power loss reduction after relocation transformers 1623 and 1153 respectively.
| Transformer 1623 | |||||||
|---|---|---|---|---|---|---|---|
| Bus ID | Nominal kV | Voltage before relocation | Voltage after relocation | Power losses before relocation | Power losses after relocation | Loss reduction (%) | |
| Bus1 | 11 | 100 | 100 | ||||
| Bus2 | 0.416 | 97.12 | 97.16 | ||||
| Bus3 | 0.416 | 94.52 | 96.92 | ||||
| Bus4 | 0.416 | 93.08 | 95.5 | ||||
| Bus5 | 0.416 | 92.33 | 94.77 | 6.71% | 4.21% | 37.26% | |
| Bus6 | 0.416 | 91.99 | 94.43 | ||||
| Bus7 | 0.416 | 94.17 | 96.98 | ||||
| Bus8 | 0.416 | 93.7 | 96.52 | ||||
| Bus9 | 0.416 | 93.46 | 96.29 | ||||
Table 6 Voltage and power losses of busses- Transformer 1623.
| Transformer 1153 | ||||||
|---|---|---|---|---|---|---|
| Bus ID | Nominal voltage | Voltage before relocation | Voltage after relocation | Power losses before relocation | Power losses after relocation | Loss reduction (%) |
| Bus1 | 11 | 100 | 100 | |||
| Bus2 | 0.416 | 97.39 | 97.35 | |||
| Bus3 | 0.416 | 97.08 | 92.71 | |||
| Bus4 | 0.416 | 95.92 | 91.52 | |||
| Bus5 | 0.416 | 95.3 | 90.88 | 7.12% | 3.94% | 44.67% |
| Bus6 | 0.416 | 94.99 | 90.56 | |||
| Bus7 | 0.416 | 96.62 | 95.79 | |||
| Bus8 | 0.416 | 96.24 | 94.61 | |||
| Bus9 | 0.416 | 96.62 | 93.83 | |||
| Bus10 | 0.416 | 96.24 | 93.44 | |||
Table 7 Voltage and power losses of busses- Transformer 1153.
Limitations
The limitations of this study are
- 1. Scope Limitation: This case study analyses only 4 out of 6,950 distribution transformers in the network, which may limit the generalizability of the findings.
- 2. Data Variability: The transformer loading data used in the study is based on actual measurements from the system operator. However, these values are subject to change over time due to fluctuations in demand and operational conditions.
- 3. Seasonal Variation: The transformer load data was recorded in July 2024. These loads are likely to vary seasonally and may differ significantly during the winter period, which is not captured in this analysis.
- 4. Analytical Assumptions: For the purpose of load flow analysis, a uniform power factor of 85% is assumed for all connected loads. This simplification may not reflect the true power factor variability across different consumer types and conditions.
Conclusion
This work illustrates the status of bus voltages and power losses for four numbers of distribution transformers installed in Duhok city. It compares the voltage of buses and power losses before and after relocation the transformers. The study demonstrates that by transformer relocation, the voltage profile can be improved substantially and the critical voltage drop can be overcome. In addition, there is a significant reduction in power losses. Relocating transformer 1623 shows that the maximum reduction of power losses is 37.26%, while 40.67% power loss minimization is recorded for transformer 1153. Moreover, installing transformers in load centers requires fewer materials, such as cables and insulators. This study shows the necessity and effectiveness of installing the transformers close to the loads, which have a great influence on voltage profile improvement and power loss reduction.
This study presents a detailed assessment of bus voltage levels and power losses for four distribution transformers in Duhok city, comparing their performance before and after relocation closer to load centers. The results clearly demonstrate that relocating transformers from distant points to areas closer to actual load centers leads to notable improvements in network performance.
Quantitatively, transformer 1623 exhibited a 37.26% reduction in power losses post-relocation, while transformer 1153 achieved a maximum loss reduction of 40.67%. These improvements are significant when compared to conventional system upgrades or reactive compensation methods, which typically result in power loss reductions of only 10–20% in similar low-voltage distribution networks, as reported in previous studies.
Furthermore, the voltage profile across low-voltage buses improved considerably. Prior to relocation, several buses experienced voltage drops below acceptable thresholds. After relocation, as evidenced by a comparison of Figures 4 and Table 3, the number of buses affected by critical voltage drop was reduced to zero, confirming the effectiveness of this approach in enhancing voltage stability.
In addition to electrical benefits, transformer relocation led to a reduction in required infrastructure, such as shorter cable runs and fewer supporting insulators, thus contributing to cost savings in materials and installation.
Overall, this study emphasizes the importance of optimal transformer placement in distribution networks. Compared to other voltage improvement techniques, transformer relocation offers a more direct, cost-effective, and technically efficient solution for improving voltage profiles and minimizing energy losses.
Nomenclature
kV Kilo volt
ETAP Electrical Transient Analyzer Program
MV LV m km kW Medium voltage Low voltage Meter Kilo meter Kilo watt
kVar Kilo- volt – ampere- reactive
MW Mega watt
Mvar GIS Mega- volt – ampere- reactive Geographic Information System
Compliance with ethics guidelines
The authors declare they have no conflict of interest or financial conflicts to disclose.
This article contains no studies with human or animal subjects performed by the authors.