
Introduction
Climate change stands as one of the most pressing challenges of the 21st century, negatively affecting ecosystems, economies, and societies worldwide. The primary driver of global warming is the rise in greenhouse gas concentrations, particularly CO2, resulting from fossil fuel combustion and industrial activities. This increase has led to significant alterations in weather patterns, rising sea levels, and a heightened frequency and severity of extreme weather events (Bolan et al., 2024; Moore et al., 2024; Shaikh et al., 2024). As a result, reducing CO2 emissions has become a global imperative, essential for slowing climate change and ensuring environmental sustainability and future livelihoods.
Transforming CO2 into value-added chemicals represents a promising complementary approach to addressing this issue. This technology allows CO2, typically regarded as waste, to be converted into industrial chemicals, renewable fuels, and other synthesis materials, thereby fostering a more sustainable closed carbon cycle (Alli et al., 2023; Alli et al., 2024; Kumar & Eswari, 2023; Yusuf et al., 2023). One of the key methods for CO2 conversion is the Carbon Dioxide Reduction Reaction (CO2RR), which facilitates the direct electrochemical transformation of CO2 into multi-carbon products (Bi et al., 2018; Li et al., 2017; Peterson et al., 2010; Tripkovic et al., 2013). This method not only aids in mitigating CO2
2PT. PLN (Persero), Kantor Pusat, Jalan Trunojoyo Blok M - I No. 135, DKI Jakarta 12160, Indonesia
5Quantum and Nano Technology Research Group, Institut Teknologi Bandung, 6Research Centre for Nanoscience and Nanotechnology, Institut Teknologi Bandung, the catalytic materials employed (Li et al., 2017; Yang et al., 2024).
emissions but also aligns with the production of renewable chemicals and fuels, potentially utilizing electricity from renewable sources. However, significant challenges remain, including low product selectivity and a heavy reliance on
Despite its potential as a solution to the global CO2 dilemma, technology faces significant challenges that limit its efficiency and practical implementation. These include poor product selectivity and a reliance on specific catalytic materials. Although noble metal catalysts such as silver (Ag) and gold (Au) exhibit excellent performance in CO₂RR, their high cost and limited availability remain major barriers to widespread adoption (Huang et al., 2019; Li et al., 2021; Ma et al., 2022; Ma et al., 2023). To overcome these limitations, increasing research efforts have been devoted to developing non-precious metal catalysts that offer both low cost and high catalytic activity. It is now widely recognized that such catalysts can achieve excellent selectivity and efficiency through strategies such as nanostructure engineering, heteroatom doping, and alloying with other transition metals (Li et al., 2017; Maulana et al., 2019; Maulana et al., 2021; Nuruddin et al., 2023; Nuruddin et al., 2024; Saputro et al., 2021a; Saputro et al., 2021b). These approaches modify the electronic and geometric properties of the active sites, thereby enhancing CO₂ adsorption and facilitating its electrochemical conversion.
Nickel-based catalysts have emerged as highly promising materials for the electrochemical reduction of CO2, particularly toward the formation of C1 products (Liu et al., 2023). Nickel in the form of nanoparticles (He et al., 2022; Niu et al., 2021; Tan et al., 2019; Xu et al., 2020), and compounds such as nitrides (Zhao et al., 2023; Hou et al., 2018) and chalcogenides (Han et al., 2022; Saxena et al., 2022) has been demonstrated to efficiently generate C1 products, predominantly CO, with Faradaic efficiencies exceeding 80%. Moreover, Ni single-atom catalysts anchored on carbon frameworks demonstrate enhanced activity and selectivity toward CO production, even under industrially relevant current densities (Chen et al., 2023; Hua et al., 2022; Jeong et al., 2019; Zhao et al., 2021; Zheng et al., 2019). These advancements highlight the strong potential of Ni-based materials for driving the CO2RR process, while underscoring the need to explore novel Ni-containing compounds to further enhance catalytic activity and product selectivity.
In recent years, bimetallic nickel phosphate materials, particularly NiCo phosphate, have demonstrated remarkable performance in various electrochemical applications, such as the hydrogen evolution reaction, oxygen evolution reaction, supercapacitors, and electrochemical sensors (Darminto et al., 2025; El-Gohary et al., 2023; Ikhwan et al., 2025; Li et al., 2021; Nuruzzahran et al., 2025; Qian & Miao, 2019; Septiani et al., 2020a; Septiani et al., 2020b; Syaifullah et al., 2026; Wang et al., 2021; Wijayanti et al., 2025; Zhang et al., 2019; Zhang et al., 2022; Zhao & Yuan, 2020; Zhou et al., 2019). Despite these advances, their potential as electrocatalysts for the CO2 reduction reaction (CO2RR) remains largely unexplored. In this work, we explore the catalytic performance of NiCo phosphate in a 1:1 ratio [Ni3Co3(PO4)4, or simply NiCoPO] along with transition metal-doped variants (NiCoPO-M, where M = Mn, Fe, and Cu) using density functional theory (DFT) calculations. Our focus is on their ability to catalyze the two-electron CO2RR to produce CO and formic acid (HCOOH). We anticipate that incorporating M dopants will modify product selectivity and enhance the catalytic activity of the surfaces, leading to improved efficiency in the CO2RR process.
Computational Details
The Density Functional Theory (DFT) calculations in this study were conducted using the Quantum Espresso package (Giannozzi et al., 2009). The interaction between valence electrons and ionic reality is represented by the ultra-soft pseudopotential (Maulana et al., 2021). The exchange and correlation effects were addressed within the generalized gradient approximation (GGA) using the Perdew-Burke-Ernzerhof (PBE) functional (Perdew et al., 1996). For consistency with our previous studies on electrocatalysts, van der Waals interactions were treated using the semi-empirical DFT-D2 method developed by Grimme (Grimme, 2006).
Experimentally, the active facet of NiCoPO responsible for electrocatalytic performance has not yet been identified. In our previous work, the most stable NiMPO(100) surface was used as a model to study the OER activity of bimetallic NiMPO, and the calculated trends showed good agreement with experiments (Nuruzzahran et al., 2025). Following this rationale, in the present study we also adopt the (100) facet for modeling NiCoPO and NiCoPO–M surfaces to investigate the CO2RR mechanism. It should be noted that while other facets may also exhibit distinct catalytic behaviors, the present investigation is limited to the (100) facet.
The bottom two Ni3Co3(PO4)4 layers were fixed to simulate bulk conditions, while the top layer was allowed to fully relax. The dimensions and structure of the unit cell used for this modeling are shown in Figure 1. The Brillouin zone was sampled at the gamma point due to the large unit cell size, with a kinetic energy cutoff of 50 Ry and a density cutoff of 500 Ry to ensure accurate calculations of wavefunction and charge density (Nuruzzahran et al., 2025). A 15 Å vacuum was added to prevent interactions between periodic images, and dipole corrections were applied to address potential asymmetry in charge distribution. The system was relaxed until the residual forces on each atom were below 0.025 eV/Å. For isolated molecule calculations, a 30 Å x 30 Å cubic cell at the gamma point cell was used (Li et al., 2024).
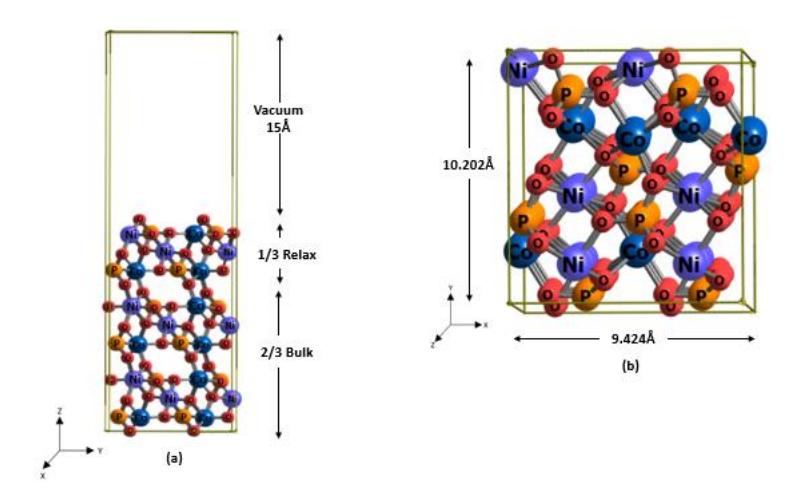
Figure 1 (a) Side view and (b) top view of NiCoPO (100).
The adsorption energy of an adsorbate on the active site of the NiCoPO(100) and NiCoPO(100)-M surfaces is calculated using the following relation:
\[E_{ads} = E(X) - (E(X) + E(X))\] (1)
\(E(^*X)\), \(E(^*)\), and E(X) represent the DFT total energies of an X species adsorbed on the surface, a clean surface, and an isolated X species, respectively.
We approximated the change in free energy of the basic electrochemical processes involved in the CO<sub>2</sub>RR process using the computational hydrogen electrode (CHE) model (Norskov et al., 2004). Using the standard hydrogen electrode (SHE), the chemical potential of \(\frac{1}{2}\) H<sub>2</sub> gas is related to the free energy of the [H<sup>+</sup>+e<sup>-</sup>] reaction under standard conditions. The following relation is used to determine the change in free energy for *A + H<sup>+</sup> + e<sup>-</sup> (U) \(\rightarrow\) *AH elementary step at a given electrode potential U (\(\Delta\)G(U)).
\[\Delta G(U) = E(^*AH) - (E(^*A) - \frac{1}{2}E(H_2) + \Delta ZPE - T\Delta S - pH k_b T \ln 10 + eU)\] (2)
The changes in zero-point energies and entropies are represented by \(\Delta ZPE\) and \(\Delta S\), respectively. The NIST database provided the ZPE and S values for the CO<sub>2</sub>RR intermediates. The ZPE was calculated as \(ZPE = \frac{1}{2} \sum_i h \nu_i\), where \(\nu_i\) corresponds to the vibrational frequency of mode i. We applied the following correction for the PBE functional to account for the error in reaction energies from periodic DFT calculations (Blaylock et al., 2009; Calle-Vallejo et al., 2011; Peterson et al., 2010). For CO<sub>2</sub> and CO molecules, the enthalpic corrections are +0.17 and -0.30 eV, respectively (Maulana et al., 2021). In order to approximate the solvent interaction with the OH group of OH-containing intermediates, we additionally include a correction of -0.30 eV (Kim et al., 2017; Tripkovic et al., 2013). We also performed microkinetic simulations to calculate the turnover frequencies (TOFs) of the CO<sub>2</sub>RR pathways, using the Gibbs free energies of the elementary reactions as input parameters. The detailed derivation of the microkinetic model is provided in our previous publications (Maulana et al., 2021; Saputro et al., 2021a; Saputro et al., 2021b).
One common method for comparing the electrochemical process performance of some active site systems is by using the value of limiting potential (\(U_L\)). At a potential greater than the \(U_L\), the reaction rate drastically drops. \(U_L\) is defined as \(U_L = -\Delta G_{max}/e\) in the CHE approximation, where \(\Delta G_{max}\) is the maximum free energy of a given reaction pathway at its equilibrium potential. When a system's \(U_L\) is higher, its electrochemical activity for a given reaction pathway is typically better than that of other systems. Unfortunately, this parameter is not particularly useful for assessing the performance of a \(CO_2RR\) process due to the selectivity issue from the parasitic HER process. Therefore, a more effective metric is the limiting potential difference between the \(CO_2RR\) and HER processes, represented as \(\Delta U_L = U_L\) (\(CO_2RR\))–\(U_L\) (HER) (Bi et al., 2018; Kim et al., 2017; Li et al., 2017). A more positive \(\Delta U_L\) signifies enhanced selectivity toward \(CO_2RR\).
In this work, we focus on the two-electron \(CO_2\) reduction reaction (\(CO_2RR\)) pathways that lead to the production of carbon monoxide (\(CO_2\)) and formic acid (\(CO_2\)). Both \(CO_2\) and \(CO_2\) are produced through distinct sets of elementary reaction steps (Maulana et al., 2021). The reduction of \(CO_2\) to \(CO_2\) to \(CO_2\) to typically follows these steps:
\[CO_{2(g)} + H^+ + e^- + * \rightarrow *COOH\] (3)
*COOH + H\[^+\] + e\(^-\) \(\rightarrow\) *CO + H2O(I) (4)
\[*CO \rightarrow CO_{(g)} + *\] (5)
where * and *X corresponds to an empty active site and an adsorbed X species on the active site. For the formation of HCOOH, the elementary reactions are as follows:
\[CO2(g) + H+ + e- + * \rightarrow *HCOO\] (6)
*HCOO + H\[^+\] + e\(^-\) \(\rightarrow\) *HCOOH (7)
*HCOOH \[\rightarrow\] HCOOH(aq) + * (8)
The key difference between these two pathways lies in the intermediates involved: CO production proceeds via a carboxyl intermediate (COOH), while HCOOH formation involves a format intermediate (HCOO).
Additionally, the parasitic hydrogen evolution reaction (HER), which competes for protons and electrons to form H2, is assumed to follow this mechanism:
\[H^{+} + e^{-} + * \rightarrow *H \tag{9}\]
\[H^+ + e^- + *H \rightarrow H_{2(g)} + *\] (10)
Step (9), known as the Volmer step, involves the adsorption of hydrogen atoms (*H) onto the catalyst surface via protons present in the electrolyte. Step (10), known as the Heyrovsky step, involves the bonding of another proton with the adsorbed *H to produce H2. Together, these two steps constitute the Volmer-Heyrovsky mechanism (Ferriday et al., 2021).
Results
Formation energy of surface doping
In this study, transition metals (Mn, Cu, and Fe) were doped into the NiCoPO(100) surface by substituting one of the top-layer Ni or Co atoms with a dopant atom (M). As an illustration, in the case of Mn-doped NiCoPO(100), an Mn atom can replace a surface Ni atom (denoted as NiCoPO(100)-Mn@Ni, see Figure 2a) or a surface Co atom (denoted as NiCoPO(100)-Mn@Co, see Figure S5a of Supporting Information). The formation energy for this substitution is calculated using the equation:
\[E_{\text{form}} = E(\text{NiCoPO-M}) - (E(\text{NiCoPO}) + \mu_{\text{M}} - m\mu_{\text{Ni}} - n\mu_{\text{Co}})\] \[\tag{11}\]
E(NiCoPO-M), E(NiCoPO), and μi represent the total energies of the NiCoPO–M surface, the pristine NiCoPO surface, and the chemical potential of metal , respectively. The chemical potential of Mn is taken from body-centered cubic (BCC) Mn, Fe from BCC Fe, Co from face-centered cubic (FCC) Co, Ni from FCC Ni, and Cu from FCC Cu. value of m and n depends on the substitution site of the M atom. For doping at the Co site, m = 0 and n=1, while for doping at the Ni site, m=1 and n=0. The formation energies for all doping systems on the NiCoPO(100) surface, considering both Ni and Co substitution sites, are presented in Table 1.
Table 1 Doping formation energy on NiCoPO(100) surface.
| System | Formation Energy (eV) |
|---|---|
| NiCoPO(100) -Mn@Ni | -2.18 |
| NiCoPO(100) -Mn@Co | -1.87 |
| NiCoPO(100) -Fe@Ni | -1.11 |
| NiCoPO(100) -Fe@Co | 0.57 |
| NiCoPO(100) -Cu@Ni | -0.39 |
| NiCoPO(100) -Cu@Co | -0.08 |
The formation energy differs between substitutions at the Ni and Co sites, with nearly all values being negative, indicating that the doping process is energetically favorable. The results consistently show that the formation energy for substitutions at the Ni site is more negative than at the Co site, suggesting that doping at the Ni site is more stable. Consequently, this study focuses on the substitution of Mn, Fe, and Cu atoms at the Ni site only. Figure 2 illustrates the most stable doping configurations for each metal.
Top view of (a) NiCoPO(100)-Mn@Ni, (b) NiCoPO(100)-Fe@Ni (c) NiCoPO(100)-Cu@Ni.
CO2 Adsorption
The initial step in the CO2RR process involves the adsorption of CO2 molecules at the catalyst's active sites. Table 2 and Figure 3 provide the adsorption energies, geometrical parameters, and the amount of charge transferred to the adsorbed CO2 molecule. The data show that CO2 binds to the metal sites with a bond distance greater than 2 Å and exhibits minimal charge transfer, indicating weak interaction. Moreover, the geometrical parameters reveal that the adsorbed CO2 maintains its linear gas-phase structure, strongly suggesting that CO2 is adsorbed in a physisorption state on most of the active sites of both NiCoPO(100) and NiCoPO(100)-M surfaces. The only exception is the Cu site on the NiCoPO(100)-Cu@Ni surface, where CO2 fails to bind effectively, indicating that this site likely has low CO2RR activity. Therefore, the CO2RR at the Cu site will not be further considered in this study.
The physisorption state of CO2 molecule can also be seen in the profile of the local density of states (LDOS) for the CO2 adsorption on the catalyst. Figure 4 shows the LDOS for CO2 adsorption on the Mn site of NiCoPO(100)-Mn@Ni surface. It is very clear that the π-orbitals of the adsorbed CO2 (HOMO) only getting slightly broadened due to polarization from the surface without experiencing any orbital splitting after in contact with the d-orbitals of the Mn atom. The absence of orbital splitting clearly indicates that the adsorbed CO2 is in the physisorption state.
Table 2 and Figure 3 show that the CO2 molecule binds exclusively to the surface metal sites across all surfaces, with no significant differences in adsorption energy due to the physisorption state. This suggests that the CO2RR process can be initiated with similar probabilities on all NiCoPO(100) and NiCoPO(100)-M active sites. Consequently, each catalyst system exhibits a range of limiting potential values arising from the contributions of multiple active sites, rather than a specific value attributed to a single site.
| Table 2 | Parameters of CO2 adsorption on the NiCoPO(100) and NiCoPO(100)-M surfaces. |
|---|
| System | Site | M – CO2 (Å) | O-C-O (o ) | 𝚫𝑸(e) | 𝐂𝐎𝟐 𝑬𝐚𝐝𝐬 (eV) |
|---|---|---|---|---|---|
| NiCoPO(100) | Ni | 2.235 | 178.81 | -0.02 | -0.06 |
| Co | 2.197 | 177.03 | -0.00 | -0.19 | |
| Ni | 2.228 | 178.39 | -0.01 | -0.14 | |
| NiCoPO(100)-Mn@Ni | Co | 2.194 | 176.24 | 0.00 | -0.25 |
| Mn | 2.354 | 178.99 | -0.01 | -0.23 | |
| Ni | 2.218 | 178.48 | -0.01 | -0.09 | |
| NiCoPO(100)-Fe@Ni | Co | 2.252 | 178.86 | -0.01 | -0.08 |
| Fe | 2.227 | 176.51 | -0.00 | -0.22 | |
| NiCoPO(100)-Cu@Ni | Ni | 2.178 | 177.02 | -0.01 | -0.16 |
| Co | 2.281 | 179.15 | -0.01 | -0.07 | |
| Cu | 2.551 | 179.21 | -0.00 | 0.04 |
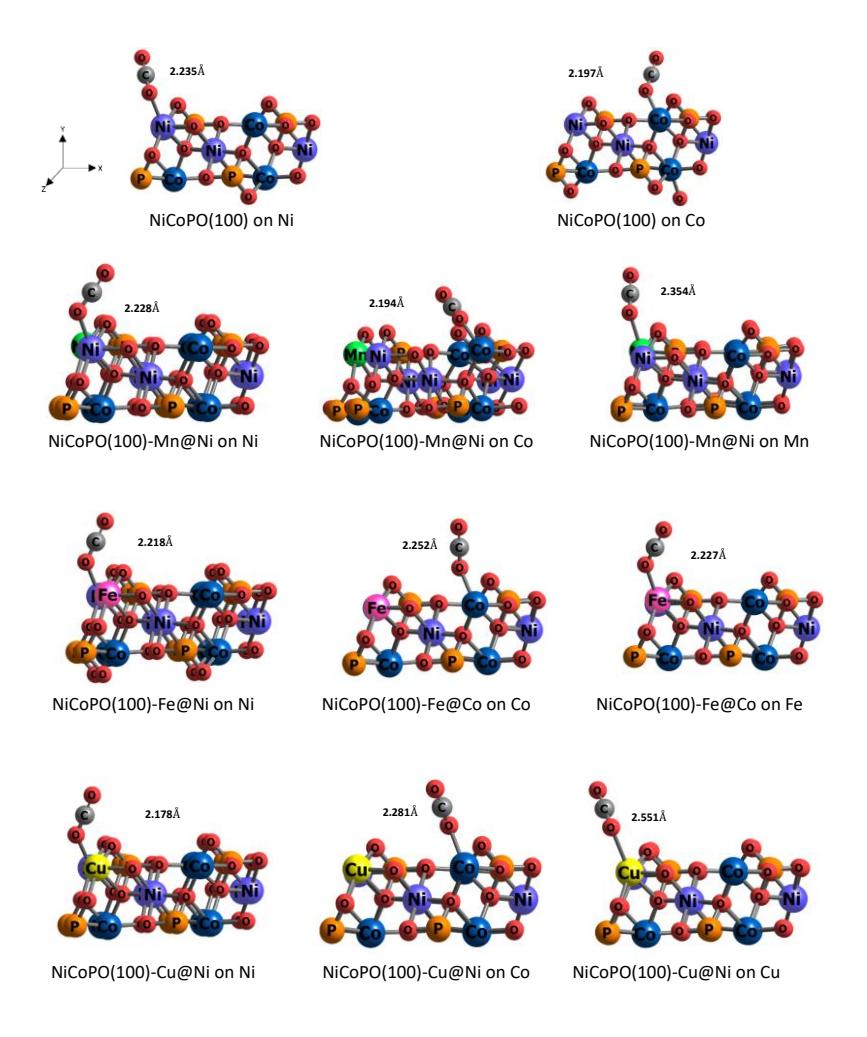
Figure 3 The geometry of CO<sub>2</sub> adsorption on the catalyst surface.
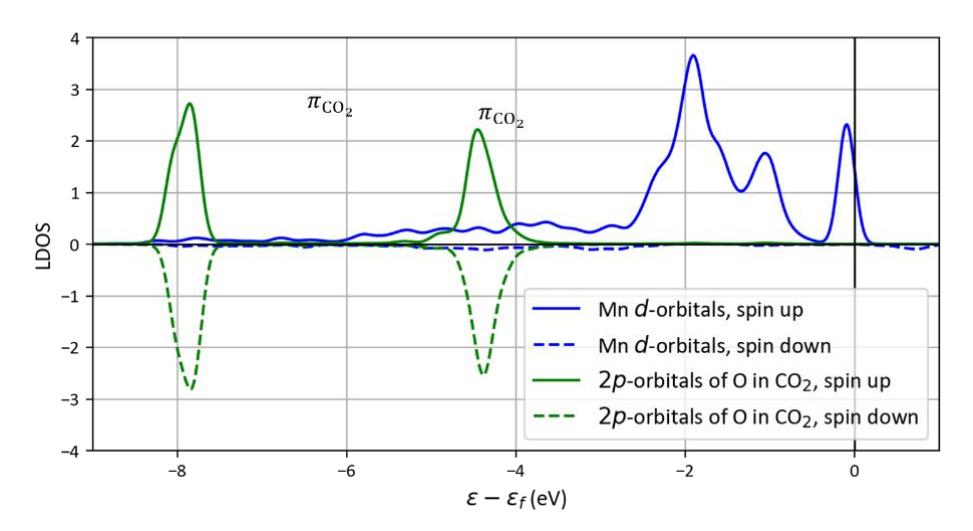
Figure 4 LDOS of CO<sub>2</sub> adsorption on Mn site of NiCoPO(100)-Mn@Ni surface
CO<sub>2</sub>RR to CO
After confirming that \(CO_2\) gas can bind to the transition metal sites of the NiCoPO(100) and NiCoPO(100)-M surfaces, we proceed to analyze the \(CO_2RR\) process at these sites. We begin with the \(CO_2\) reduction to CO, which follows the sequence of elementary electrochemical reactions (3)-(5). Figure 4 illustrates the energy profile of the CO formation
reaction at the active sites of NiCoPO(100) and NiCoPO(100)-M surfaces. This diagram offers detailed insights into the energy changes during each reaction step, enabling a comparative analysis of the various catalyst systems with regard to their CO formation efficiency. The detailed free energy values and adsorption geometries of intermediates are provided in Table S1 – S6 and Figure S1 – S4 of Supporting Information.
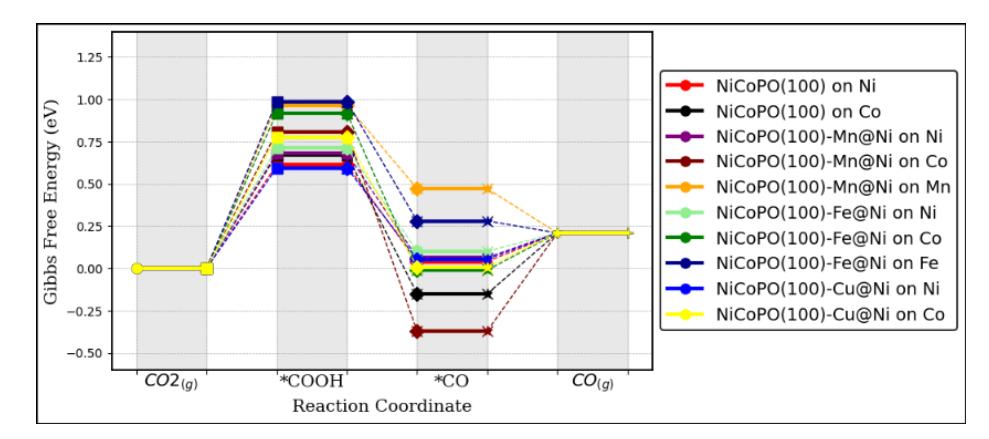
Free energy profiles for CO2RR to CO.
| Table 3 | Thermodynamics determining steps (TDS) and limiting potential UL for CO2RR to CO. |
|---|
| System | Site | TDS | UL (V) |
|---|---|---|---|
| Ni | (3) | -0.61 | |
| NiCoPO(100) | Co | (3) | -0.67 |
| Ni | (3) | -0.68 | |
| NiCoPO(100)-Mn@Ni | Co | (3) | -0.80 |
| Mn | (3) | -0.96 | |
| NiCoPO(100)-Fe@Ni | Ni | (3) | -0.71 |
| Co | (3) | -0.91 | |
| Fe | (3) | -0.98 | |
| NiCoPO(100)-Cu@Ni | Ni | (3) | -0.59 |
| Co | (3) | -0.77 |
From Figure 5, it is evident that transition metal doping can alter the Gibbs energy profile for CO formation on the NiCoPO(100) surface. The limiting potential (UL), presented in Table 3, represents the minimum electrochemical potential below which the CO2RR begins to proceed. This parameter is crucial for assessing the activity of various electrochemical catalysts. The data indicates that, generally, the lowest limiting potential for CO formation on both pure and doped NiCoPO(100) surfaces occurs at the Ni site.
However, the introduction of dopants has not significantly reduced the limiting potential for CO formation. A shift toward a more positive potential, relative to the pure NiCoPO(100) surface, is only observed at the Ni site of the NiCoPO(100)-Cu@Ni surface. This suggests that transition metal doping (Mn, Fe, and Cu) does not substantially influence the CO2RR activity for CO formation in the NiCoPO(100) system.
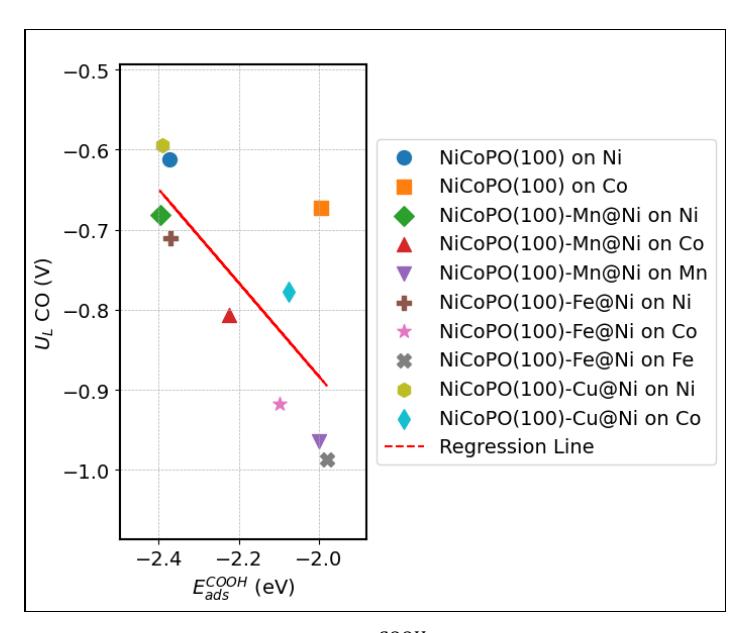
Interestingly, the thermodynamic determining step (TDS) for this conversion process consistently originates from the COOH formation step, which exhibits an endothermic profile (reaction 3), as detailed in Table 3. This finding indicates that the COOH formation step can serve as a key descriptor for explaining the activity trend of CO formation in the system under study.
Figure 6 illustrates the relationship between ads COOH and UL for CO production. While the Co site of NiCoPO(100) exhibits some deviation, the overall trend clearly shows that stronger COOH adsorption energies are associated with lower UL values for CO production. However, for most NiCoPO(100)-M surfaces, the COOH adsorption energies are weaker than those of the pristine NiCoPO(100) surface, indicating that introducing transition metal dopants (Mn, Fe, and Cu) does not effectively lower the UL for CO production pathway.
The observed activity trend can be rationalized by analyzing the electronic structure of the isolated COOH intermediate and the NiCoPO(100)-M surfaces. Figure 7a presents the localized density of states (LDOS) of the COOH molecule. Particular attention is given to the frontier molecular orbitals with predominant p-orbital character on the carbon atom, within a narrow range across all surfaces.
since COOH adsorption primarily involves bond formation between the carbon atom in COOH and the transition metal atom on the surface (see Figures S1–S4 in the Supporting Information). Based on this criterion, the α/β-HOMO and α-HOMO-2 orbitals are primarily responsible for COOH adsorption. These orbitals, particularly α-HOMO-2 and β-HOMO, are located relatively far from the Fermi level. Therefore, the surface states that interact with these orbitals must also lie within a comparable energy range to enable effective orbital hybridization. Figure 8 presents the d-orbital profiles of the NiCoPO(100)-M surfaces. It is evident that the d-orbitals of the Ni and Co sites on both pristine and doped NiCoPO(100) surfaces occupy a similar energy range, whereas those of the transition metal–doped sites, especially in the spin-down channel, are generally clustered at higher energy levels. Consequently, the d-orbitals of the Ni and Co sites interact more effectively with the carbon-localized frontier orbitals of COOH than those of the transition metal– doped sites. As a result, the COOH adsorption energies at the doped sites are weaker than at the Ni and Co sites. This finding explains why transition metal doping does not significantly enhance COOH adsorption. Furthermore, the similarity in d-orbital profiles between the Ni and Co sites accounts for the clustering of COOH adsorption energies
Relation between ads COOH vs UL for CO2RR to produce CO.
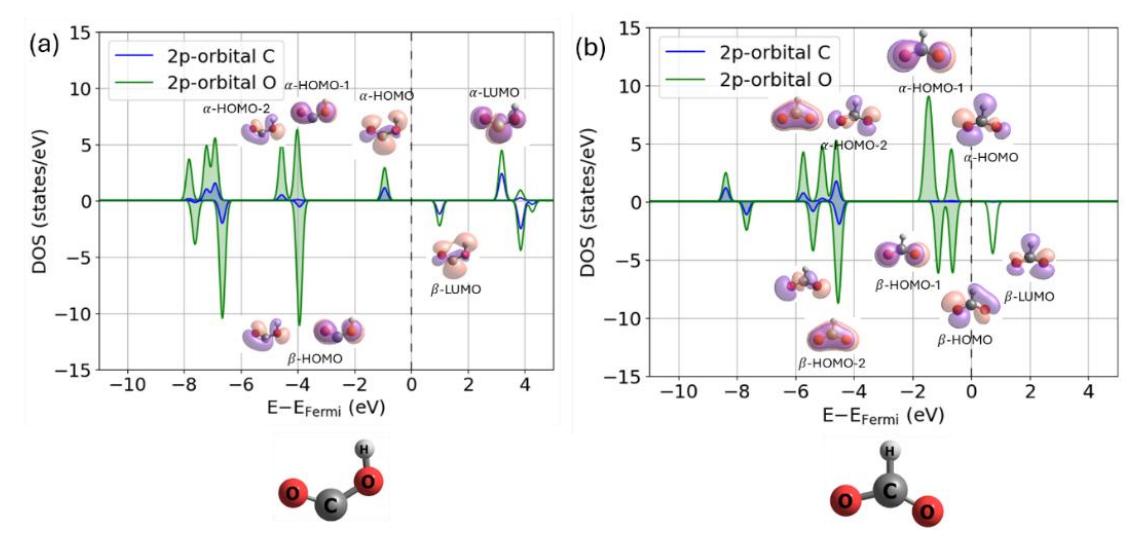
Molecular orbitals of isolated (a) COOH and (b) HCOO intermediates. Shaded area indicating occupied states below the Fermi level.
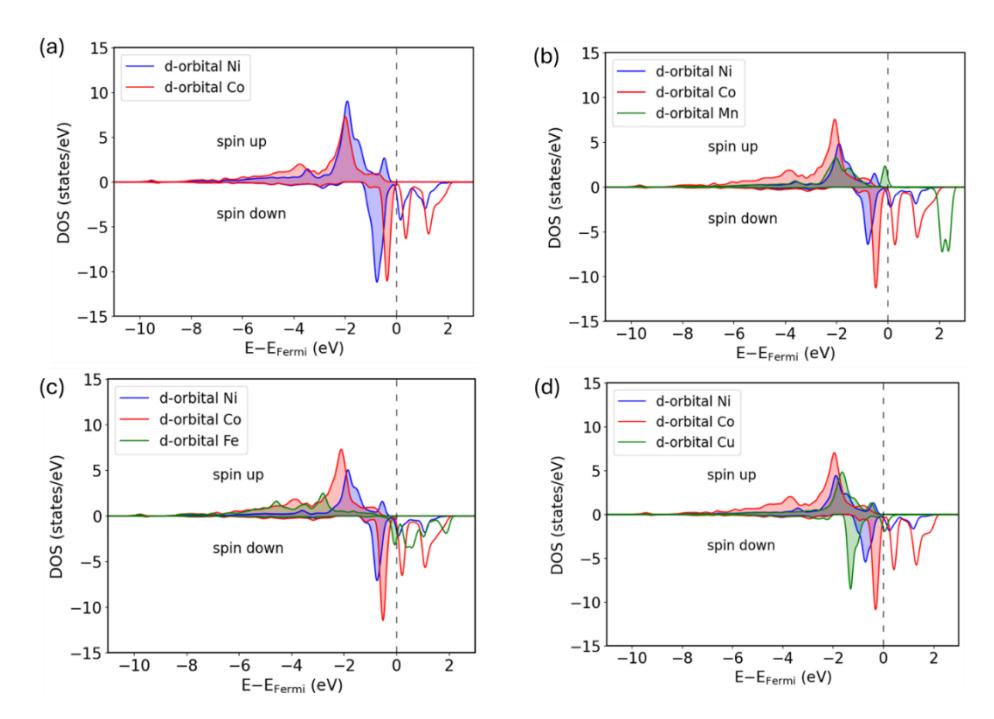
LDOS of (a) NiCoPO(100), (b) NiCoPO(100)-Mn, (c) NiCoPO(100)-Fe, and (d) NiCoPO(100)-Cu. The shaded area indicating occupied states below the Fermi level.
The TOF profiles for the CO2RR to CO pathway obtained from microkinetic simulations are presented in Figure 9a. The TOF increases sharply at a certain potential, indicating the onset of CO2 reduction, which is closely related to the calculated UL values in Table 3. To compare the activity across different sites, we extracted the TOF at -0.6 V and correlated it with the descriptors of limiting potential for CO₂RR to CO, as shown in Figure 9b. The results are consistent with the general trend predicted by the UL values in Figure 6, namely that stronger COOH adsorption energies correspond to higher CO2RR activity.
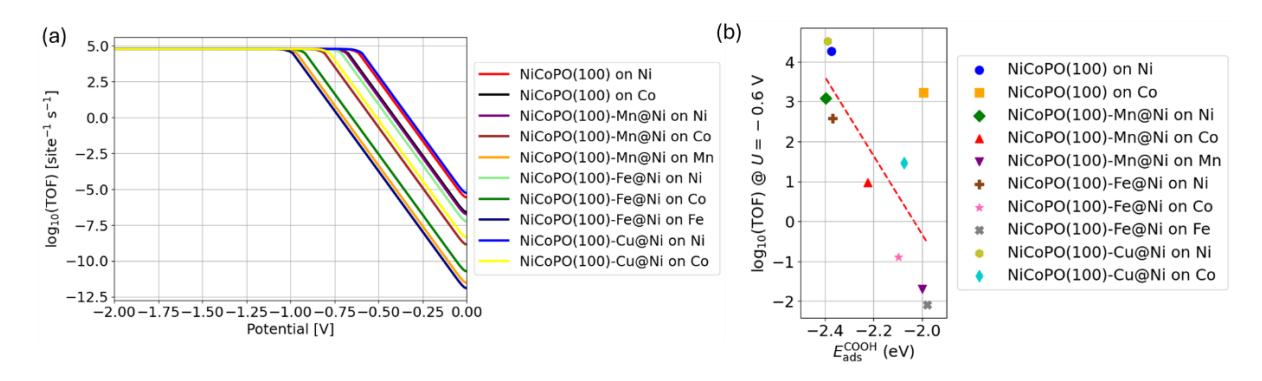
(a) TOF profiles for the CO2RR to CO pathway and relationship between ads COOH and log(TOF) (@U = -0.6 V).
CO2RR to HCOOH
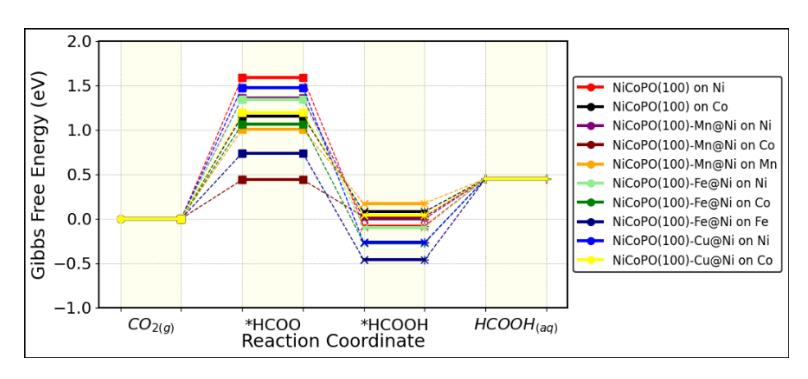
Similar to CO formation, the addition of transition metal doping alters the Gibbs free energy profile of the NiCoPO(100) surface during the reduction process for HCOOH formation. Notably, the CO2RR process leading to HCOOH in the doped NiCoPO(100) system shows significant differences. In general, doping significantly reduces the UL for HCOOH formation. Furthermore, unlike CO formation, the sites with the lowest UL for HCOOH formation are the Co site and the transition metal M doping sites. The most substantial reduction in UL is observed with Mn and Fe doping, indicating that CO2RR activity toward HCOOH formation is greatly enhanced compared to the pure NiCoPO(100) surface.
Comparing the data in Tables 3 and 4, it is evident that the UL for the CO2RR process to HCOOH on the pure NiCoPO(100) surface is much higher than that for CO formation, indicating that the NiCoPO(100) catalyst generally favors CO production over HCOOH. This trend is also observed in most of the NiCoPO(100)-M systems. However, an interesting exception is found with NiCoPO(100)-Mn. On this surface, the CO2RR process to HCOOH exhibits a UL of -0.43 V, which is significantly lower than the UL for CO formation on the pure NiCoPO(100) surface (-0.61 V). This finding indicates that Mn doping not only significantly enhances the activity for HCOOH formation but also shifts the CO2RR selectivity from CO production to HCOOH formation.
Interestingly, as in the case of CO formation, the thermodynamic determining step (TDS) for the CO2RR to HCOOH is derived from a single reaction step, the reduction of CO2 to HCOO (reaction 6), which has an endothermic profile, as shown in Figure 10. This indicates that the UL for this process can be explained using the adsorption energy of the HCOO intermediate. Figures 11(a) and 11(b) present a comparison between ads HCOO , UL, and TOF for HCOOH formation. Similar to the case of CO production, the overall trend shows that stronger HCOO adsorption energies correspond to lower UL values for HCOOH production. This observation is consistent with the Gibbs free energy profile of the CO2RR process, where the reaction pathway is primarily governed by the free energy of HCOO intermediate formation. The plot clearly demonstrates that the Co site of NiCoPO(100)-Mn has the lowest UL, as it maximizes the adsorption energy of the HCOO intermediate compared to the other active sites.
| System | Site | TDS | UL (V) |
|---|---|---|---|
| Ni3Co3(PO4)4 | Ni | (6) | -1.58 |
| Co | (6) | -1.15 | |
| Ni3Co3(PO4)4-Mn@Ni | Ni | (6) | -1.35 |
| Co | (6) | -0.43 | |
| Mn | (6) | -1.00 | |
| Ni3Co3(PO4)4-Fe@Ni | Ni | (6) | -1.34 |
| Co | (6) | -1.06 | |
| Fe | (6) | -0.73 | |
| Ni3Co3(PO4)4-Cu@Ni | Ni | (6) | -1.47 |
Co (6) -1.19
Table 4 Thermodynamics determining steps (TDS) and limiting potential UL for CO2RR to HCOOH.
Free energy profiles for CO2RR to HCOOH
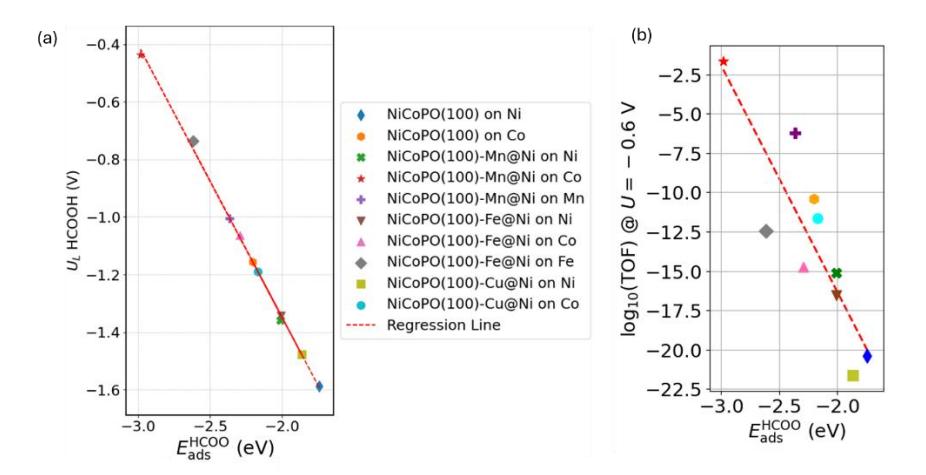
Relation between ads HCOO vs (a) UL for CO2RR to produce HCOOH and (b) log(TOF) (@U = -0.6 V).
The above discussion clearly indicates that incorporating transition metal dopants can substantially influence the limiting potential for HCOOH formation by enhancing HCOO adsorption. This behavior contrasts with that observed for CO formation, where doping does not improve the reaction. To rationalize this trend, we revisit the electronic structures of the isolated HCOO intermediate (Figure 7b) and the corresponding surfaces (Figure 8). Particular attention is given to the frontier molecular orbitals with p-orbital character on the oxygen atom, since HCOO adsorption involves the bonding of one oxygen atom from the intermediate with a transition metal atom on the surface (see Figures S1–S4 in the Supporting Information).
All molecular orbitals located near the Fermi level satisfy this condition. These orbitals appear at higher energies than those governing COOH adsorption, placing them closer to the d-orbitals of Ni, Co, and the transition metal dopants. This energy proximity facilitates stronger orbital hybridization with surface metal atoms compared to the COOH case. Consequently, transition metal dopants can more effectively tune the strength of HCOO adsorption, thereby promoting the reaction pathway for HCOOH formation.
Discussions
HER vs CO2RR
In earlier studies, we discovered that the transition metal site is not necessarily the most stable for hydrogen atom adsorption (Blaylock et al., 2009; Nuruddin et al., 2023). As a result, determining the most stable adsorption site for H is critical before estimating the HER limiting potential on the NiCoPO(100) systems. The parameters for the most stable H adsorption on NiCoPO(100) and NiCoPO(100)-M surfaces are shown in Table 4 and Figure 12. According to the computed results, the O top site has the strongest H adsorption energy for all the surfaces, implying that the HER process will take place primarily at these O sites. In general, it can be observed that the UL values for the HER process on NiCoPO(100) and NiCoPO(100)-M surfaces are very low. This indicates that the HER process is prone to occur on those surfaces.
Geometries of the most stable H adsorption on the O site of (a) NiCoPO(100), (b) NiCoPO(100)-Mn@Ni, (c) NiCoPO(100)-Fe@Ni, and (d) NiCoPO(100)-Cu@Ni surfaces.
Table 5 H adsorption sites, adsorption energy, and HER limiting potential L HER on NiCoPO(100) and NiCoPO(100)-M surfaces.
| System | Site | 𝐇 𝑬𝐚𝐝𝐬 (eV) | 𝐇𝐄𝐑 (V) 𝑼𝐋 |
|---|---|---|---|
| NiCoPO(100) | O@Ni | -0.26 | -0.02 |
| NiCoPO(100)-Mn@Ni | O@Ni | -0.11 | -0.18 |
| NiCoPO(100)-Fe@Ni | O@Fe | -0.07 | -0.22 |
| NiCoPO(100)-Cu@Ni | O@Ni | -0.46 | -0.17 |
To investigate the effect of doping on the selectivity between HER and CO2RR, it is essential to examine the difference in UL values for these processes at the active surface sites under study. Figure 13a illustrates the difference in UL for HER and CO2RR to CO (ΔL [CO−HER] ). Although it was previously noted that doping barely reduces the UL value for CO formation (Table 3), the addition of dopants can slightly shift the selectivity between CO and HER for the NiCoPO(100)
surface. It is generally observed that the ΔL [CO−HER] value at the Ni site decreases with the introduction of transition metal doping, particularly with Cu. This suggests that doping can slightly enhance the selectivity toward CO formation, even though it does not significantly reduce the UL for CO formation.
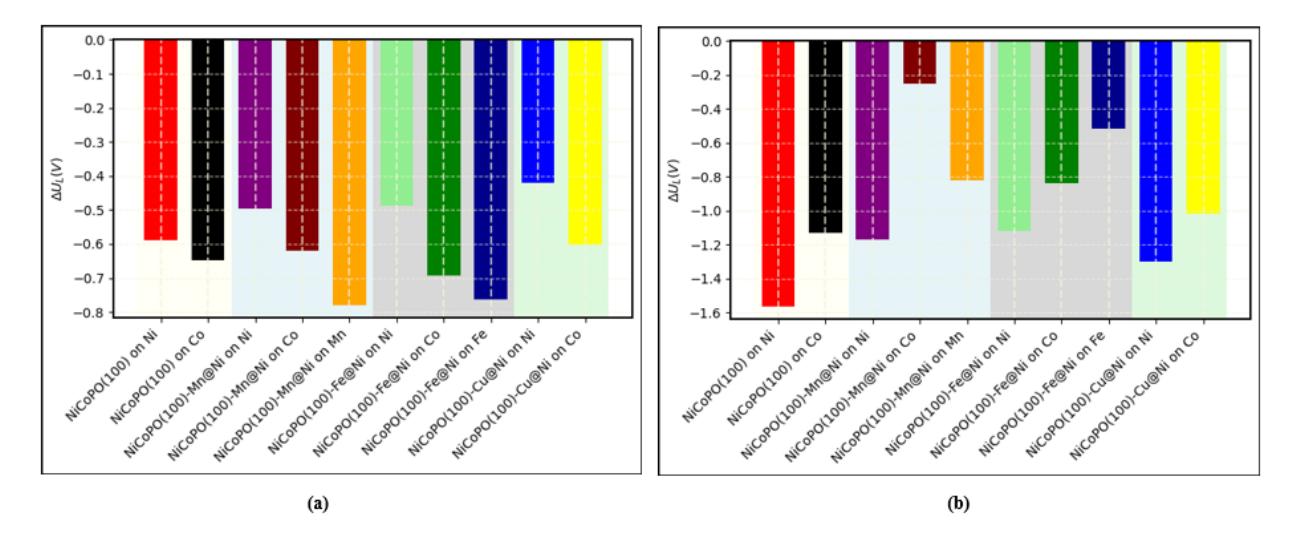
Graph of (a) ΔUL (CO-HER) and (b) ΔUL (HCOOH-HER)
Figure 13b presents the difference in UL for HER and CO2RR to HCOOH (ΔL [HCOOH−HER] ). In this case, a more pronounced effect is observed compared to the CO formation scenario. Transition metal doping significantly shifts the ΔL [HCOOH−HER] of the NiCoPO(100) surface, indicating that, in addition to enhancing CO2RR activity for HCOOH by reducing the UL, doping also shifts the selectivity of the system toward HCOOH formation. An interesting feature is observed at the Co site of NiCoPO(100)-Mn@Ni, where ΔL [HCOOH−HER] reaches approximately -0.25 V. Although this still does not completely suppress the HER process, the inclusion of Mn doping significantly shifts the preference from HER toward CO2RR for HCOOH formation on the NiCoPO(100) surface. Furthermore, as previously mentioned, the UL for HCOOH formation in the Mn-doped case is much lower than the UL for CO formation on the pure NiCoPO(100) surface, indicating a shift in selectivity from CO to HCOOH formation. Therefore, Mn doping is expected to enhance both the activity and selectivity of NiCoPO(100) for HCOOH production.
Conclusion
We have investigated the activity and selectivity of CO2RR to CO and HCOOH on pure and transition metal-doped NiCoPO(100) surfaces using DFT-based calculations. Our findings indicate that doping with transition metals through substitutional defects can influence the trend of limiting potentials for the CO2RR process. In general, transition metal doping (Mn, Fe, and Cu) does not significantly alter the CO formation activity compared to the pure NiCoPO(100) surface. However, these dopants substantially enhance the CO2RR activity toward HCOOH production.
Interestingly, although the limiting potential for HCOOH formation is generally higher than for CO, suggesting that most NiCoPO(100) catalysts favor CO production, an exception is observed in the case of Mn doping. Here, the CO2RR process energetically favors HCOOH formation over CO. Furthermore, while the majority of pure and transition metal-doped NiCoPO(100) surfaces struggle to suppress the parasitic HER process, Mn doping significantly shifts the energetic preference closer to HCOOH formation, reducing HER interference. These findings show that Mn-doped NiCoPO(100) catalysts provide an alternative pathway within Ni-based catalyst, where HCOOH emerges as the main product rather than CO.
Acknowledgement
We acknowledge the Ministry of Higher Education, Science, and Technology of the Republic of Indonesia for financial support through the "Penelitian Dasar 2025" program under contract no. 305/IT1.B07.1/SPP-DRI/V/2025. Some of the calculations were performed using the High-Performance Computer facility at the Research Center for Nano sciences and Nanotechnology, Institut Teknologi Bandung.
Compliance with ethics guidelines
The authors declare they have no conflict of interest or financial conflicts to disclose.
This article contains no studies with human or animal subjects performed by the authors.