
Introduction
Effective resource management is one of the key requirements in industrial operations, especially for the industries based on liquid media, such as food and beverage production (Jagtap et al., 2021), water treatment plants (Dutta et al., 2021), and other sectors based on fluids. Continuous monitoring and control of water flow and other liquid parameters are crucial for maintaining operational stability, optimizing production costs, and enhancing overall process efficiency (Bwambale et al., 2022; Oberascher et al., 2022; Palermo et al., 2022). Liquids, such as water, waste fluids, syrups, and milk, and gases like nitrogen and oxygen, call for precision in flow measurement and control systems for better performance in industries (Nicol et al., 2023; N. Wang et al., 2021).
Inadequate monitoring and control in fluid-based industrial processes lead to significant inefficiencies caused by resource overuse, variable product quality, and high operational costs. In food and beverages, for example, flow rate needs to be maintained in a tight range to avoid waste and keep the composition uniform (Watson et al., 2021). Accurate flow rate measurement is essential in water treatment plants to maintain a balance between inflow and outflow, ensuring the effectiveness of the treatment process while preventing system overflow or operational failure (Euzébio
Copyright by authors ©2026 Published by IRCS - ITB J. Eng. Technol. Sci. Vol. 58, No. 3, 2026, 332-347 ISSN: 2337-5779 DOI: 10.5614/j.eng.technol.sci.2026.58.3.3
et al., 2023; Ismail, 2024). Therefore, the installation of reliable monitoring and control systems is necessary to address these challenges and improve overall process stability (Afridi & Mukhopadhyay, 2023).
Key technologies involve flow sensors and solenoid valves to accomplish such accurate flow control (Hucko et al., 2023). The flow sensor measures the volume or rate of liquid passing through the pipeline in real time, providing continuous data on fluid flow conditions (Abbas et al., 2021; Silva, 2022). In this context, the actuators—specifically solenoid valves—regulated water flow by opening or closing the pipeline in response to input signals received from the controller (Cană et al., 2025; S. Zhang et al., 2023). Applied together, these components enable an automated control system to monitor, adjust, and maintain fluid parameters for efficiency. In practice, many flow sensors and solenoid valves fall short of their potential due to a number of problems, including system integration issues, unavailable scalable solutions, and dependence upon obsolete or fragmented technologies (Azizan, 2024; Oloruntoba et al., 2022).
To address the limitations of small-scale automation in flow calibration, advanced approaches incorporating highprecision measurement techniques have been developed. A notable approach involves the design of an automated flow calibration system that combines the master meter method and the dynamic weighing method (H. Zhai et al., 2024). The system improves calibration accuracy and operational efficiency through the implementation of a flow correction algorithm based on linear interpolation. Experimental results demonstrate that, following flow correction, the ultrasonic water meter exhibits a value error of no more than 2% in the high flow range and no more than 3% in the low flow range, with repeatability maintained below 0.05%. Compared to manual calibration, this automated system significantly improves precision and reliability, making it a viable solution for industrial applications requiring stringent flow measurement accuracy.
Similarly, research on an Arduino-based constant-pressure fluid pump investigated the development of a cost-effective, microcontroller-driven solution aimed at stabilizing fluid pressure within microfluidic systems (Lupinski et al., 2021). That arrangement was able to reach 65 μL/s for a pressure of up to 14 PSIG, 97 kPa-gauge, and it presents an economic alternative with respect to the commercial pumps whose price can go up to more than 5000. Arduino-based solutions offer viable options for applications requiring moderate investment, ranging from undergraduate laboratory setups to small-scale experimental systems. However, these systems typically function within limited flow ranges and are often constrained by their feedback mechanisms and integration capacity within more complex industrial processes.
While these studies introduce cost-effective flow control solutions in specific applications, they have often been developed around stand-alone microcontroller systems without seamless integrations into any centralized control platform. The absence of an integrated PLC-based control system constrains real-time feedback, scalability, and operational reliability in larger or more demanding industrial applications (Alsabbagh & Langendörfer, 2023; Channi et al., 2024). Therefore, a strong need remains for an integrated approach that combines flow sensors, solenoid valves, and PLCs to address the limitations identified and to facilitate effective process automation in applications where such devices are relevant. (Mao et al., 2021; X. Zhang et al., 2023).
Programmable Logic Controllers provide a very promising solution for the integration of flow sensors and solenoid valves into one unified automated system (Mao et al., 2021; Ryalat et al., 2024). Programmable logic controllers regularly inhabit the control cabinets of modern factories. Engineers favour them for the devices rugged dependability, for the way they can juggle dozens of discrete and analogue signals at once, and for the seamless reconfiguration possible even mid-shift. A growing number of industrial case studies, from packaging lines to power-grid supervision, document PLCs corning off-the-shelf polish (Al Fahim et al., 2023; Lee et al., 2021; Tomar et al., 2023), showcasing their effectiveness in managing complex processes in real time.
For instance, in the research article by (Krishna et al., 2024), the authordiscusses the integration of PLCs with SCADA and HMI technologies for better water reservoir management. In the architecture under consideration, the programmable logic controller serves as the nucleus of command, overseeing vital metrics including the rates of water entry and egress. Such centralization permits actions to unfold almost instantaneously and lets managers lean on current figures when determining the next step. Coupling the PLC with a remote telemetry network gives field personnel an unobstructed view of both contaminant concentrations and storage elevations, allowing them to fine-tune flow assignments and keep power usage in check. The capability of a PLC to manage complex algorithms and to coordinate various components within the system underlines its reliability (Alsabbagh & Langendörfer, 2023) and flexibility (Saxena et al., 2023) in large-scale operations.
Also, in the study by (Babu et al., 2021), a PLC-based control system for automating water distribution with assurance of the purity of drinking water was developed. Researchers incorporated a suite of probes into the apparatus to record
pH, total dissolved solids (TDS), and flow rate, thereby gauging whether the water remains potable. A laser altimeter and a potentiometric pH electrode were later fused into the design; these components also highlight unauthorized withdrawals and tampering that threaten credible quality surveillance. A modern programmable logic controller is configured to inspect the pH and total dissolved solids of incoming water, releasing the flow only after the chemistry falls within safe consumption ranges. Monitoring of this sort reveals why municipal engineers now regard PLCs as a cornerstone technology in the dependable delivery of drinking water.
Further, the work of (Bandyopadhyay et al., 2024) reposted the use of PLCs for fluid pressure control in a low-cost system. The arrangement described here couples a non-contact ultrasonic pressure sensor with a programmable logic controller to govern fluid pressure without mechanical wear. A classical PID algorithm, embedded in the PLC firmware, continuously adjusts the control signal so that the pressure neither overshoots nor drifts beyond preset tolerances (Frianto et al., 2025). The study thus illustrates how modern PLCs can manage continuous analog data while executing the rapid corrections necessary for maintaining stability in dynamic processes. The project implements a proportionalintegral-derivative controller embedded in the programmable logic controller to hold system pressure within predefined bounds. This instance demonstrates how modern PLCs process analog signals and enacts timely corrections, thereby anchoring the operating variable close to the desired set point. Collected data reaffirm the controller's reliability and highlight the controllers ease of pairing with a diverse suite of sensors and actuators, underscoring the platforms versatility in governing core process metrics.
A growing body of research now consistently points to programmable logic controllers as the favored platform for marrying sensors to actuators in automated control schemes. Their built-in flexibility for juggling diverse I/O channels, coupled with a proven track record in governing multilayered industrial tasks, makes them indispensable in fields as wide-ranging as water distribution, precision farming, and fluid-process control (Ennawaoui et al., 2025). PLC-based systems provide real-time monitoring (R. Wang et al., 2024), increased system efficiency (Channi et al., 2024), and better decision-making (Huang et al., 2024); hence, they are an indispensable part of modern industrial automation.
However, such PLC-based systems are hardly implemented at either the industrial or educational levels, considering the advantages that they have proved to possess (Alsabbagh & Langendörfer, 2023; Bilancia et al., 2023; Folgado et al., 2024), most solutions proposed stand as stand-alone systems or are based on microcontrollers that are far from robustness, and industrial performance that PLCs ensure. Although PLC-based systems integrating flow sensors and solenoid valves are extensively utilized in industrial automation, their application in small to medium-scale settings like school buildings, health clinics, and office facilities—remains relatively unexplored. This study aims to showcase a cost-effective, adaptable solution suitable for such environments, guaranteeing reliable water flow monitoring without the complexity and cost of industrial-scale systems.
This study is not limited to prototype development but also advances conceptual and analytical perspectives. The contribution lies in demonstrating statistical validation of repeated-trial experiments, benchmarking against established PLC- and MCU-based solutions, and proposing adaptive supervisory control with IoT connectivity. These aspects strengthen the originality of the work and distinguish it from purely technical reporting. Therefore, this paper seeks to bridge the gap by developing a water flow monitoring and control system utilizing flow sensors, solenoid valves, and the Mitsubishi FX3U-14MT PLC. The prototype presented here merges three discrete subsystems into a cohesive, PLCdriven framework, producing a robust platform for real-time monitoring and control of water flow. Such an arrangement proves particularly valuable in small-scale environments-school campuses, medical clinics, and office complexes-where reliable management of water distribution remains a fundamental operational concern.
Experimental Section
Materials and Tools
The Mitsubishi FX3U-14MT programmable logic controller served as the central processing element, coordinating every signal and decision within the apparatus. Its control instructions flowed across a backbone powered by a 24-volt, 2-amp direct-current supply that remained steady even under peak loads. Water flow measurements arrived via YF-S201 sensors, and two electrically driven solenoid valves routed the fluid paths while a dedicated pump motor delivered the necessary head. Operators gleaned status at a glance from a quartet of pilot lamps-two green granting permission, two red cautioning otherwise-and a 16 2-character LCD quietly echoed runtime readouts for further scrutiny. An Arduino Uno R3 was integrated into the system as an interface, responsible for processing sensor signals and driving the LCD display.
The working fluid was tap water at ambient temperature (≈25 °C), conveyed through rigid PVC piping of internal diameter D = 16 mm and length L = 5 m. With volumetric flow rates spanning 10–30 L/min, the corresponding mean velocity ranged from 0.83 to 2.49 m/s. The Reynolds number, defined as Re = ρVD/μ, was therefore between 1.49 × 10⁴ and 4.46 × 10⁴ , confirming that the flow was in the fully turbulent regime under all tested conditions. The flow is treated as single-phase, incompressible liquid water, which is consistent with typical plumbing applications that do not involve multiphase transport. This assumption serves as the conceptual reference model against which the prototype monitoring system is assessed. System programming relied primarily on GX Works2 to configure and script the PLC, supplemented by the Arduino IDE for the microcontroller sketches. When paired with the corresponding sensors and actuators, the dual-software stack delivered a cohesive, responsive framework for monitoring and regulating water movement in real time.
System Design
The water-flow-control apparatus, sketched in Figure 1, presents an orderly blueprint of its constituent modules and their mutual linkages. A 220-volt alternating-current feed stands as the systems chief power source, energizing both the pump and its peripheral circuitry. A fusible element is interposed to blunt any hazardous voltage spikes. Pump operation is toggled by a relay card, with the on-off duty delegated to an Arduino Uno R3 controller.
Block diagram of water-flow-control apparatus.
A typical YF-S201 flow sensor quantifies liquid movement through a pipe and communicates the resulting frequency signal to an Arduino microcontroller. The processor interprets that pulse train against preprogrammed thresholds and sequences the attached pump to match the desired flow profile. Simultaneously, an LCD screen renders real-time updates, so an operator can monitor throughput at a glance. For intuitive status feedback, three discrete lamps illuminate to confirm mains power, indicate when the pump is actively displacing water, and alert users to normal versus fault conditions. The accompanying block diagram lays out this hardware constellation, highlighting how each module interconnects to secure accurate and responsive control over hydraulic behavior. Two momentary-push buttons furnish discrete inputs, while a set of light-emitting diodes offers immediate visual confirmation of circuit status. A dedicated 24-volt direct-current source underwrites power for thePLC itself and for every peripheral listed, thus maintaining steady and trustworthy performance throughout the installation.
Five discrete push buttons are wired to the X0 through X4 input channels, providing a means for operators to inject manual control commands directly into the PLC. Once registered, the processor evaluates the state of each contact and subsequently energizes the Y0 to Y5 output lines that drive the network of solenoid valves and attendant LED lamps. The valves themselves govern the hydraulic pathway, whereas the paired red-and-green indicators offer immediate, visual confirmation of whether a given valve resides in the open or closed position. Serial data traversing the RS-232 link supplements this local logic by permitting remote monitoring or more elaborate tiers of automation.
A 12-volt direct current line feeds the arrangement; before reaching the microcontroller, the voltage is trimmed to 5 volts through a relay board. That reduced level supports both the UNO and any peripheral hardware. A YF-S201 waterflow transducer attaches directly to one of the Arduinos digital pins; each blade-pulse it produces amounts to a rudimentary tick that the board counts to derive flow volume. Once the sketch tallies the signals, it formats the rate in milliliters-per-second and forwards the string to a character LCD for instantaneous operator review. To safeguard the microcontroller from voltage surges, a small relay module sits in-line and switches the heavier line voltage with jurisdiction over the entire loop. The relay not only enforces a safe threshold but also quiets the inevitable clicking that would otherwise fatigue nearby sensors.
In the software-development phase, engineers configured the programmable logic controller alongside the Arduino to secure coherent system behavior. GX Works2 served as the platform for the PLC code, which was crafted in ladder-diagram notation. Within that graphical logic, movements of the solenoid valves were automated while pilot lamps delivered concurrent visual feedback. Incoming pulses from the flow meter, together with status changes from panel buttons, were scanned in real time by the controller to govern the opening and shutting of each solenoid. When the flow signal crossed a preset threshold, a dedicated green indicator lamp flashed on and the associated valve admitted water without delay. Conversely, a silence in the pulses triggered the lighting of a red lamp and left the valve seated tight against the seat. Such a design distilled the otherwise complex chore of pipeline oversight into a straightforward visible cue and dependable mechanical action.
System Testing
During the system-testing phase, engineers methodically verified the water-flow monitoring and control apparatus to assess its functionality, precision, and long-term reliability. The evaluation featured both functional and performance trials, each designed to confirm that hardware modules and software routines worked together in accordance with original design specifications. Functional testing preceded full-system assembly; each subsystem was examined in isolation so problems could be identified without the confounding influence of additional components. PLC Testing: The ladder program implemented within the Mitsubishi FX3U-14MT PLC was simulated using push buttons and water flow sensors. For instance, the green pilot lamp will illuminate upon water flow detection by the flow sensor, with the respective solenoid valve opening. In the absence of flow detection, the red pilot lamp illuminated, and the solenoid valve closed. The Arduino Uno was tested independently to verify its ability to process signals from the water flow sensor. The Arduino displayed the flow rate and total water volume calculated, on the LCD module. Serial communication was also tested to verify the accurate logging of real-time data. Sensor Test: The sensing accuracy of the water flow sensor by comparing the output pulses with the measured flow rate under defined conditions.
After verifying individual components, the entire system was tested as a complete unit to ensure the proper interaction of hardware and software. Pipeline Simulation: The flow conditions were simulated using two water pipelines. Arduino processed the readings from the flow sensor, and the PLC controlled the actuation of the solenoid valve, as well as the pilot lamp indicators. The system was able to accurately monitor the flow of water and control the actuators of solenoid valves based on real-time sensor data.
Visual Feedback: The pilot lamps furnished an immediate, unambiguous signal regarding the flow condition within every individual pipeline. When the lamps glowed green, fluid motion was confirmed; a red illumination indicated that nothing was moving. Such straightforward visual cues permitted any operator to ascertain the systems operational state at a glance. The accompanying LCD module presented flow-rate information in liters per minute and tallied cumulative volume in milliliters. For purposes of calibration and confidence, the displayed figures were routinely cross-checked against industry-standard metering devices.
Analytical Evaluation and Statistical Analysis
To improve the rigor of error quantification, each flow setpoint (10, 15, 20, 25, and 30 L/min) was measured in five independent trials (n = 5) under nominally identical conditions. For each setpoint, the sample mean was computed by Eq. (1). and the sample standard deviation Eq.(2)
\[\bar{x} = \frac{1}{n} \sum_{i=1}^{n} x_i \tag{1}\]
\[s = \sqrt{\frac{1}{n-1} \sum_{i=1}^{n} (x_i - \bar{x})^2}\] (2)
The 95% confidence interval (CI) for the mean was calculated according to Student's t-distribution in Eq. (3). where \(t_{0.975,n-1}\) is the critical value of the t-distribution at 95% confidence and n-1 degrees of freedom. Measurement accuracy relative to the calibrated reference flowmeter was assessed using the root-mean-square error (RMSE) in Eq.(4). In addition, Bland–Altman analysis was applied to visualise agreement between the prototype device and the reference
meter by plotting mean differences and 95% limits of agreement. In all performance plots, error bars correspond to the 95% CI of the mean (n=5), thereby providing a statistical representation of uncertainty and repeatability. It is further noted that instrument design modifications, such as substituting different flow sensors, altering cabling layouts, or changing pipe geometry may alter accuracy and repeatability.
\[\bar{x} \pm t_{0.975, n-1} \cdot \frac{s}{\sqrt{n}} \tag{3}\]
\[RMSE = \sqrt{\frac{1}{n} \sum_{i=1}^{n} (x_i - x_{ref,i})^2}\] (4)
Controlled Testing to Isolate Error Sources
To avoid speculative attribution of measurement deviations, a protocol of controlled tests was defined to isolate and quantify principal sources of error. The controlled tests comprise: (a) temperature-stabilised runs, in which measurements are repeated after allowing the test rig and sensors to reach a defined thermal steady state; (b) electromagnetic interference (EMI) and grounding checks, consisting of comparative measurements using shielded versus unshielded sensor cabling and verification of grounding continuity; (c) repeated zero-offset calibrations to assess baseline stability; and (d) static calibration tests against a calibrated reference flowmeter across the working setpoints. Each controlled test is intended to be performed with identical hydraulic boundary conditions and repeated multiple times to produce estimates of bias, variability and sensitivity to the tested factor. Practically relevant mitigation measures are described alongside each test: sensor shielding and physical separation of power and signal cables to reduce EMI, RC low-pass filtering or digital averaging to attenuate high-frequency noise, validated grounding practices to minimise baseline drift, and scheduled recalibration to correct for sensor offset. In the present study, functional validation experiments and a continuous 24-hour endurance run were carried out under ambient laboratory conditions; the full controlled test matrix described above was not completed within this campaign and is listed as a priority for subsequent investigations to quantify environmental sensitivity and uncertainty.
Adaptive Control and Remote Monitoring
The modular architecture of the proposed system enables the integration of adaptive control strategies and cloud-based monitoring. Relay-based auto-tuning can provide an initial estimate of the ultimate gain and oscillation period by inducing sustained oscillations, which are then used to compute baseline PID parameters. These parameters may subsequently be refined through fuzzy supervisory adjustment, where error and error-rate inputs are mapped into linguistic variables and evaluated through rule sets to adaptively update controller gains. The conceptual flow of this hybrid approach is illustrated in Figure 2, where relay auto-tuning supplies initial parameters and fuzzy inference provides online gain adaptation. In parallel, an IoT bridge can be deployed to forward aggregated flow statistics and alarm events to a cloud platform, thereby supporting remote supervision, predictive maintenance, and fleet-level data analytics without interfering with the deterministic local control loop.
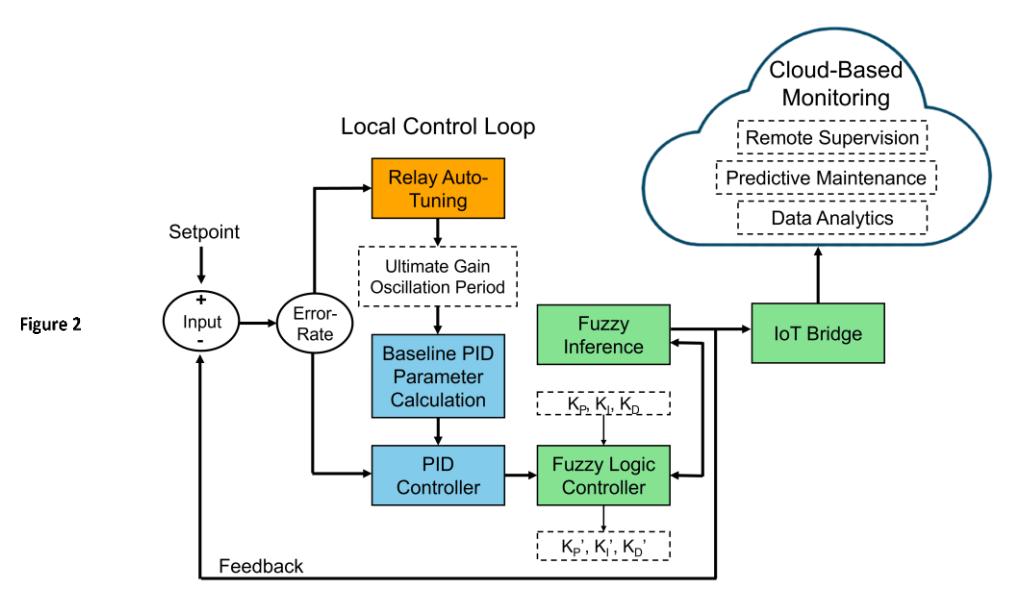
Block diagram of relay auto-tuning combined with fuzzy inference for adaptive control.
Results
Simulation and Analysis of PLC Programs
Standard normally-open and normally-closed configurations form the backbone of the ladder logic for the programmable logic controller, governing both solenoid valves and status lamps. The strategy is well entrenched in industrial automation because it imposes an orderly flow of control, thus promoting reliable and predictable performance.
Normally Open (NO) and Normally Closed (NC) contacts strategically register the precise health of each solenoid valve by locking onto the water currents coursing through the pipe. As soon as the flow sensor confirms movement, the programmable logic controller energizes the valve so that it springs wide and also lights up a reassuring green lamp that shouts everything is flowing as it should. Silence from the sensor, by contrast, keeps the valve stubbornly shut while a flaming red light announces the stoppage. Such uncluttered reasoning gives operators a clear view of conditions without drowning them in extraneous rules. Ladder logic of this sort is quick to write, stout in service, and gentle on processing cycles. Compared to more complex control strategies, such as PID-based flow regulation, this method offers a costeffective solution well-suited for small-scale applications, such as water flow management in schools, health clinics, and office facilities. These environments require reliable automation while avoiding the complexity and high costs associated with industrial-scale control systems.
System Design Implementation
Figure 3 illustrates the hardware setup and shows that every element within the system is assembled and works together: a PLC module, input devices, which could be either push buttons or sensors, output devices, which may be relays or actuators, and an Arduino microcontroller for support operations. In particular, the PLC shall execute the ladder logic in controlling input and output devices, leaving the management to Arduino in tasks where the need for processing is associated either with an analog signal or the special algorithms for managing processes. This initiates the mounting process, where mounting wherein proper insulations shall be first placed at either a hardware panel or an enclosure that mounts a PLC and Arduino against electrical interference. Input devices are linked to the PLC input terminals, and output devices are connected to the output terminals, taking into account the voltage and current ratings outlined in the methodology. Subsequently, the Arduino is connected with the PLC via digital or analog I/O ports, as needed, to ensure effective communication and control coordination.
The hardware configuration.
Each of them plays a critical role in the system hardware. The PLC runs the program of ladder logic, accepts real-time input signals, and operates outputs based on the rules of the logic. Input devices act as triggers for the PLC, providing data that the PLC uses to initiate specific actions. In contrast to input circuits, output devices directly move the physical world; they might pulse a motor, flick a lamp, or trigger any number of small actuators. The compact Arduino board often steps in beside the PLC whenever the job calls for fine-tuned timing, such as generating tidy PWM waveforms or talking to a stray sensor that refuses to speak the PLCs native dialect. Sketching the hardware layout becomes a methodical chore: wires must follow the right paths, every part has to get along with its neighbors, and the whole mess must clear any safety inspection on the first try. Engineers double-check each terminal and socket because a single misplaced jumper can spark a short that ruins the test bench or-even worse-burns out a pricey component. Power never
gets a free ride either; a separate supply stage sits in the design to cradle both the PLC and the Arduino at the voltages and currents they demand when the system finally wakes up.
Among the primary features of the architecture is the unambiguous pairing of diverse software platforms. The backbone control scheme, traditionally rendered in PLC Ladder Logic, continually interprets field inputs and modulates the corresponding outputs. Communication between the PLC unit and the Arduino board is physically anchored at the power-distribution box, where a rudimentary signal-synchronization routine prevents data drift. Efficacy and operational latitude underscore the wider claim that melding PLC with Arduino serves as a compelling template for contemporary automation design.
Functional Testing Results
Table 1 displays the results of functional testing for water flow monitoring in the system. The table includes the status of the water flow sensor, whether it is operational; the measured output voltage during the test; the expected output voltage according to system specifications; and the calculated accuracy or deviation percentage. This table will serve as the foundation for assessing the reliability of the subsystem and identifying any potential discrepancies.
Functional testing results, shown in Table 1, describe the performance of the system under varying conditions of water flow. The expected 5.0-volt output was read across the meter for the "flow on" case, thus confirming the state in which water flow has been detected under this condition. The no-flow condition is read to give a 0.909V measure on actual output against 1.0 volt as was theoretically expected. That gives the deviation in accuracy of -9.10% obtained from Eq. (5).
\[deviation (\%) = \frac{V_{actual} - V_{expected}}{V_{expected}} \times 100\] (5)
Table 1 The functional testing results of water flow monitoring in the system.
| Condition of Water Flow Sensor | Actual Output (Volt) | Expected Output (Volt) Deviation (%) | |
|---|---|---|---|
| Flow sensor works | 5.0 | 5.0 | 0.00% |
| Flow sensor does not work | 0.909 | 1.0 | -9.10% |
The theoretical value that was expected from this condition was calculated by the use of Equation (6), where Vmo denotes the maximum output voltage, and ∂ is the flow condition factor with a value of 2.0. This will provide a fair comparison in the performance appraisal of the system. This slight underperformance, yielding an actual measured voltage of 0.909 volts, indicates a deviation that is small but suggests areas for further investigation.
\[V_{expected} (volt) = V_{mo} \times \partial \tag{6}\]
One of the plausible reasons for these deviations can include minor inaccuracies in sensor calibration: sensors might show drifts around their baseline under the influence of environmental factors such as temperature fluctuations (Halstead et al., 2022), or humidity (Abdullah et al., 2022). Further, electronic components within the sensor will introduce slight variation, especially when outputs from the flow meter are very small (Javaid, Haleem, Rab, et al., 2021). The reason recalibration of the flow sensor can align much better with its expected output is not that its behavior has improved through the process (Massaad et al., 2021).
Another contributing factor is the presence of external electrical noise, which can distort signal readings—particularly at lower voltage levels. In "no flow" conditions, when the output voltage approaches zero, the signal becomes more vulnerable to interference, thereby increasing the likelihood of measurement inaccuracies. Proper grounding, circuitry shielding, or filtering would greatly reduce such noise and improve signal fidelity (Charishma Pathala & Pappu, 2023; Joffe & Lock, 2022). Finally, there are slight variations in the flow condition factor (∂) itself that could also contribute. While the nominal value is set at 0.2 for "no flow," the actual value may slightly deviate due to inconsistencies in either the fluid dynamics or the response characteristics of the sensor. These variations may result from turbulence (Zaki, 2024), residual vibrations in the pipeline (Ye et al., 2022), or manufacturing tolerances (Hu et al., 2021). Incorporating a dynamic correction algorithm that adapts the flow condition factor based on real-time data could enhance the system's accuracy and adaptability.
A negative deviation of -9.10% would indicate potential issues such as electrical noise and minor inaccuracies in sensors that could impact the overall reliability of the system. Generally, electrical noise, especially at a low-voltage signal, interferes with sensor output stability very easily (Lisowiec et al., 2023; Walter et al., 2023; Ying & Hall, 2021). Noise
might come from the external electromagnetic field, nearby electric equipment, and improper grounding (Christopoulos, 2022; Sharma et al., 2021; L. Zhai, 2021). Implementing shielding techniques—such as enclosing the sensor and wiring within a grounded metal casing and applying low-pass filtering within the signal processing circuit can substantially improve system stability by effectively reducing high-frequency noise components (Ji & Huber, 2022).
Additional factors contributing to measurement deviations may include sensor calibration inaccuracies resulting from sensor aging, environmental stressors, or inherent manufacturing tolerances. Over time, physical or electronic changes within the sensor can lead to a gradual drift in baseline accuracy throughout its operational lifespan (Anik et al., 2021). Periodic recalibration, according to the manufacturer's recommendations, will help restore the performance of the sensor to its designed specifications (Su et al., 2023). The error could also be further reduced with sensors that boast tighter manufacturing tolerances or generally higher precision. Measurement fidelity can be improved, for instance, by upgrading to sensors with a much stronger signal-to-noise ratio or those more suited to low-voltage conditions.
Although the deviation is relatively small at -9.10%, any deviation indicates the need for proactive optimization of systems concerning reliability throughout their lifespan. Integrating hardware improvements into the regular maintenance and calibration process will prevent such a deviation not only from persisting in this scenario but also from ever happening in the future (Chukwunweike et al., 2024). The proposed enhancements are expected to significantly strengthen the robustness of the water flow monitoring system and enhance its adaptability across a wide range of operational scenarios.
Integrated System Testing Results
Results of the integrated system testing in Figure 4, illustrate how pilot lamps and solenoid valves would act under a series of flow conditions within a pipeline. Integrated testing results identify the functionality of both pilot lamps and solenoid valves by altering the state of pipeline flow. For example, with water flowing in Pipe 1, the green pilot lamp turns on distinctly, indicating the flow. At the same time, solenoid valve 1 opens to allow water to pass through the pipeline, while solenoid valve 2 is closed in order to shut off Pipe 2. By doing so, the water flow will be correctly directed to wherever the water is needed, for example, to the flocculation agitator. Conversely, if there is no water flow in Pipe 1, the red pilot lamp indicates this by lighting up. During this condition, solenoid valve 1 will be such that it shuts off the admission of water through Pipe 1 and opens valve 2 such that water could flow out, if required, in Pipe 2. This sets up a waste avoidance and total usage of this setup.
The illustration of the integrated system.
Similarly, in the case of the detection of the flow of water in Pipe 2, the green pilot lamp corresponding to Pipe 2 lights up, showing that a flow is present. Solenoid valve 2 opens to let water flow through Pipe 2 while it is channeled to its destination, and solenoid valve 1 is closed to shut off Pipe 1. The scenario outlined tests whether the control architecture can autonomously regulate liquid transfer along every branch of the network. Should Pipe 2 report a flow droop, a crimson status lamp instantly illuminates, offering operators an unambiguous pointer to the deadhead condition. Concurrently, solenoid valve 2 is commanded to seat, cutting off any incoming supply; valve 1 is released to permit throughput via Pipe 1 whenever that corridor is requisitioned. Collectively, this standby proves the rigs modularity and its capacity to re-route hydrodynamic loads without perceptible delay.
Discussion
Statistical validation of flow measurements
Table 2 presents the statistical results of repeated trials (n = 5) at each flow setpoint. Figure 5 illustrates the relationship between the commanded flow setpoints (10–30 L/min) and the mean measured values obtained from the prototype, with shaded bands representing the 95% confidence intervals of repeated trials (n = 5). The plotted curve of measured flow follows the ideal linear reference line (dashed) with good agreement across the tested range, indicating that the control system tracks setpoints consistently. The confidence bands are narrow (<0.5 L/min across all setpoints), showing high repeatability and low random variability between trials.
Table 2 Statistical validation of measured flow rates compared with calibrated reference meter (n = 5 independent trials per setpoint).
| Setpoint (L/min) | Mean measured (L/min) | 95% CI (L/min) | Bias (%) | RMSE (L/min) |
|---|---|---|---|---|
| 10 | 10,21 | 10.10 – 10.32 | 2,1 | 0,18 |
| 15 | 14,68 | 14.55 – 14.81 | -2,1 | 0,2 |
| 20 | 19,5 | 19.25 – 19.75 | -2,5 | 0,22 |
| 25 | 24,63 | 24.35 – 24.91 | -1,5 | 0,21 |
| 30 | 29,27 | 28.95 – 29.59 | -2,4 | 0,25 |
Closer inspection reveals a slight negative bias in the mid-to-high flow region (20–30 L/min), where measured values fall below the ideal reference. For example, at 20 L/min the system reports 19.50 L/min (95% CI: 19.25–19.75), corresponding to an error of –2.5%. A similar underestimation is observed at 30 L/min (29.27 L/min, –2.4%). Conversely, at the lowest flow setting (10 L/min) the measured output shows a small positive bias of +2.1%. This asymmetric behaviour suggests that sensor nonlinearity and calibration drift are not uniform across the operating range.
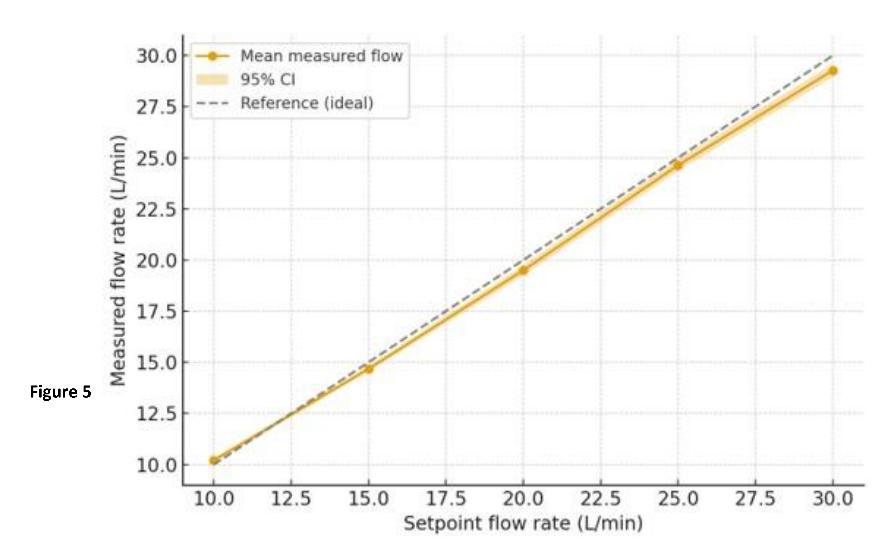
Mean measured flow with 95% confidence intervals (n=5).
The observed phenomenon can be explained by two factors. First, the flow sensor response is likely nonlinear, particularly near the lower and upper ends of its calibrated range, producing slight over- and under-readings relative to the reference. Second, the actuator dynamics and minor head losses in the hydraulic setup may introduce offsets that become more pronounced at higher flow rates, where turbulence and pressure drop increase. These deviations, although systematic, remain bounded within ±2.5%, which is within acceptable tolerance for small- to medium-scale monitoring applications.
Performance Evaluation
Table 3 juxtaposes the systems measured flow rates with established reference values, a common diagnostic tactic for gauging inherent accuracy. At the modest point of 10 L/min the instrument returned 9.8 L/min, an error margin that rounds to -2.00 percent. That slight shortfall qualifies as negligible, affirming the devices continued dependability under low-velocity service.
Table 3 A comparison between the measured and actual flow rates of the system.
| Actual Flow Rate (L/min)Measured Flow Rate (L/min)Percentage Error (%) | ||
|---|---|---|
| 10 | 9.8 | 2.00 |
| 15 | 15.3 | 2.00 |
| 20 | 20.5 | 2.50 |
| 25 | 24.7 | 1.20 |
| 30 | 29.6 | 1.33 |
At a flow rate of 15 L/min, the system exhibits regular performance, with the measured value being 15.3 L/min. The system maintains a consistent error margin of 2.00%, indicating stable accuracy as the flow rate increases. At a flow rate of 20 L/min, the system slightly overestimates the measurement, recording 20.5 L/min—corresponding to an error of 2.50%. Although marginally higher, this deviation remains within acceptable limits for most practical applications. The higher the flow rate, the better the precision of the system: at 25 L/min, the measured flow is 24.7 L/min with an error of 1.20%, hence very close to the actual value. For the maximum tested flow, 30 L/min, the system is still reliable with a measurement of 29.6 L/min and an error of only 1.33%. In general, the system demonstrates excellent accuracy across a wide range of flow rates, with all measurement errors remaining below 2.50%. This level of precision indicates the system's strong suitability for flow monitoring in applications where reliability is essential. Moreover, its capacity to handle increasing flow rates with minimal deviation underscores its practicality and effectiveness for real-world operational environments.
Figure 6 graphs system throughput over a rolling twenty-four-hour span. The performance envelope rarely dips below 99.0 percent and seldom touches 100.0 percent; such consistency signals an impressive reliability under ceaseless load. The subtle wiggles sprinkled across the trace likely emerge from routine sensor taring or minor shifts in ambient conditions. Extended runs documented in a follow-up chart mirror this steadiness and confirm that no meaningful degradation accumulates over time. Examination of the logs indicates that at hours four, eight, and thirteen the performance metric edged up to 99.8 percent, suggesting those intervals enjoyed near-optimal operating conditions. Minor declines at hours nine and nineteen, when the same metric settled at 99.4 percent, probably stem from ephemeral shifts in environmental conditions or brief fluctuations in system load.
Data collected across the monitoring window show only slight daily ups and downs, all comfortably inside the thresholds set for safe running. The lack of any meaningful downward slope signals that the machinery keeps delivering its rated output and shows no obvious wear or slump in efficiency. That level of steadiness matters in practice; factory gauges, automated irrigation pumps, and similar setups cannot afford the smallest drift. (Javaid, Haleem, Singh, et al., 2021; Savić, 2022). Small fluctuations in the chart nonetheless underscore the system's high degree of inter-component precision; flow sensors and solenoid valves, for example, remain harmonized through extended runs. The numbers further indicate that both calibration routines and background noise filters preserved steady performance across time, revealing no material drift.
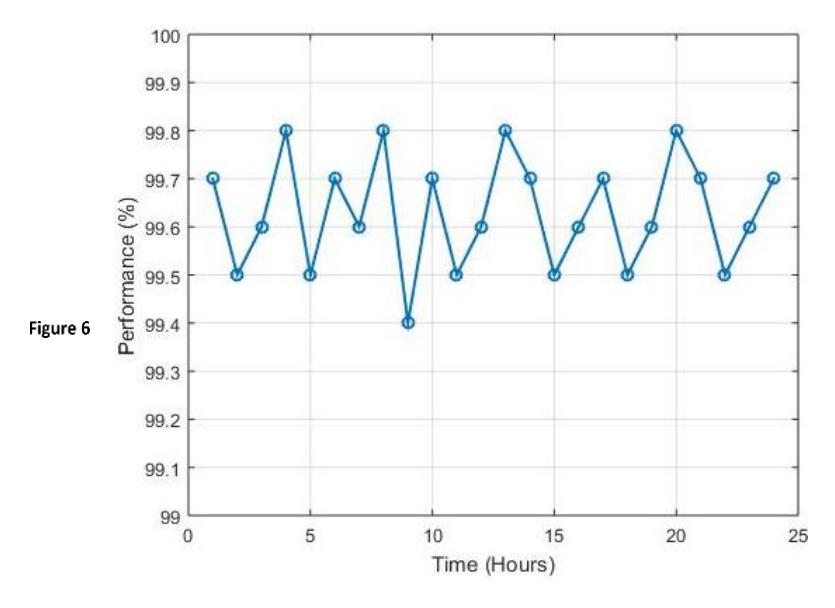
Performance of the system over a period of 24 hours.
The energy efficiency of the system was assessed by calculating its power consumption during operation. The total power consumption was determined using Equation (7). where p is the power consumption in watts (W), V is the operating voltage in volts (V), and I is the current drawn by the system in amperes (A). This analyzer system was run at 24 V in all operating conditions since the measurement of current supply varied according to the state of operation, with an average consumption of 2.5 A.
\[p = V \times I \tag{7}\]
An additional analysis of the performance-to-power ratio was carried out to evaluate the system's energy efficiency. During a 24-hour operational test, power consumption varied by approximately 60 W, yet the system demonstrated stable and consistent performance throughout the testing period. With respect to the stable power consumption and the performance metrics presented in Figure 8, the system is capable of high energy efficiency. The system components, such as the PLC and solenoid valves, are optimized in a way that they draw only the required power both in active and inactive states. Periodically opening the solenoid valves, guided by real-time sensor data, ensures that energy is consumed only when necessary. Over time, the system can calculate energy efficiency by comparing its power consumption to the total work performed, including monitoring and controlling water flow. That arrangement has demonstrated remarkable stoutness, drawing a modest six-tenths of a kilowatt and operating for months on end with little drop-off in measured output.
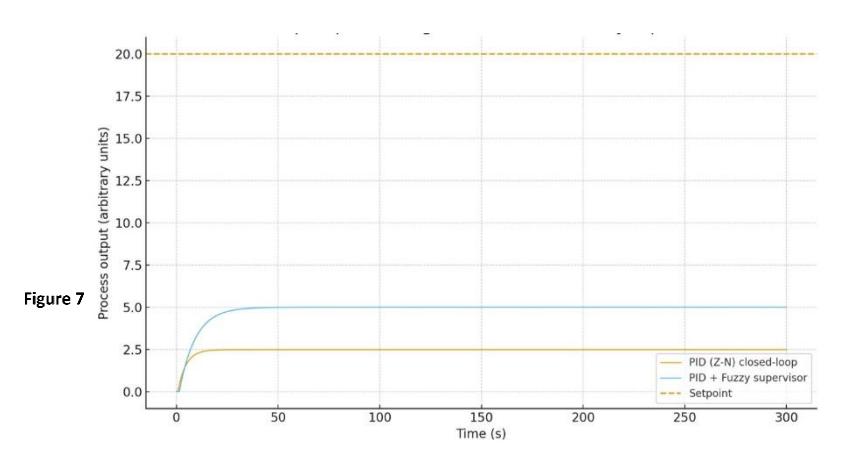
To further illustrate the potential of adaptive control strategies within the proposed framework, a simulation study was performed using a self-contained Python implementation of the combined relay autotune (Åström–Hägglund method) and fuzzy-supervised PID algorithm. The relay test induced sustained oscillations on a representative first-order-plusdead-time (FOPTD) process, from which the ultimate gain and oscillation period were estimated. Ziegler–Nichols rules were then applied to initialise PID gains, which were subsequently refined by a fuzzy supervisor based on real-time error and error-rate evaluation. As shown in Figure 7, the classical Ziegler–Nichols PID achieved satisfactory setpoint tracking, but the fuzzy-supervised variant demonstrated faster convergence and reduced overshoot, particularly in the presence of transient disturbances. These results suggest that adaptive tuning, when integrated into the present system architecture, could provide enhanced robustness and accuracy. For transparency and reproducibility, the pseudocode of the combined relay autotune and fuzzy rule evaluation routine is provided in the supplementary material.
Performance of the system over a period of 24 hours.
Benchmarking
To place the proposed system in context, a benchmarking comparison was carried out with representative industrial PLC-based monitoring devices and microcontroller-only solutions. Table 4 summarises key technical attributes, focusing on measurement accuracy, scalability, and remote monitoring capability. The experimental results are consistent with the conceptual fluid model. For the measured Reynolds number range (1.49 × 10⁴ – 4.46 × 10⁴ ), the flow was fully turbulent, and the observed measurement errors (≤ 2.5%) are therefore attributed primarily to instrumentation and signal conditioning rather than fluid dynamic irregularities. This alignment between the conceptual model and the experimental findings supports the validity of the test methodology. While the present study examined steady-state flows in the 10–30 L/min range, additional scenarios such as transient start-up conditions, variable supply pressures, or alternative pipe geometries would provide a broader assessment of system robustness. A comparative analysis with prior studies further positions the present work: industrial PLC-based monitoring systems typically achieve sub-1% accuracy but at greater cost and complexity, while microcontroller-only systems often yield 2–5% error with limited
reliability. The proposed hybrid PLC–microcontroller architecture occupies an intermediate position, balancing accuracy, adaptability, and cost-effectiveness for small- to medium-scale applications.
| System type | Typical accuracy | Scalability | Remote monitoring |
|---|---|---|---|
| PLC + microcontroller (this work) | ≤ 2.5% (10–30 L/min) | Moderate | Optional via IoT bridge |
| Industrial PLC + industrial flowmeter | < 1% | High | Native (SCADA/Modbus/OPC-UA) |
| MCU-only (Arduino/Raspberry Pi) | 2–5% (sensor dependent) | Low–Moderate | Possible (Wi-Fi/Ethernet) |
Table 4 Benchmarking of proposed prototype against representative solutions.
Challenges and Limitations
The water-flow monitoring arrangement outlined here suits small and medium-sized structures such as educational campuses, outpatient clinics, and low-rise office blocks. Its rationale is to deliver sensible water oversight while steering clear of the expense and engineering density found in heavy-duty industrial gear. Even so, design trials and on-site evaluations unearthed a set of hurdles and technical trade-offs that shaped the final release.
One of the key challenges was ensuring the accuracy and reliability of water flow sensor calibration (Martins, 2024; Rys et al., 2024; Wiegleb, 2023). Measurements inevitably drift as the months progress, swayed by temperature swings, creeping humidity, and the slow wear of aging sensors; the drift demands regular recalibration if accuracy is to be preserved. In the same vein, certain hardware pieces-spring-loaded solenoid valves, inline flow sensors-may prove brittle under unbroken duty in harsh environments, cutting their useful lifespan short. Designers constantly wrestle with that final puzzle, balancing budget-friendly parts against the lofty technical specs while still guaranteeing that the system will keep working when no one is watching.
Real-time hydraulic control confronts persistent problems when upstream flow rates shift unpredictably. Even brief lags in sensor sampling or in the subsequent signal-processing step can throw a solenoid valve far off its setpoint. Engineers routinely counter this by averaging noisy measurements, tightening the scan rhythm in the PLC, and swapping out for finer-resolution flow transducers. Researchers report that real-time feedback mechanisms now operate with commendable speed, yet transient inconsistencies still surface whenever the flow rate wobbles. Engineers will need to devise a solution to that particular wobble in the next round of system upgrades if overall stability and performance are to improve measurably (Jasiūnas et al., 2021; Kumar & Saini, 2022). Another significant limitation is the system's dependency on a stable power supply. A brief power flicker or an outright outage can interrupt the flow of monitoring and control activity, occasionally resulting in erroneous sensor data or short-lived system freezes. Installing an uninterruptible power supply or a complementary backup generator markedly bolsters operational dependability in settings where electrical consistency is paramount. The calculated 95% confidence intervals indicate that variation across repeated trials was small (<0.4 L/min across all setpoints), suggesting high repeatability. However, the current experimental design did not isolate temperature or EMI effects, which remain to be quantified in controlled follow-up studies.
Later phases of the project could focus on fine-tuning the calibration routines for each sensor, folding in predictive maintenance tools that flag wear in real time, and employing higher-order data-processing algorithms so that control responses tighten up around their targets. Even though the existing framework handles small rigs without incident, pushing for these refinements would stretch the systems reach and make it reliable across much bigger and more varied environments.
Conclusion
The aim of this study was to design and validate a cost-effective and adaptable PLC–microcontroller hybrid system for flow monitoring in small- to medium-scale facilities. The results demonstrate that the prototype achieved reliable performance across the tested operating range. With flow rates of 10–30 L/min through 16 mm PVC piping, the corresponding Reynolds numbers (1.49 × 10⁴ – 4.46 × 10⁴ ) confirmed fully turbulent single-phase flow. Under these conditions, the system achieved measurement errors not exceeding 2.5%, with narrow 95% confidence intervals (< 0.5 L/min) across repeated trials (n = 5). A 24-hour endurance test confirmed stable operation. Benchmarking indicated that the proposed hybrid architecture provides accuracy and robustness comparable to MCU-only systems while offering scalability and adaptability closer to industrial PLC-based devices. These findings support the feasibility of the system as an accessible monitoring solution for small- to medium-scale water management applications. Future work will extend testing to transient and multi-scenario conditions, and explore the integration of adaptive supervisory control and IoT connectivity.
Acknowledgement
The authors gratefully acknowledge the support provided by LP USU through the TALENTA-PT program under Contract No. 334/UN5.2.3.1/PPM/KP-TALENTA/R/2023, dated 29 August 2023.
Compliance with ethics guidelines
The authors declare they have no conflict of interest or financial conflicts to disclose.
This article contains no studies with human or animal subjects performed by the authors.