
Introduction
Due to their high compressibility and low bearing capacity, soft soil deposits pose substantial challenges for infrastructure development, particularly in highway construction (Lu et al., 2018). According to Tinjum and Schittone (2001), these soils often result in significant settlement and instability, requiring ground improvement techniques to ensure the long-term performance and safety of structures.
In northern Banten Province, Indonesia—where soft clays are frequently found—conventional ground improvement techniques such as preloading or surcharge may be ineffective due to limited consolidation behavior and low secondary compression indices (Han, 2015). Without proper ground improvement, embankment construction on such soils can result in excessive settlement and structural instability. Rigid inclusions, particularly Mortar Column Inclusions (Inklusi Kolom Mortar or IKM), have become a cost-effective alternative to other conventional ground improvement methods. A Load Transfer Platform (LTP) facilitates efficient load transfer to the columns through soil arching (Bo et al., 2017). It also reduces differential settlement, optimizes load distribution, and improves embankment performance. The addition of geotextiles further increases load-transfer efficiency in the IKM system (Van Eekelen et al., 2013).
2PT Promisco Sinergi Indonesia, Jalan Cigadung Raya Timur 144, Bandung 40191, Indonesia
3PT. ADHI KARYA (Persero) Tbk., ADHI TOWER, Jalan MT Haryono No. 27, Jakarta 13630, Indonesia
Numerical modeling using Finite Element Methods (FEM) plays an essential role in predicting the behavior of such reinforced systems. Embedded Beam Row (EBR) elements offer a simplified geometry and effective soil-structure interaction formulation, making them a common choice for simulating rigid inclusions (Sluis, 2012). However, because EBR elements lack physical geometry and are limited in their ability to capture arching effects at the column head, accurately representing load transfer mechanisms remains a significant challenge (Marjanović et al., 2016; Goudar & Kamatagi, 2022). Furthermore, according to Van der Kwaak (2015) and Smulders et al. (2019), the conventional EBR model is unable to realistically represent lateral column behavior, particularly in soft soils where lateral soil resistance is crucial for determining column-soil interaction. These shortcomings in the physical geometry and lateral behavior representation of EBR elements often fail to accurately represent the actual load distribution and deformation patterns, leading to differences between expected and actual performance. As a result, advanced models are required to evaluate the efficiency of ground improvement and to predict its performance under various loading conditions (Nweke & Pestana, 2018). Enhancing the model by integrating additional plates and defining lateral capacity limits to overcome the limitations of EBR as a column-element model can be considered a contribution to the body of knowledge of engineering practice analysis.
This study aims to provide a more accurate representation of how the IKM interacts with the surrounding soil, particularly in the lateral direction, and to enable more precise simulations of arching mechanisms. The study examines a real-world situation from the Serang-Panimbang Toll Road Project (STA 75+600 to STA 75+800), where the subgrade consists of slightly overconsolidated soft silty clay. The embankment height reaches up to 6.8 meters (Figure 1), and the IKM ground improvement is arranged in a grid with spacing optimized through preliminary design calculations. Finite element analyses are conducted using PLAXIS 2D and 3D. Field monitoring data are used to validate the numerical findings and evaluate the efficiency of the proposed model enhancement.
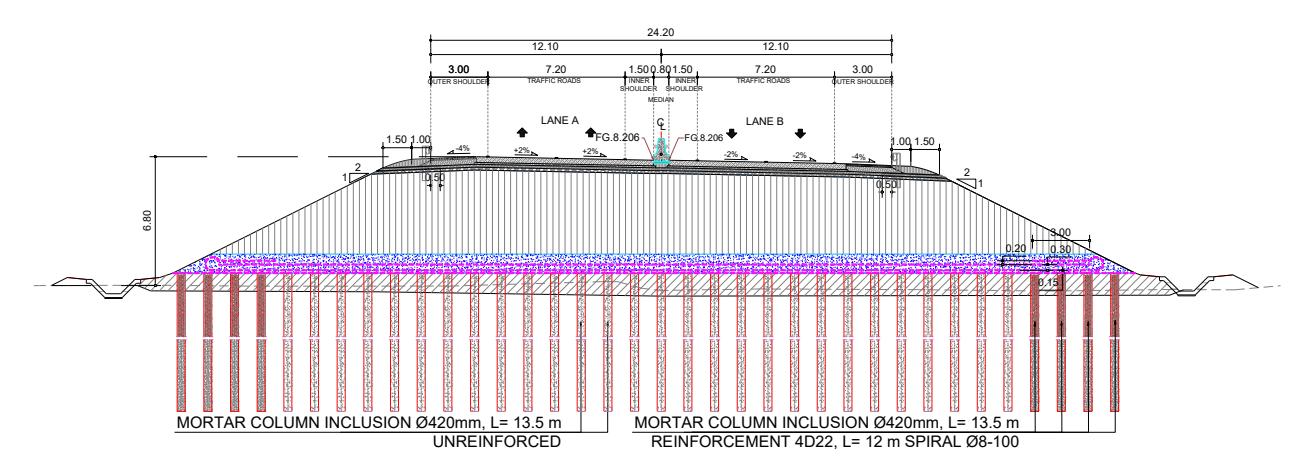
Figure 1 Cross-section of the embankment of the Serang-Panimbang Toll Road Project STA 75+600 to STA 75+800 (PT. ADHI KARYA (Persero) Tbk., 2024).
Methodology
A finite element numerical analysis is conducted to obtain a more comprehensive understanding of soil behavior and the response of the IKM ground improvement system supporting the embankment. This approach provides a more realistic model of geotechnical conditions, accounting for the interactions among soil, structural elements, and loads. The analysis is carried out in separate different model scenarios to evaluate several technical aspects of the IKM system through PLAXIS 2D and 3D finite element softwares as follows: vertical and lateral stress distribution at the column head, load transfer mechanism and arching effect on the system, ground settlement, axial and lateral internal force distribution along the columns, and safety factor (SF) for overall stability.
In order to enhance the PLAXIS 2D plane strain model, caused by the shortcomings of the conventional EBR element, an innovative approach is conducted in this study. Structural "dummy" plate elements are added at the top of the EBR as a column model to better simulate the soil arching stress zone, as a part of the load transfer mechanism above the column. In addition, the lateral column capacity limit of the EBR is defined as multilinear, based on the type of each soil stratigraphy, to represent realistic lateral behavior better. To assess the influence of structural "dummy" elements on arching effect, a comparison is made between different modeling approaches. The arching stress above the column is calibrated using effective principal stress (\(\sigma'_1\)) values obtained from both a 2D axisymmetric and a 3D unit cell model. Subsequently, the stresses are compared with those from the 2D plane-strain model using the EBR integrated by
"dummy" plate elements. Otherwise, the internal force, column deformation, and overall system stability are evaluated using the 2D plane strain model.
Numerical Modeling of Embankment on Soft Clay Supported by Rigid Inclusions
The 2D axisymmetry model is used to describe an equivalent radius (Req) of 0.784 m, approximating the radial area as a square, as shown in Figure 2a, according to ASIRI (2012). As a validation, analysis is also performed in a 3D unit-cell model, with a tributary load area measuring 1.4 x 1.4 m (Figure 2b). The purpose of these analyses is to describe the behavior of a single IKM column under loading conditions by examining the arching stress at the head of the column. To represent the behavior of columns and embankments as a whole system, the analysis is performed using a 2D planestrain model. This model is referred to as a half-system and is described by symmetry with respect to the horizontal axis, as shown in Figure 2c.
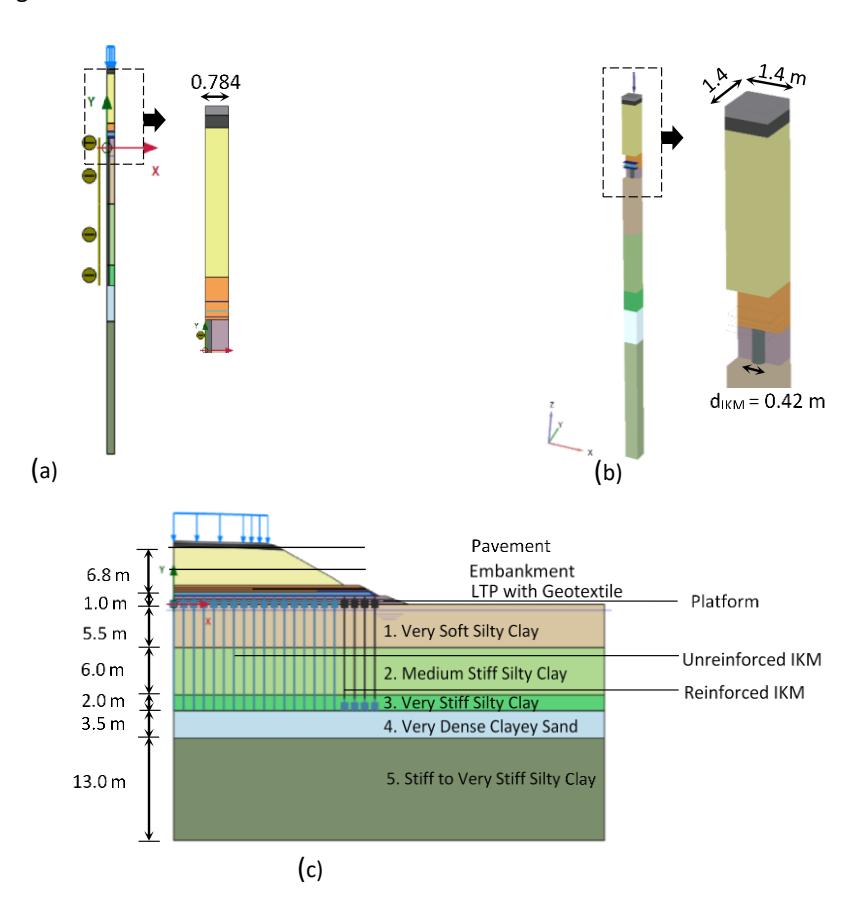
FEM model using PLAXIS (a) 2D axisymmetry, (b) 3D unit cell, (c) 2D plane strain.
Several soil constitutive models are employed to simulate different soil behaviors: Mohr-Coulomb (MC) Model—used for preliminary analyses and soil in general, Hardening Soil (HS) Model—applied to simulate nonlinear stress-strain behavior under loading, Soft Soil (SS) Model—selected to represent the consolidation behavior of the compressible soil. Soil parameters used in the numerical analysis are obtained from existing borehole, CPTu, and laboratory test data from the project site (PT. ADHI KARYA (Persero) Tbk., 2022).
The geotechnical investigation data, supported by relevant empirical correlations, indicate that the subsurface conditions at the study site are predominantly silty clay. A very soft silty clay layer (NSPT of 0 - 5) from the surface elevation to a depth of 6 m is modelled with the SS model. Further, the next layer consists of a medium-stiff silty clay soil (NSPT 3-7) to a depth of 10 m. On the next layer, a very stiff silty clay soil layer (NSPT of 14 – 19) up to a depth of 12 m. These medium-stiff and very stiff silty clay layers are modelled with the HS model. Below the silty clay layers, a very dense sand soil (NSPT of 60) up to a depth of 17 m was found – modelled with the MC model. The layer continued with a very stiff clay layer (NSPT 14–28) to a depth of 50 m. In the next layer, hard silty clay soil (NSPT 18–52) was encountered to the final depth of the investigation, 60 m. These very stiff and hard silty clay layers were modelled using the HS model. Based on field tests, the groundwater table at this location is observed at depths of 0.8-3.2 m. The soil profile at the study site is shown in Figure 3. The input soil parameters for this numerical study are presented in Table 1.
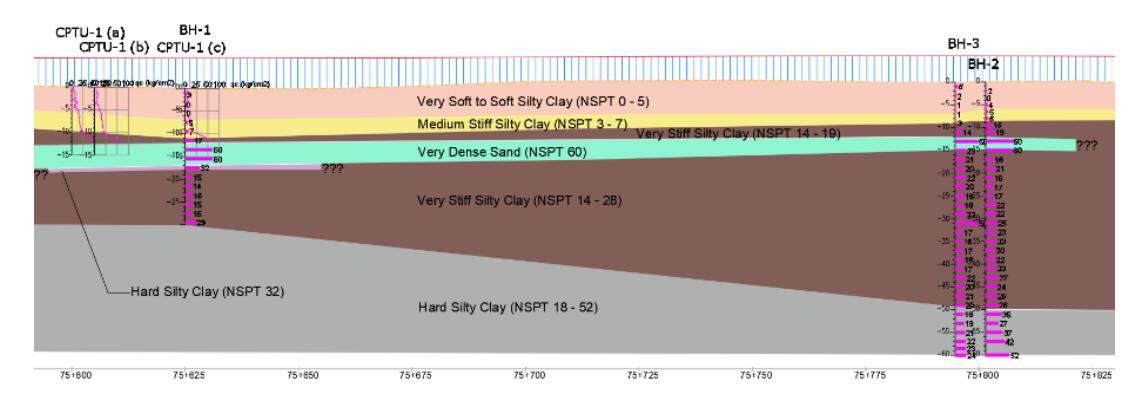
Soil profile.
Table 1 Soil parameters input for numerical analysis.
| Soil Layer | Unit | 1. Very Soft Silty Clay | 2. Medium Stiff Silty Clay | 3. Stiff Silty Clay | 4. Very Dense Clayey Sand | 5. Stiff to Very Stiff Silty Clay |
|---|---|---|---|---|---|---|
| Material model | Soft soil | Hardening soil | Hardening soil | Mohr-Coulomb | Hardening soil | |
| Drainage type | Undrained (A) | Undrained (A) | Undrained (A) | Drained | Undrained (A) | |
| Unsaturated Unit Weight, γunsat | kN/m³ | 17.99 | 17.32 | 18.00 | 19.00 | 17.91 |
| Saturated Unit Weight, γsat | kN/m³ | 17.99 | 17.32 | 18.00 | 19.00 | 17.91 |
| Initial Void Ratio, einit | 2.14 | 1.51 | 1.22 | 0.50 | 1.25 | |
| Modified Compression Index, λ* | 0.11 | - | - | - | - | |
| Modified Swelling Index, κ* | 0.02 | - | - | - | - | |
| Modulus of Elasticity, E | kN/m² | - | - | - | 42,000.00 | - |
| E50 ref | kN/m² | - | 3,780.00 | 8,820.00 | - | 11,340.00 |
| Eoed ref | kN/m² | - | 3,024.00 | 7,056.00 | - | 9,072.00 |
| Eur ref | kN/m² | - | 15,120.00 | 35,280.00 | - | 45,360.00 |
| Power (m) | - | 0.50 | 0.50 | - | 0.50 | |
| Compression Index, Cc | 0.79 | 0.46 | 0.35 | - | 0.46 | |
| Swelling Index, Cs | 0.01 | 0.05 | 0.03 | - | 0.05 | |
| Cohession, c | kN/m² | 4.00 | 8.00 | 8.00 | - | 11.00 |
| Internal Friction Angle, φ | ° | 15.00 | 15.00 | 25.00 | 35.00 | 22.00 |
| Poisson's Ratio,ν'ur | 0.15 | 0.20 | 0.20 | - | 0.20 | |
| Poisson's Ratio,ν' | - | - | - | 0,3000 | - | |
| OCR | 2.47 | 1.44 | 1.93 | - | 1.36 | |
| Permeability, kx | m/day | 8.00 x 10⁻² | 1.70 x 10⁻⁴ | 1.70 x 10⁻⁴ | 1.73 | 1.70 x 10⁻⁴ |
| Permeability, ky | m/day | 8.00 x 10⁻² | 8.60 x 10⁻⁴ | 8.60 x 10⁻⁴ | 8.64 | 8.60 x 10⁻⁴ |
As an intermediate layer that plays an essential role in load transfer, LTP is designed with granular materials with sufficient stiffness, with a minimum thickness to prevent differential settlement (Han, 2015). In the numerical analysis, both the LTP (platform layer) and the embankment material are modeled using the MC constitutive model, while the pavement material is modeled using a linear elastic constitutive model. The geotextile with a tensile strength of 200 kN/m used in numerical analysis. This element is modelled as an elastoplastic geogrid with a stiffness modulus (EA) of 1680 kN/m along its strong axis (Machine Direction or MD) and 625 kN/m along its weak axis (Cross Direction or CD). These parameters are determined based on the specified allowable strain of 5% under service load conditions. To account for the plastic condition, the nominal tensile strengths of the geotextiles in the MD and CD directions are defined as Np, with values of 126.1 kN/m and 31.5 kN/m, respectively. These values are obtained by reducing the geotextile tensile strength by the creep-rupture, installation damage, and environmental-effect reduction factors.
Based on recent studies developed by Sluis (2012), van der Kwaak (2015), Marjanović et al. (2016), Smulders et al. (2019), and Goudar&Kamatagi (2022), the enhanced EBR element is selected as the column model in this numerical analysis. To determine the dimension of the plate elements in the 2D plane strain model, the σ'1 stress at the column
head in this model is calibrated with the σ'1 stress achieved in the 2D axisymmetric and 3D unit cell. The 0.42 m-diameter IKM column is designed to be 13.5 m long, with its tip embedded in very dense sand soil. The ultimate single-column axial capacity (Qult) is determined by combining the tip and skin resistance of the column, considering the additional axial load due to the negative skin friction (NSF). According to British Standard 8006-1 (2010), based on the allowable column axial capacity (Qall) and the maximum loads due to embankment and traffic, the required column spacing is 1.4 m for an SF of 1.5.
For cohesive soil, the ultimate single-column lateral capacity (Pu) is determined based on a specific depth limit, Zr (API, 2010). For cohesionless soil, Pu is determined based on soil properties, column depth, and diameter (Randolph & Gouvernec, 2011), as shown in Figure 4. Both the axial and lateral capacities of the column are defined as multilinear. Limiting column capacity to the capacity of each soil layer is intended to provide more representative column behavior under axial and lateral loading. To limit the column axial and bending moment capacity, the properties of the EBR elements were set to elastoplastic with modulus of elasticity (E) of 7.00 × 10⁶ kN/m^2. At the center of the embankment, the columns are intended primarily to accommodate axial loads. As they approach the edge of the embankment, the lateral load becomes more predominant. Consequently, a reinforcement of several outermost columns is required to provide additional resistance. The evaluation of rebar requirements is carried out by considering the maximum stress in the massive circular area of the column due to the moment, relative to the tensile strength of the concrete (British Standard EN 1992-1-1, 2004). Based on the column design interaction, the bending moment capacities of the unreinforced and reinforced IKM were set to 6.00 kN · m and 70.00 kN · m, respectively.
Limiting lateral resistance (Randolph&Gouvernec, 2011).
Construction of IKM at Serang-Panimbang Toll Road Project STA 75+600 to STA 75+800 (PT. ADHI KARYA (Persero) Tbk., 2024).
(a) Installation of longitudinal geotextile, (b) construction of LTP at Serang-Panimbang Toll Road Project STA 75+600 to STA 75+800 (PT. ADHI KARYA (Persero) Tbk., 2024).
Construction of (a) embankment, (b) rigid pavement at Serang-Panimbang Toll Road Project STA 75+600 to STA 75+800 (PT. ADHI KARYA (Persero) Tbk., 2024)
Results
Stress Distribution and Arching Mechanism on LTP
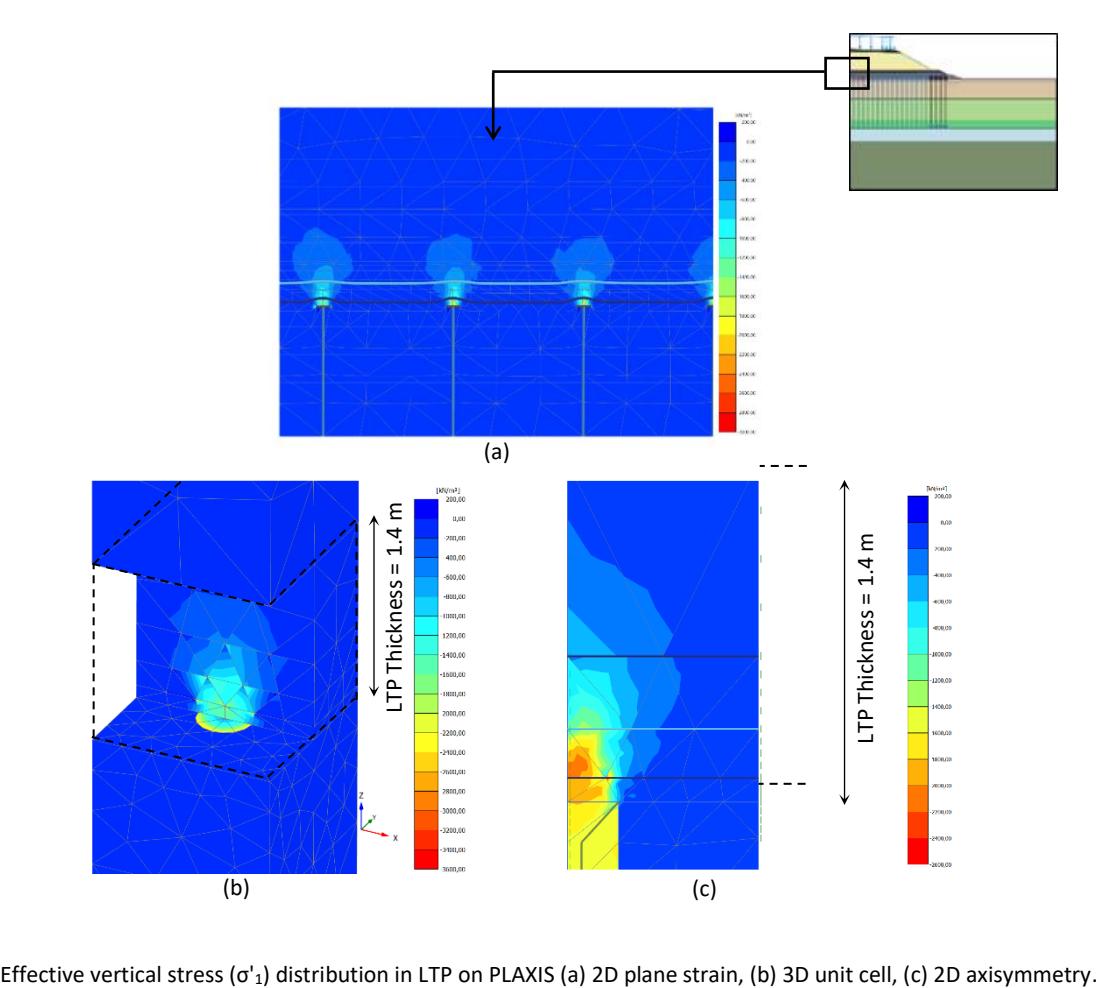
The finite element numerical analysis results show a significant improvement in the arching mechanism by integrating geotextile with LTP above the IKM column. In the 2D axisymmetry model, vertical stress is concentrated at the column head, particularly in the center of the embankment. The effective vertical stress (σ'1) reached a peak of 2191 kN/m². This outcome highlights the improved load distribution toward the rigid inclusions, primarily driven by the high stiffness contrast between the IKM and the surrounding soft soil. The outcome is further supported by the results of the 3D unitcell and 2D plane-strain model analyses, which indicate that the maximum σ'1 is consistently observed at the column head, with values of 2186 kN/m² and 2161 kN/m², respectively. The observed effective vertical stress values within the LTP layer, as derived from each numerical analysis model, are illustrated in Figure 8.
Consolidation and Soil Vertical Deformation
Vertical displacement analysis under full embankment loading showed that adding plate elements reduces the maximum surface settlement at the end of the consolidation period. From numerical analysis, the vertical deformation value (uy) observed in the LTP layer at the centerline and the edge is found to be 20.71 cm and 19.38 cm, respectively (Figure 9a). This value is comparable to the readings of the settlement plate installed in the LTP layer, which showed a maximum vertical deformation value of 15.80 cm at the centerline and 11.00 cm at the edge (Figure 9c). This <10% deviation indicates a satisfactory model calibration and supports the effectiveness of IKM with plate elements in controlling vertical deformation. Moreover, the very soft silty clay layer (soil layer 1) between the piles showed settlement of up to 23.25 cm. This settlement trend is confirmed by a comparable pattern observed in the 3D unit-cell model (Figure 9b), which includes simplified lateral soil-structure interaction effects in the 2D plane-strain model. In the base layer, which consists of hard clay, consolidation settlement is identified with a maximum value of 9.00 cm, decreasing gradually towards the edge of the embankment.
Pore pressure development due to embankment loading is evaluated using piezometer data. Field measurements recorded the pore pressure (pwater) value of 78.22 kN/m² at a depth of -8.5 m at the end of embankment construction (Figure 10b). In comparison, the numerical model predicted the value of 76.00 kN/m² at the same depth (Figure 10a).
Column Stress and Deformation
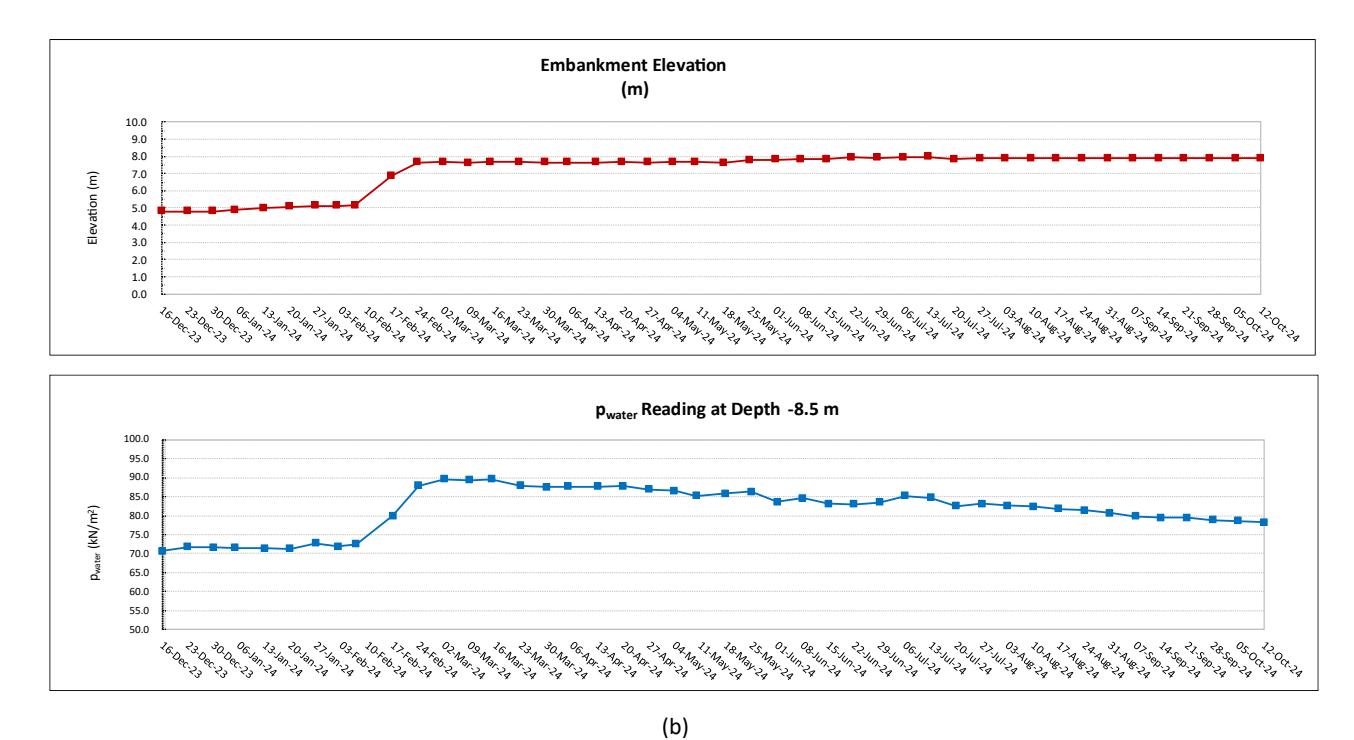
The numerical results show that as the embankment load is transferred to the LTP, the load is primarily distributed vertically to the IKM. The 3D unit cell model shows a specific pattern of axial stress distribution along the column: the stress gradually increases from the top to the middle, reaching a maximum at the middle, as shown in Figure 11a. This behavior indicates the contribution of NSF, which is mobilized by the consolidation of surrounding soft clay and generates a downward drag force on the column. The location of the neutral plane, where axial forces attain their maximum value, marks the transition from negative to positive skin friction (PSF). Below this depth, the axial stress decreases as PSF is mobilized and the load is gradually distributed to the dense sand layer through end-bearing resistance. The 2D plane strain model (Figure 11(b)) confirms this tendency, particularly in the center of the embankment, where a higher concentrated axial stress is observed compared to the embankment edges. At the edges of the embankment, axial stresses become lower and bending moments become more significant (Figure 11c), due to the asymmetrical loading and horizontal forces generated by the embankment geometry.
Based on the numerical analysis results at the end of the consolidation stage, the outermost column showed a maximum horizontal deformation (ux) of 45.81 mm at surface elevation. Meanwhile, field monitoring using an inclinometer installed at the exact location recorded a comparable horizontal displacement of 40.79 mm at a depth of -1.5 m. The consistency of these lateral deformation values, as shown in Figure 12, indicates that the multilinear lateral capacity limitation of columns in the numerical model can accurately represent the lateral behavior of columns under loading conditions.
Global Stability Assessment
Global stability analysis using the strength reduction method in a 2D plane-strain model yielded a safety factor of 1.64 under operational loads. As shown in Figure 13, shear strain localization revealed a significant failure surface, confirming that the IKM ground improvement system effectively extends the failure mechanism away from the embankment's toe and enhances slope stability.
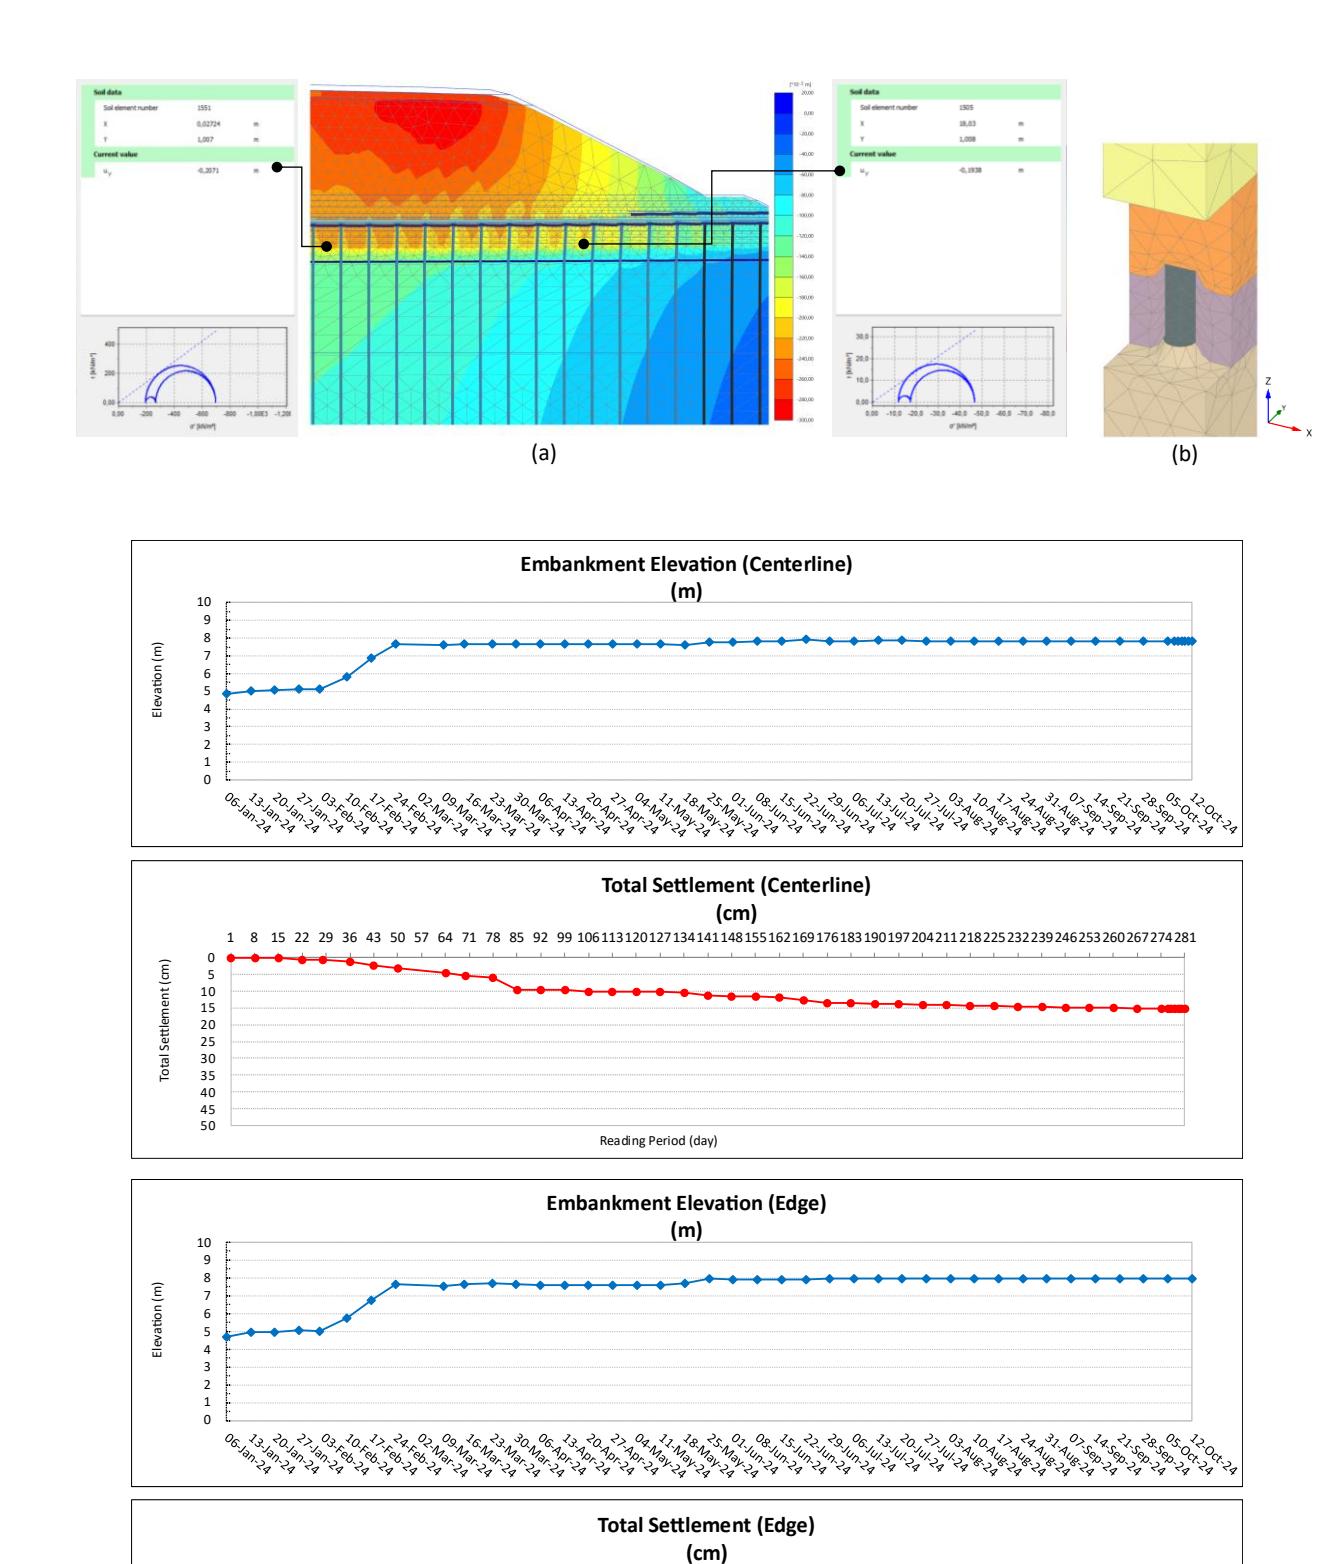
Vertical deformation (uy) in LTP (a) PLAXIS 2D plane strain, (b) PLAXIS 3D unit cell, (c) settlement plate measurement at STA 75+675. (c)
Reading Period (day)
1 15 22 29 6 50 5 6 1 5 92 99 10611 12012 1 1 11 1551621691 61 19019 20 21121 2252 22 92 625 26026 2 2 1
Total Se lement (cm)
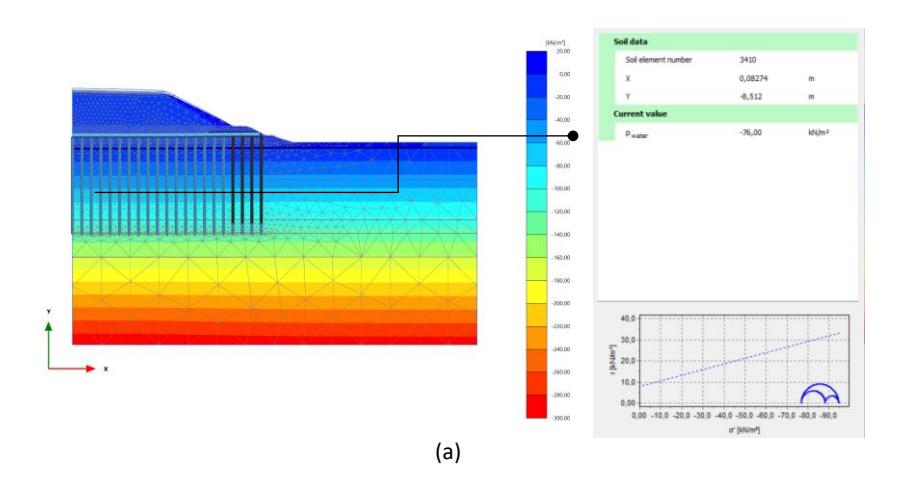
Pore water pressure value (a) PLAXIS 2D plane strain, (b) piezometer measurements at STA 75+675
Pile stress distribution (a) axial stress on single pile, (b) axial stress distribution, (c) bending moment distribution.
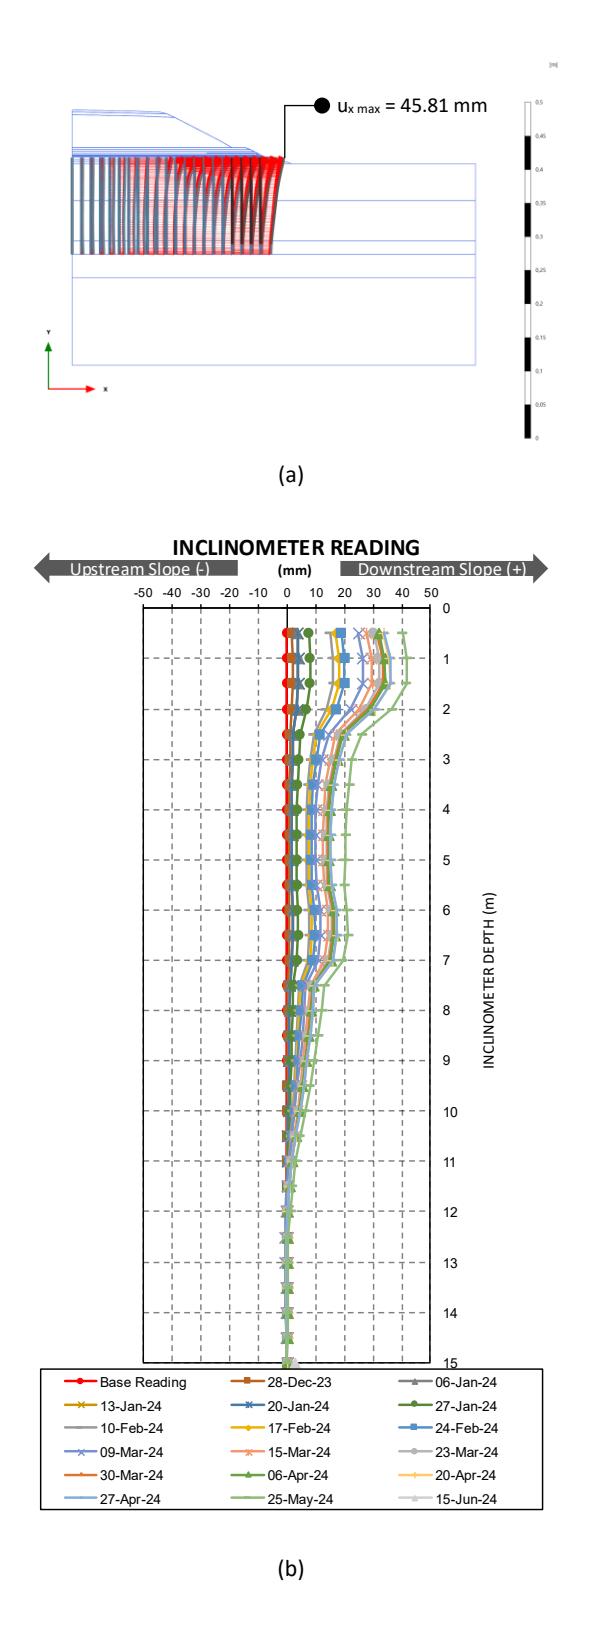
Horizontal deformation at outermost column (a) PLAXIS 2D plane strain, (b) inclinometer reading at STA 75+575.
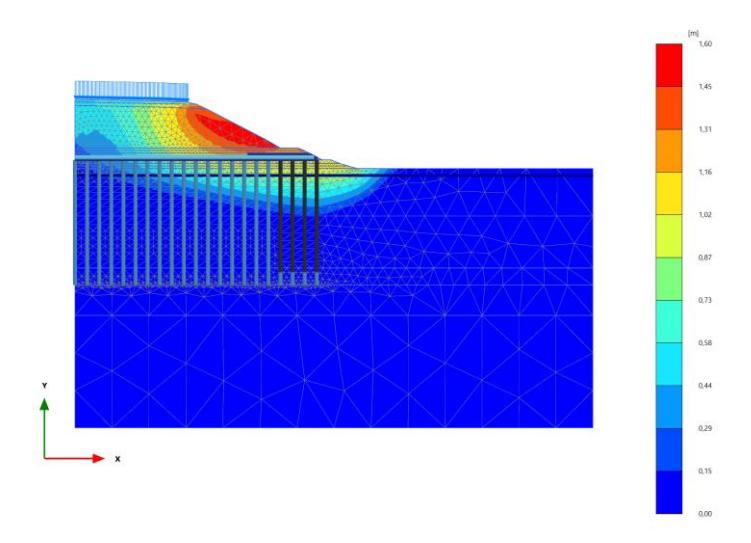
Failure plane deformation under operational load (SF = 1.64).
Discussion
The numerical findings show that the enhancements introduced in this study–structural plate elements and depthdependent multilinear lateral resistance–substantially improve the reliability of the IKM modeling compared with conventional EBR approaches.
Improved Arching Representation
The close consistency of the σ′1 values among the 2D axisymmetric, 3D unit cell, and 2D plane strain models confirms that the additional plate elements effectively overcome the geometric limitations of the traditional EBR elements. The presence of plates provides a larger surface area for stress transfer, enabling the model to capture the arching zone more reliably. An improved arching simulation is essential because the stress concentration above rigid inclusions distributes load to the LTP and governs differential settlement performance.
Interaction between Consolidation, NSF, and Stress Transfer
The settlement and pore pressure analyses indicate that the enhanced model adequately represents the consolidation behaviour of slightly overconsolidated soft clay soil. The accurate prediction of NSF and the location of the neutral plane further validates the model's ability to simulate soil–column interaction mechanisms that develop during consolidation. The NSF mechanism is fundamental in soft clay models, where downward drag can significantly amplify axial forces if not adequately accounted for.
Lateral Behavior
The agreement between predicted and measured lateral deformation highlights the effectiveness of applying depthdependent lateral resistance in the IKM model. In soft clay, lateral soil stiffness varies significantly with depth. Using a constant lateral resistance—as commonly used in conventional EBR formulations—can lead to an underestimate of bending moments, particularly for edge columns subjected to embankment lateral spreading. Capturing these effects is crucial for the analysis because lateral deformation directly affects bending moments and can govern reinforcement requirements for outer columns.
Slope Stability Improvement
The increased safety factor and the displacement of the potential failure surface away from the embankment toe indicate the combined advantages of arching, improved vertical load transfer, and decreased lateral movement. The outcome confirms that the rigid inclusion systems not only reduce settlement but also significantly enhance slope stability when correctly modeled.
Implications for Engineering Practice
The enhanced model provides more accurate predictions of both axial and lateral column performance—two aspects that are often difficult to capture simultaneously with a conventional model. The model improvements presented in this study have practical implications for optimizing a ground improvement design using IKM. While the study does not introduce a new theoretical framework, it provides an applied modeling approach that addresses several gaps in current studies, particularly in slightly overconsolidated soft clay soils, where behavior transitions depend on stress changes.
Conclusions and Recommendations
This study introduced an enhanced numerical modeling approach to evaluate the performance of Mortar Column Inclusions (Inklusi Kolom Mortar or IKM) for embankment construction over slightly overconsolidated soft clay soil. The enhancement involved integrating structural "dummy" plate elements at the top of Embedded Beam Row (EBR) elements in PLAXIS to improve simulation of the soil arching stress zone and to enable a more realistic stress distribution along the columns and the overall ground improvement system. The enhanced model—developed in 2D and 3D configurations—significantly improves the representation of vertical load transfer from the embankment through the Load Transfer Platform (LTP) into the IKM. The stress concentration above the column head is more clearly defined, and the transition from negative to positive skin friction along the pile – indicated by the neutral plane – can be effectively described. This stress profile closely reflects the expected soil-structure interaction behavior in soft soils reinforced with rigid inclusions.
A key component of the enhanced modeling approach is the assignment of column lateral resistance using depthdependent multilinear stiffness functions based on soil stratigraphy. This allows the model to simulate more realistic mobilization of lateral resistance along the column, particularly in soft clay soils where lateral displacement affects structural behavior and load distribution. As a result, the enhanced model provided improved predictions of column bending moments and lateral deformation.
Comparison with field monitoring data further validated the model's performance. The predicted settlement of soft soil between the columns closely matched the settlement plate measurements. The numerical analysis results showed soil settlement of 20.71 cm at the centerline and 19.38 cm at the embankment edge. In comparison, the settlement plate readings show the value of 15.80 cm at the centerline and 11.00 cm at the edge of the embankment. Furthermore, the numerical analysis confirms the accuracy of the inclinometer readings for the column's maximum lateral deformation, yielding values of 45.81 mm and 40.79 mm, respectively. These findings confirm that the enhanced model effectively captures the essential mechanisms governing the axial and lateral behavior of the rigid inclusions under embankment load.
Despite the improved simulation of load transfer and deformation, some limitations remain—such as simplified boundary conditions, the inherent constraints of 2D assumptions for describing 3D behavior, and exclusion of secondary settlement mechanisms. Improving these aspects in future studies could enhance the model's accuracy and long-term settlement prediction. Future research should incorporate 3D full-scale modeling, apply Soft Soil Creep or alternative time-dependent constitutive models, and calibrate the results with more sophisticated geotechnical monitoring instrumentation. This will improve validation of the overall column's stress and deformation behavior and support the development of more robust, cost-effective ground improvement systems.
However, the study does not propose a new theoretical concept. Despite this, the study presents an enhanced finite numerical analysis of an applied geotechnical construction that is expected to offer a real contribution to ground improvement design using rigid inclusions, particularly in slightly overconsolidated soft clay soils.
Acknowledgments
The author gratefully acknowledges the financial support provided by PT. Promisco Sinergi Indonesia and the Government of Bandung City. The funding agencies had no role in the study design, data collection, analysis or interpretation, and the decision to publish the results.
Compliance with Ethics Guidelines
The authors declare they have no conflict of interest or financial conflicts to disclose.
This article contains no studies with human or animal subjects performed by the authors.