
Introduction
According to Nag [1], Indonesia is the world's largest island nation and it has the fourth-longest coastline. Routine maintenance is necessary when using buoys as a visual navigation aid based on data from the Indonesian Ministry of Transportation [2]. Batteries and solar cells are the current power sources for buoys, which require routine maintenance every three to five months. Hence, longer maintenance intervals and an alternative energy source are required to improve this situation. Microbial fuel cells (MFCs) are a potential alternative energy source for buoys.
An MFC is a device that uses the metabolism processes of microorganisms to produce electricity directly from organic compounds through the catalytic activity of redox reactions [3,4]. An MFC consists of two electrodes, an anode and a cathode, which are usually separated by a cation exchange membrane (CEM). The electrochemical reaction on the anode is the oxidation of organic compounds into carbon dioxide with the help of microorganisms forming a biofilm on the electrode. This reaction produces electrons used on the cathode to reduce oxygen or other compounds on the cathode. In experiments done by Timmers [5], one of the highest power densities was generated by using a phototrophic sediment microbial fuel cell (PSMFC) at 100 mW/m2 .
A PSMFC is a sediment-type self-sustained MFC setup that uses the synergistic interaction between photoautotrophic microorganisms and heterotrophic bacteria [6]. According to the experiment by He et al. [6], under illumination, a PSMFC continuously produces electricity without the external input of nutrients. However, the current in a PSMFC can decrease under illumination and increase when unilluminated. Furthermore, according to experiments conducted by Kothapalli [7], PSMFCs do not require a cation exchange membrane to operate, resulting in lower operation costs. This setup uses a single-chamber MFC with electrodes connected in the same solution. Therefore, molecules and ions can diffuse from the anode to the cathode and affect the performance of the PSMFC depending on the distance between the electrodes in the solution. Both advantages (no additional nutrients and cation exchange membrane necessary) show that PSMFC has good potential to be developed as a power source for buoys.
Much research related to PSMFCs has been conducted [8]. However, previous studies often focused on plants as the phototrophic organism, which are not fit to produce electricity in buoy systems. For buoy systems, the most potential phototrophic organisms are microalgae. The usage of microalgae such as Volvox sp. in PSMFCs has not been studied much. Hence, this work provides a preliminary study on the application of PSMFCs for electricity generation in buoy systems, with Volvox sp. as the phototrophic organism. This research is expected to contribute to SDG number 7, in the form of electricity generation to gain affordable and clean energy.
This study aimed to investigate the effect of the illumination, electrode distance, and illumination period on PSMFC performance. The illuminated and unilluminated periods affect the performance of the microalgae, which are phototrophic organisms, while the electrode distance affects the ohmic (solution) resistance, so it is important to study these aspects. The results achieved in this work are expected to contribute to future research, such as optimization by modification of the configuration. When the process is optimized, this research can be implemented in light buoy systems and can provide economic benefits by saving capital costs (production of the PSMFC system) and operational costs (maintenance of the PSMFC system). Furthermore, the renewable energy produced by PSMFC systems is expected to contribute to the environmental protection and chemical engineering fields by reducing fossil fuel demand, preventing global climate change, and providing a circular economy.
Methodology
This research was conducted in three main steps, i.e., preparation, main experiment, and analysis. The illuminated conditions (factors T = illuminated, and G = unilluminated), electrode distance (varied at 11 and 22 cm), and illumination period (variations P = prolonged for 120 hours, and N = normal for 12 hours) were the three variations conducted in this research. A control variation with an electrode distance of 22 cm was also conducted, which depended on ambient sunlight.
Preparation
The preparation step consisted of preparation of the microbial fuel cell medium, acclimatization of the microorganisms, and preparation of the microbial fuel cell system. This step is crucial for the engineering aspect of this work, such as the type of substrate and biocatalyst, electrode material, reactor shape, electrode distance, etc. This process was done aseptically to prevent contamination as well as to obtain quality control and quality assurance on the collected data. Hence, this process was done very carefully, using a bio-safety cabinet and sterilization unit, such as an autoclave.
Preparation of Microbial Fuel Cell Medium
The medium chosen for the cathode side was sterilized BG-11 broth mixed with Fe solution. This medium was fitted to cultivate microalgae [9]. The BG-11 medium consisted of 1.5 g/L NaNO3, 0.04 g/L K2HPO4, 0.075 g/L MgSO4.7H2O, 0.036 g/L CaCl2.2H2O, 0.2 g/L Na2CO3, and 0.006 g/L citric acid. The Fe solution consisted of 0.001 g/L Na2-EDTA and 0.006 g/L Fe-Ammonium citrate. This solution was added with 1 mL of trace element for every liter of BG-11 medium.
Acclimatization of Microorganisms
Pseudomonas sp. bacteria cultivated in YPG broth were transferred to POME (palm oil mill effluent) in a flask. The solution was then purged using nitrogen to create an anaerobic environment for the bacteria. The flask was sealed and left for 14 days, inducing the formation of sediment.
At the same time, Volvox sp. microalgae were cultivated inside a bottle using the BG-11 + Fe solution medium and were illuminated using 6 fluorescent lamps for 24 hours per day until the solution was concentrated with the microalgae (green color). The microalgae were aerated using a sparger.
Preparation of Microbial Fuel Cell
The constructed PSMFC design was similar to that used in He et al. [6], which can be seen in Figure 1. A 500 mLmeasuring cylinder was used as the reactor. A stainless steel mesh was placed at the bottom of the cell as the anode and 50 mL of Pseudomonas sp. culture was poured into the cell, covering the entire anode. The BG-11 + Fe solution medium was used to fill the remaining volume of the cell. The flask was then sealed for 7 days until the sediment had settled. Once settled, most of the turbid parts in the solution were withdrawn using a syringe, leaving a small amount of the medium and the biofilm on the anode. Fresh BG-11 + Fe solution medium was added once again to make up for the missing cell volume. This step was repeated until the POME and the biofilm stopped resurfacing.
A stainless steel mesh for the cathode was placed inside an empty tea bag. Then, the algae inoculum was poured into the tea bag. The algae stayed in the tea bag as the concentrate, while the fluids passed the tea bag as the filtrate. Once the tea bag was algae-rich, the cathode was ready to be used. The cathode was immersed in the solution and was positioned at the top of the cell. Then, both electrodes were connected with an insulated copper wire and the electrochemical analysis system (OCP, potentiodynamic, and EIS systems).
Main Experiment
The finished MFC was placed inside a control box. The LED lamp inside the box was then switched on and a multimeter was connected to the cable ends. The lamp was either switched on or off, depending on the variation at work. For the controlled illumination system, a 3-watt LED was installed inside the fully closed box. The distance between electrodes was configured either at 11 cm or 22 cm using a ruler, depending on the variation at work.
Figure 1 PSMFC: (a) illustration of PSMFC inside the control box, (b) working variation done in this experiment.
Analysis
The analysis consisted of open circuit potential (OCP), potentiodynamic I-V curves, electro impedance spectroscopy (EIS), scanning electron microscopy (SEM), and Fourier transform infrared spectroscopy (FTIR). Open circuit potential was used to determine the capacity of the electrons produced by the microbes.
Potentiodynamic I-V curves were used to determine the current and power density of the fuel cell. EIS was used to identify the circuit equivalent and the resistance of the microbial fuel cell. SEM was used to observe the biofilm formation on the anode surface. FTIR was used to identify various functional groups in the sediment on the anode.
Results and Discussion
Open Circuit Potential (OCP) Characterization
OCP was measured using potentiostat at the end of an illumination period (with or without illumination). The OCP is the maximum that can be achieved, because in the measuring method there is no resistance in the electrical scheme. The same method was used in experiments done by Scott [10]. The OCP value of each variation is shown in Figure 2.
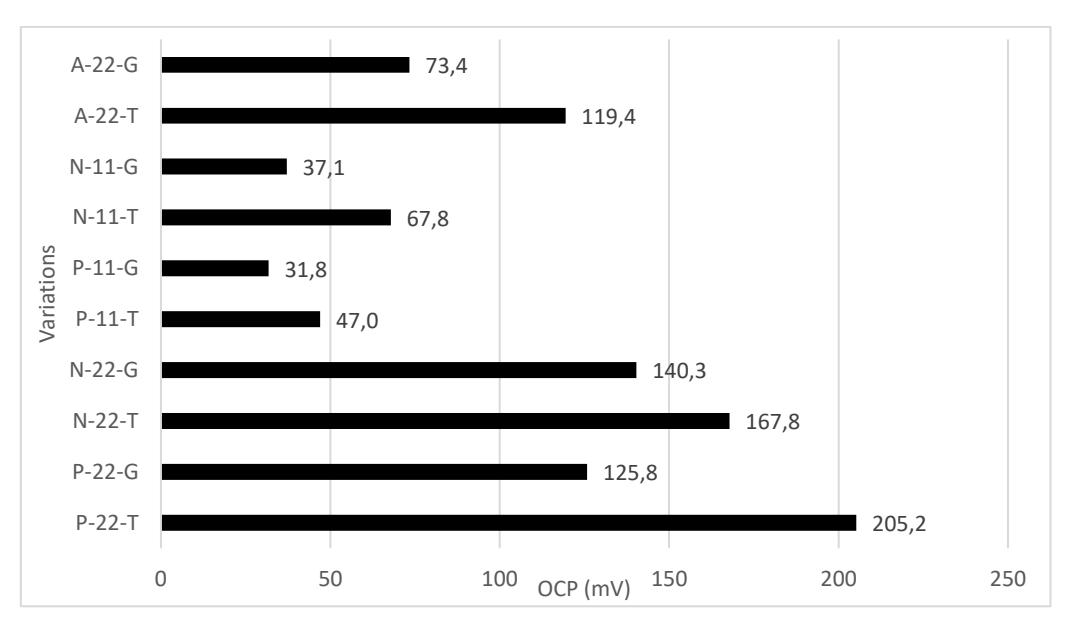
Figure 2 Effect of variations in OCP.
Using variation A as the baseline for the experiment it was shown that the illuminated MFC produced a higher OCP than the MFC without illumination. This was due to the increase of the oxygen concentration in illuminated condition. The dissolved oxygen level affects the overall electrochemical reaction as oxygen serves as the primary reaction limiting component on the cathode, based on experiments done by Rago et al. [11]. As more oxygen is produced during photosynthesis, a higher OCP was measured in experiments done by Ye et al. [12].
Variation P had a higher OCP than variation N when illuminated. The OCP of variation N in unilluminated condition was higher than variation P's counterpart. The OCP was, however, lower for variation N during illumination than variation P's counterpart. This was due to the higher oxygen concentration in variation P when illuminated and a more anaerobic condition in variation P in unilluminated condition.
The OCP produced by variation 11 was below that of variation 22 in all cases. This was due to oxygen diffusion to the anode side of the cell. The presence of oxygen on the anode created a slightly aerobic condition that hindered the bacteria anaerobic trait, thus decreasing the exoelectrogenic activity of the bacteria, based on experiments done by Chen et al. [13]. Oxygen present in the anode could also be reduced to water molecules on the anode surface. Recurring reactions on both the anode and the cathode reduce the OCP value by a significant amount. Hence, in this research, it was better to use a longer electrode distance.
Potentiodynamic Curve (I-V-P Curve) Analysis
The IVP curve was generated using a Gamry 3000 potentiostat with the voltage ranging from the OCP value to 0. The current at the maximum power and the maximum power density are tabulated in Figure 3.
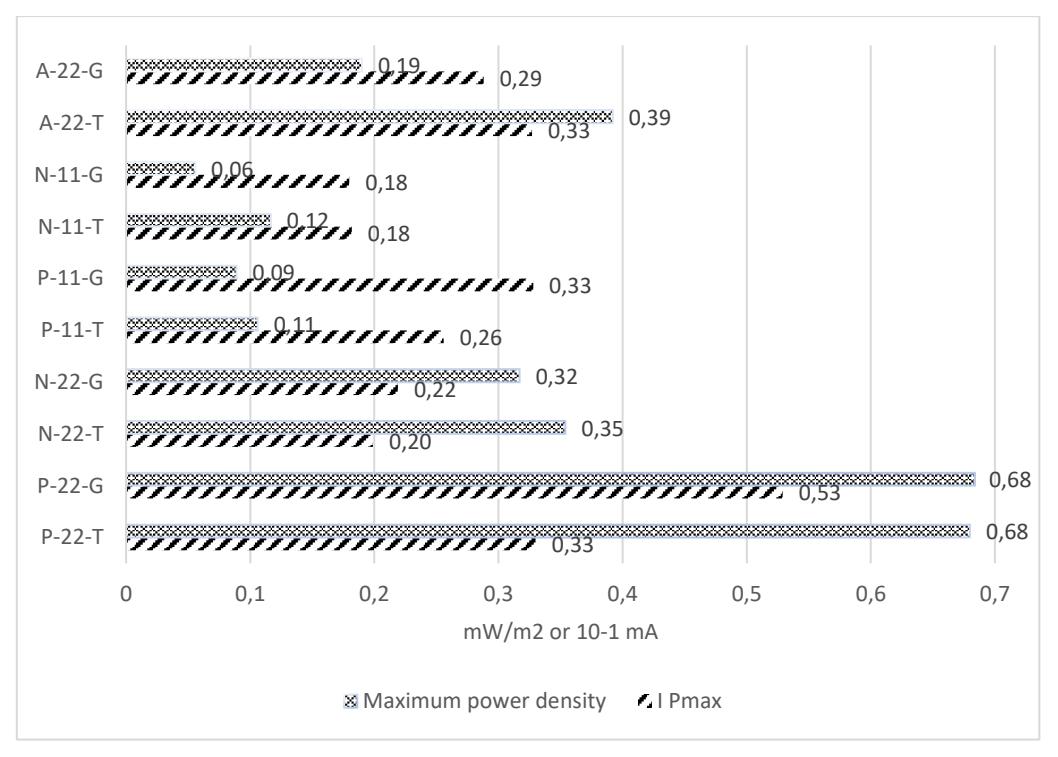
Figure 3 Effect of variations against current and max power density.
I \(P_{max}\) is the current at maximum power, while maximum power density is the power density divided by the anode area (9 cm<sup>2</sup>). The highest power density recorded for this experiment was 0.684 mW/m<sup>2</sup>, which is lower than the 100 mW/m<sup>2</sup> recorded by Timmers et al. [5]. The highest current was 0.53 \(\mu\)A, which is higher than the 0.1 \(\mu\)A recorded by He et al. [6].
The current for unilluminated variations A, P, and N was higher than for the illuminated ones. This was due to the higher amount of oxidation reaction in the system by He et al. [6], as the microalgae were not able to perform photosynthesis. As the bacteria on the anode and the microalgae on the cathode oxidized any organic content when unilluminated, less organic content became available in the medium. This was also true for the dissolved oxygen content, which became lower after being utilized by the microalgae. When there is less dissolved oxygen content in the medium, the bacteria go to the anaerobic state, which increases the anaerobic reaction and increases the electrons released. The same was found in the experiments done by Ye et al. [12], which also showed an increase in current (from 0.5 to 1.5 mA/cm²) when the oxygen concentration was reduced from 0.21 to 0.1 M. When combined, these two factors produce a higher current.
When the illumination was prolonged, the current of variation P was higher than that of variation N. Prolonged darkness (unilluminated condition) of variation P produced a current as much as two times than of variation N, thus an oxygen-deprived cell produces a higher current.
The power density tended to increase illuminated condition, opposite to the trend of the current. This was due to power being equal to the OCP times the current; while the current showed a declining trend, the OCP increased greatly in illuminated condition and thus resulted in a higher power density.
Comparing the electrode distances, variation 22 always produced a higher current and power density. The volume and length of variation 11 was only half of variation 22, thus the lower distance of travel between the electrodes meant easier diffusion of oxygen produced on the cathode. Oxygen can easily diffuse to the anode and hamper the bacteria's ability to oxidize organic content in anaerobic condition; therefore, the overall oxidation rate was reduced and produced a lower current. The same trend was shown for power density due to a lower OCP and current for variation 11 compared to variation 22, resulting in a lower power density.
ANOVA Analysis
ANOVA analysis was done to determine the most affecting factors on OCP and current, i.e., illumination, electrode distance, and illumination period. Using a 95% confidence level, the P-value of each factor on OCP and current are shown in Table 1.
Factor P-value OCP Current Illumination 0.049 0.204 Electrode distance 0.001 0.157
Illumination period 0.956 0.025
Table 1 ANOVA analysis of OCP and current.
Determining the significance factor was conducted by examining each P-value; any P-value lower than 5% (rejection area) was deemed a significant factor. The most affecting factor on OCP was electrode distance, followed by illumination. The current was only affected by the illumination period.
A shorter electrode distance caused the anode to become slightly aerobic, which hindered the exoelectrogenic activity of the bacteria on the anode. Moreover, stray oxygen on the anode may induce the reduction reaction of oxygen, thus resulting in a lower OCP.
OCP was also affected significantly by the illumination condition (illuminated or unilluminated). In illuminated condition, the microalgae were able to perform photosynthesis and produce oxygen. As the oxygen level increased on the cathode, so did the overall electrochemical reaction rate and the OCP generated.
The current was higher during prolonged unilluminated condition. During the unilluminated period, the microalgae consume oxygen and any organic content in the cell. When the oxygen level decreases, the exoelectrogenic activity of the anaerobic bacteria on the anode increases. Therefore, the oxidation reaction rate increases and generates a higher current.
Electrochemical Impedance Spectroscopy (EIS) Characterization
EIS characterization was done on variation 11 and 22 at the end of an illuminated and unilluminated period. The frequency ranging from 1 MHz to 0.01 Hz was used to obtain a Nyquist and Bode plot. A PSMFC circuit model was generated, as shown in Figure 4.
Figure 4 PSMFC circuit model.
The circuit consisted of three main resistances: RS = solution resistance, RC = charge resistance, and RM = mass resistance. The solution resistance represents the resistance of the electrolyte solution between anode and cathode, and it can be measured using EIS. The charge transfer resistance represents the resistance to electron transfer between the electrode surface and the electrolyte solution. Finally, the mass transfer resistance
represents the resistance to the transport of reactants and products to and from the electrode surface. This same model was used in experiments done by Ter Heijne et al. [14]. When the EIS data is plotted on a Nyquist plot, the different components of the circuit model contribute to different regions of the plot. The circuit model can then be used to create a fitting, as shown in Figure 5.
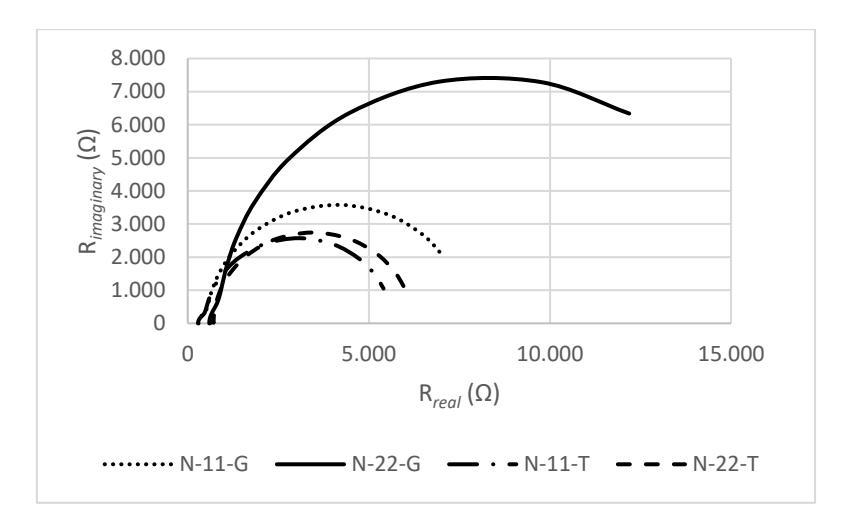
Figure 5 Nyquist plot of each variation.
A tabulation of each resistance obtained from both Bode and Nyquist plots is shown in Table 2.
Variation Bode plot Nyquist plot RΩ 1 (ohm) RP 2 (ohm) RS (ohm) RC (ohm) RM (ohm) N-11-G 298.9 5640.1 296.3 248.9 7147 N-22-G 604.7 5719.3 595.1 305.4 14840 N-11-T 290.8 5500.2 284.7 209.9 5135 N-22-T 688.7 5852.3 620.2 92.76 5484
Table 2 Resistance of each component in Bode and Nyquist plots.
Solution resistance in variation 11 was only half the resistance in variation 22. This indicates that mass transfer in variation 22 was extremely difficult due to the great distance between the electrodes, thus the solution resistance became twice the value of variation 11. The illuminated and the unilluminated conditions had relatively constant solution resistance values, i.e., 290 Ω for cell 11 cm and 610 Ω for cell 22 cm. The solution resistance values for both distances were similar to the characterization in the Bode plot.
The charge transfer resistance in unilluminated condition, both in cells at 11 cm and 22 cm, was higher than in illuminated condition. This phenomenon occurs due to the difference in dissolved oxygen concentration between dark and bright conditions. In bright conditions, photosynthesis by the algae produces oxygen. The high oxygen concentration at the cathode makes it easier for electrons to move from the cathode surface to hydrogen ions and oxygen molecules, resulting in a lower measured charge transfer resistance, based on experiments by Ter Heijne et al. [14].
The largest resistance observed was the mass transfer resistance and it tended to be higher when unilluminated. In dark conditions, the microalgae are not able to perform photosynthesis and some of them die out. When a cell dies, any organic matter stored within the cell is released, increasing the organic matter content in the solution. As there is no oxygen produced by the microalgae in the cathode, the MFC becomes oxygen-starved and it becomes harder for any remaining dissolved oxygen to diffuse onto the cathode surface due to the more concentrated solution.
1Ohmic (solution) resistance
2 Polarization resistance
Scanning Electron Microscopy (SEM) Characterization
SEM analysis was performed to observe the biofilm formation on the anode, as shown in Figure 6.
Figure 6 Biofilm formation of (a and b) variation A, (c and d) variation 11, and (e and f) variation 22 with magnification at 1000x and 3000x.
Based on the SEM test results, all stainless steel was covered with a biofilm. In variation 11, biofilm formation appeared to be more dispersed than in variations A and 22. The dispersed biofilm formation in variation 11 strengthened the phenomenon that occurred, i.e., the diffusion of oxygen to the anode. The presence of oxygen at the anode causes microbes to live aerobically, which should be anaerobic according to the experiments done by Rago et al. [11]. Thus, biofilm formation was inhibited and consequently was not as dense as in variations A and 22.
The biofilm formation for variation A and 11 had a similar scattered and thin morphology, while variation 22 was denser and more clumped together. This may indicate that the biofilm formation in variation 11 was hindered by oxygen diffusion to the anode. Variation A, although it had an electrode distance of 22 cm, did not have, in any way, controlled variables. Variation A may have longer illuminated periods and very few unilluminated periods within a day. This could indicate that the oxygen production rate was higher and more stable than in variations 11 and 22. The continuous stream of oxygen produced by the microalgae might hinder the biofilm formation on the anode.
Fourier Transform Infrared Spectroscopy (FTIR) Characterization
An FTIR analysis was performed to determine the organic content of the anode sediment and the primary carbon source for the bacteria on the anode. The analysis was done on variations A, 11, and 22. The result of the FTIR analysis is shown in Figure 7.
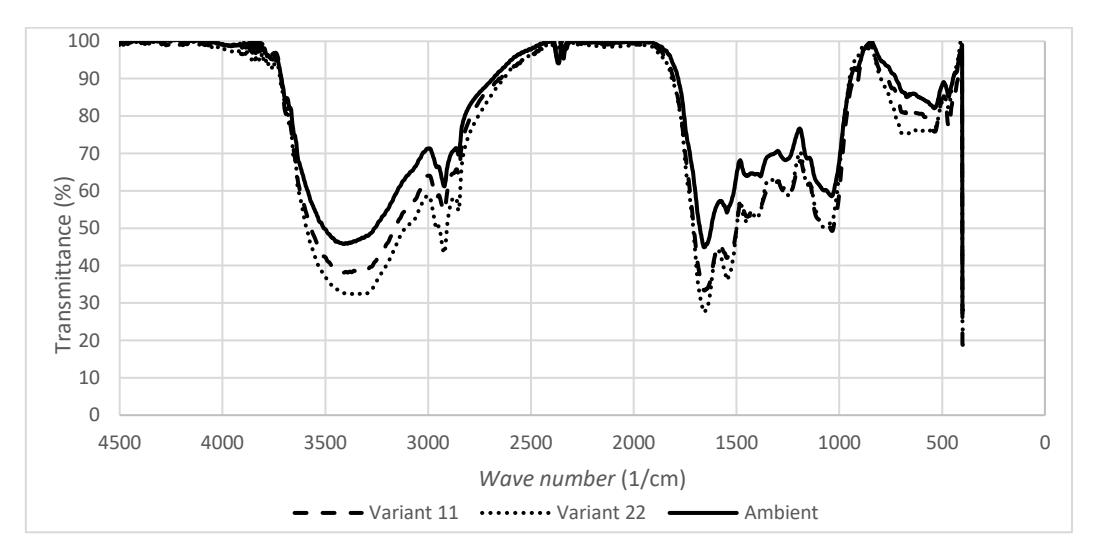
Figure 7 FTIR spectra of anode sediment.
These three variations (A, 11, and 22) showed similar results, with the same constituent compounds but at different concentrations. In all three variations, reactions occurred that produced the same compounds, both electrochemically and biologically. The most dominant chemical bonds were carboxyl (-COOH), hydroxide (-OH), and amine (-NH). These three bonds indicate the formation of high levels of carboxylic acids and amino acids, like in the experiments done by He et al. [15]. These acidic compounds are believed to originate from lysed algae. They accumulate on the anode surface and are used as nutrients by microorganisms on the anode.
The concentration difference provided evidence that there were more dead microalgae cells in variation 22. On the other hand, variation A had the least organic content compared to the other two variations. As explained in Subsection 3.5, variation A may have longer illuminated periods within a single day, resulting in a thinner biofilm. Lower organic content on the anode surface may prove that the microalgae were receiving more illumination, thus indicating a lower death rate, based on experiments done by Kothapalli et al. [7].
Further Considerations
This research showed that PSMFCs have the potential to be applied as an alternative energy source for light buoy systems. The results achieved in this work are important for further research, such as optimization by modification of the configuration. One optimization process that can be done is the usage of other species of microalgae, other substrates (tofu wastewater), other electrode materials (graphite carbon), etc. The studied process can be investigated further to identify the optimum operating conditions. Then, this research can be implemented and substitute the existing energy source for buoy light systems. PSMFC systems can be produced on a large scale to achieve economic benefits in energy production, which is sustainable and environmentally friendly.
Conclusion
Phototrophic sediment microbial fuel cells (PSMFCs) can be used as alternative energy generator for maritime navigation systems. In this research, it was found that the electrode distance affects the oxygen gradient and the solution resistance within the cell. These two factors affect the OCP, current, and maximum power produced by the PSMFC. On the other hand, the illumination period affect the oxygen production on the cathode and is a factor that affects the OCP, current, and maximum power produced by the PSMFC. The highest OCP produced by the PSMFC was 205 mV under prolonged illumination, when most oxygen and electrons are produced. The highest current and power density was 5.3 μA and 0.684 mW/m2 respectively under prolonged unilluminated condition when the anode is in the most anaerobic state.