
Introduction
The design of a machine foundation requires more comprehensive considerations compared to regular foundations. Machines induce vibrations to both the foundation and the supporting soil. Although these vibrations may not reach the magnitude of blasting or earthquakes, they persist over longer durations and frequently exert adverse effects on nearby humans, structures, and the environment. Consequently, precise prediction of the dynamic behavior of a machine foundation system is of the utmost importance.
There are three groups of dynamic analysis methods: lumped mass, half space, and numerical methods. Researchers have recommended procedures for the prediction of behavior of machine foundations [1-14]. The first method combines mass, spring, and damping elements to model the behavior of both soil and foundation. The second method employs the theory of the elastic half space and was developed to account for wave distribution in elastic and viscoelastic materials [15, 16]. In the third method, a numerical approach is adopted, where elements are discretized into subdomains or smaller parts. This method simultaneously solves the governing equations of equilibrium, compatibility, and constitutive relations for all components to determine the required parameters. Two current well-known numerical methods are the finite element method (FEM) and the boundary element method (BEM).
This paper discusses the behavior of two types of foundations, a block foundation and a pile group foundation, situated on residual soil. The behavior was analyzed through the application of two different methods: lumped
Copyright ©2024 Published by IRCS - ITB J. Eng. Technol. Sci. Vol. 56, No. 2, 2024, 244-265 ISSN: 2337-5779 DOI: 10.5614/j.eng.technol.sci.2024.56.2.6
mass modeling using DYNA, and FEM using ABAQUS. The results from both methods are presented in this paper to enhance comprehension.
Traditionally, design of machine foundation relies heavily on static analysis to simplify the process and avoid complex computations. To ensure the safety of the foundation system, designers often increase the factor of safety by augmenting factors such as pile cap thickness, pile diameter, the number of piles, or, in essence, increasing the weight of the foundation system. Therefore, this paper presents an evaluation of dynamic behaviors of machine foundations by varying these factors as wells as the magnitude of dynamic load. This paper was written to provide a reference for analysis design practice of machine foundations, particularly in residual soils.
Machine Foundation Theory and Design Criteria
Vibration analysis of machine foundations assesses displacement and its impact on nearby humans, structures, facilities, and the environment. Common approaches to solving machine foundation problems include:
1. Lumped Mass Model
Lumped mass modeling offers a problem-solving approach in foundation dynamics by simplifying complex problems into single or multi-degree of freedom systems. This approach addresses key components such as mass, stiffness, and damping. The mathematical model is represented as a differential equation, which can be solved either through closed-form analytical methods or numerical techniques. Figure 1 provides an illustration of foundation idealization and its practical application using a lumped mass model (LMM). In addition, mass is assumed to be accumulated at one node or several nodes. The degree of freedom of a node is determined by evaluating any possibilities of displacement or rotation. A model with one degree of freedom has a diagonal stiffness-damping matrix. According to [10], non-diagonal members are equal to zero because the inertia force only works on each mass. Furthermore, if there is a rotational movement, the LMM does not have rotation moment of inertia as the mass is accumulated at a node that has no dimension. Thus, a mass matrix with a diagonal mass of moment of inertia equals zero. A detailed discussion regarding LMM can be found in [1,3- 5,7,10,17,18, etc]. Utilization of an LMM for the elastic half space beneath a dynamic foundation was utilized by [15] for a single degree of freedom with a disc-shaped foundation. A simplified model was also introduced by [16], where the stiffness and damping expressions were frequency-independent.
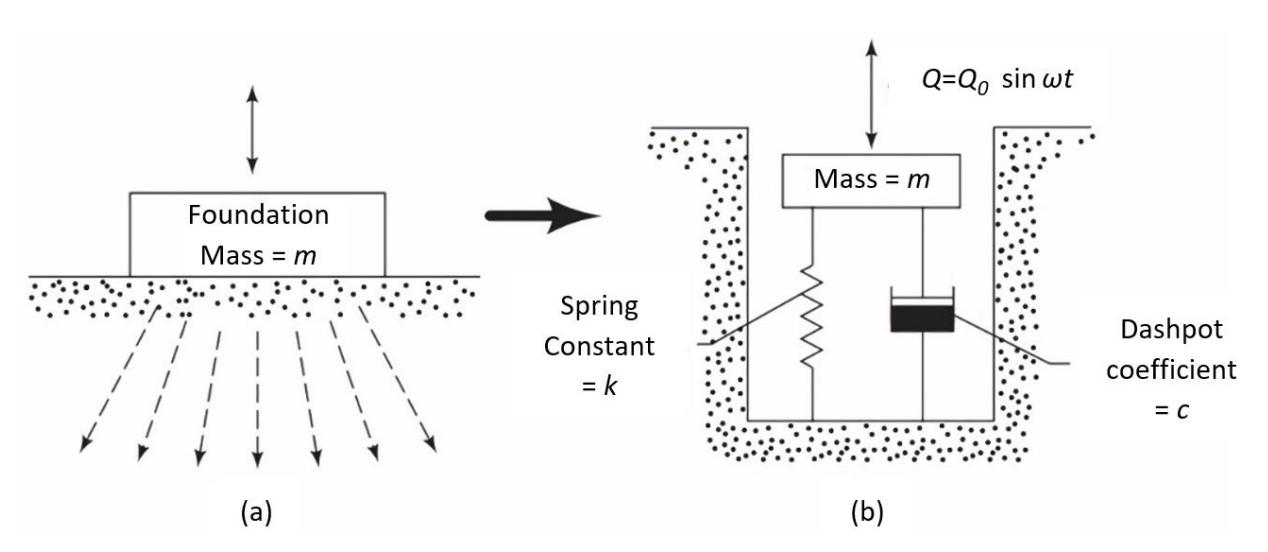
Idealization of LMM [17].
The application of an LMM has also been used for pile foundation analysis. For instance, [22] addresses the single pile solution in friction conditions, employing the mass-spring-dashpot idealization assumption. The use of complex dynamic stiffness and complex damping in the friction pile problem was solved by [23].
2. Finite Element Method
FEM is a widely used numerical procedure employed in various engineering disciplines, including stress analysis of structures, heat transfer, electromagnetism, and fluid flow. The basic concept of FEM is discretization, where an object is divided into several parts with a finite number. FEM aims to discretize the problem domain by subdividing it into smaller subdomains known as elements, each having a finite number of degrees of freedom. This discretization transforms the original differential equation into a set of approximate algebraic equations, which can subsequently be solved. The solutions can be obtained in either the time domain or the frequency domain, typically involving the handling of multiple degrees of freedom. In FEM, each element is connected to adjacent elements through nodes, forming a network. Then mathematical equations representing the object are developed based on these connections. FEM is a valuable tool for analyzing machine foundation problems, a task that has been undertaken by numerous researchers, including those mentioned in references [13] and [14]. FEM and shaking tables were also used to evaluate soil-structure interaction by [24]. Several researchers also simultaneously used lumped mass and FEM methods, as shown in [25] and [26].
3. Design Criteria
According to [19], machine foundation must not only satisfy design criteria for static load but also for dynamic load. The common design criteria are:
- a. Stable against sliding failure.
- b. No excessive settlement.
- c. No resonance.
- d. The vibration amplitude must not exceed the allowable value.
- e. The natural frequency of the foundation-engine-soil system must not be a multiple of the operating frequency of the machine.
- f. Vibration must not be harmful to surrounding humans, facilities, and the surrounding environment.
In addition to the mentioned criteria, the designer should also check any national or international standards related to machine vibration that need to be complied with.
Case Studies: Foundation Machines at Ulubelu & Duri
This paper presents two cases of machine foundations on stratified residual soil in Indonesia: a block foundation system in Duri, South Sumatra, and a group of piles in Ulubelu, Lampung. Each case was analyzed using both LMM and FEM. Subsequently, a design is proposed based on the analysis results. The construction of a block foundation and a pile group foundation was executed successfully in the respective sites. Continuous performance monitoring of these foundations was then conducted, demonstrating that both the machines and their respective foundations continued to operate effectively.
Analysis and Results
Analysis of a Block Machine Foundation
The soil investigation at the Ulubelu construction site showed the presence of approximately 3-m thick medium stiff clayey silt with an average N (Standard Penetration Test – SPT) value of 7, underlain by approximately 10 m thick very stiff silty clay with an average N value of 22. Below the silty clay layer, 10-m thick very dense silty sand with an average N value of 50 was found, underlain by very dense sandy silt with an average N value of 50 up to 30-m below the existing ground surface.
The constructed block machine foundation in Ulubelu was 18.98 m long, 9.36 m wide, and 2.5 to 3 m thick (top foundation). The block foundation was designed to support a generator with a static weight of 436 tons and an operation frequency of 3,000 rpm. This generator is supported by the block foundation via six concrete frame columns, as shown in Figure 2.
Block foundation model in LMM using Dyna.
LMM For Block Foundation
The software Dyna was utilized to evaluate the dynamic response of the block foundation in Figure 2 by LMM. The estimated relationship between frequency and translational/rotational displacements are presented in Figure 3.
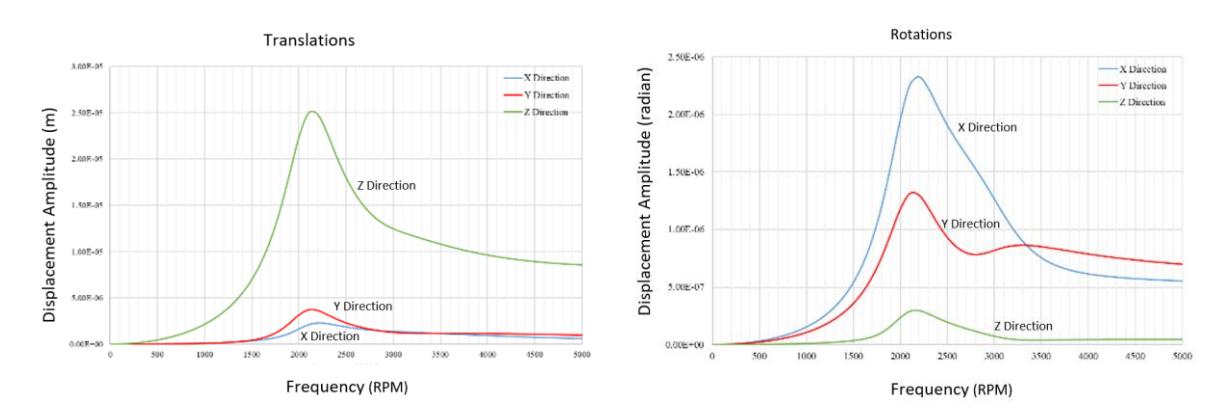
Estimated dynamic response of a block foundation using LMM.
In this figure, the predicted maximum amplitudes of translations on the X, Y, Z axes occur at frequencies of 2,100 rpm, 2,200 rpm and 2,100 rpm, respectively. This figure also shows that below a frequency of 3,300 rpm, the predicted maximum rotational displacement occurs about the X axis at approximately 2.3 x10⁻⁶ rad. For frequencies higher than that, the predicted maximum rotation occurs on the Y axis approximately at 8 x 10⁻⁷ rad.
Table 1 shows the corresponding translational/rotational displacements at the generator's operating frequency. At this frequency, the maximum displacement occurs in the vertical direction, whereas the largest rotation occurs about the X axis.
Table 1 Amplitude of displacements during machine operation of a block foundation using LMM.
| Mode | Axis | foperation (rpm) | Aoperation (m) |
|---|---|---|---|
| x | 3000 | 1.41 x 10⁻⁶ | |
| Translation | y | 3000 | 1.28 x 10⁻⁶ |
| z | 3000 | 1.25 x 10⁻⁶ | |
| Mode | Axis | foperation (rpm) | Aoperation (rad) |
| x | 3000 | 1.27 x 10⁻⁶ | |
| Rotation | y | 3000 | 8.17 x 10⁻⁷ |
FEM For Block Foundation
The FEM model of the block foundation using ABAQUS is presented in Figure 4. The ABAQUS software utilizes a lumped mass matrix, where the mass is lumped at the nodes of an element. ABAQUS utilizes edge boundary conditions, incorporating absorbing boundary conditions [21]. These conditions are applied to reduce wave back reflection within the computational domain. Figure 5 illustrates the estimated maximum amplitudes on three perpendicular axes, occurring at an approximate frequency of 121 rpm. Notably, the calculated amplitudes using LMM were approximately 1.6 to 2.0 times larger than those obtained with FEM. The analysis results revealed distinct resonance frequencies between LMM and FEM in the context of the block foundation. These variations can be traced back to multiple contributing factors, primarily stemming from the unique theoretical principles inherent to each method. Additionally, disparities arise from the distinct ways in which each method conceptualizes 'mass' at a nodal point, with FEM employing a mesh-based approach and LMM adopting a lumped-mass configuration.
Model of analysis using FEM.
Predicted dynamic response of block foundation using FEM.
Table 2 Predicted displacements at operating frequency of a block foundation: LMM and FEM.
| Mode | Axis | foperation (rpm) | Aoperation (LMM) (m) | Aoperation (FEM) (m) | Aoperation Ratio: LMM/FEM |
|---|---|---|---|---|---|
| X | 3,000 | 1.4060 x 10⁻⁶ | 8.570 x 10⁻⁷ | 1.6 | |
| Translation | Y | 3,000 | 1.2790 x 10⁻⁶ | 6.335 x 10⁻⁷ | 2.0 |
| Z | 3,000 | 1.2460 x 10⁻⁵ | 6.330 x 10⁻⁶ | 2.0 |
In order to evaluate the vibration's effect on nearby humans and structures, the predicted amplitudes were plotted on a Richart's chart [1] and the local Indonesian standard for machine foundation from the Ministry of Environment and Forestry [20], as shown in Figure 6. Based on this evaluation, the predicted displacements both using LMM and FEM were still within the tolerable limit.
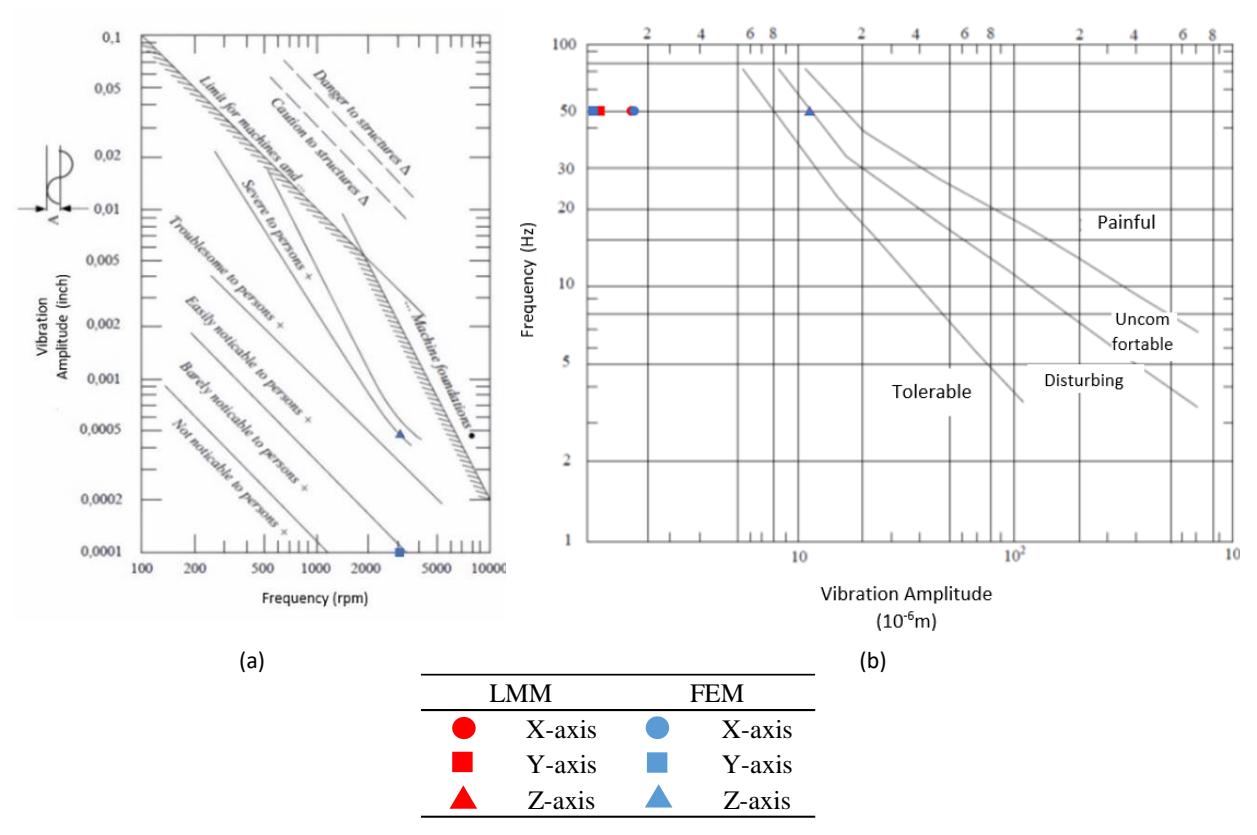
Evaluation of predicted vibrations based on (a) [1] and (b) [20].
Analysis of a Pile Group Machine Foundation
The second case was the design of a pile group foundation for supporting a 375-ton generator operating at a frequency of 500 rpm. This pile group consisted of twelve piles. Each pile was 0.4 m in diameter and 36 m long. This pile group supported a pile cap of 17.4 m long, 4.8 m wide, and 1.2 m thick. In order to reduce vibration, twenty pads, each consisting of a pair of springs, were installed underneath the generator.
The soil stratigraphy at the Duri site consisted of four main layers. From the surface to the end of boring, they were 3-m thick loose clayey sand with an average N of 5, 27-m thick medium dense sand with an average N value of 12, 10-m thick dense silty sand with an average N value of 35, and 20-m thick very dense clayey sand layer with an average N value of 49.
LMM For Group Pile
The lumped mass method was used for analyzing the pile group foundation in Duri (Figure 7). The predicted dynamic responses of the pile group foundation due to operating the generator are presented in Figure 8.
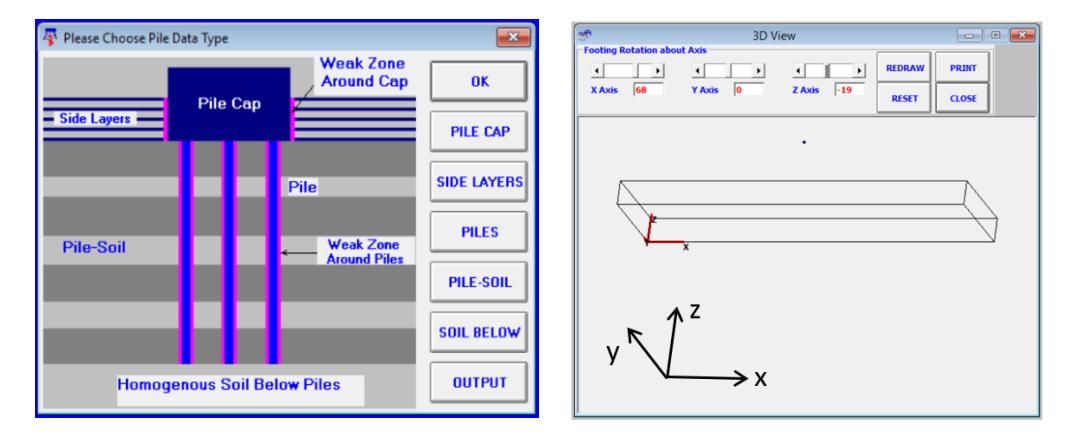
Model of analysis using LMM.
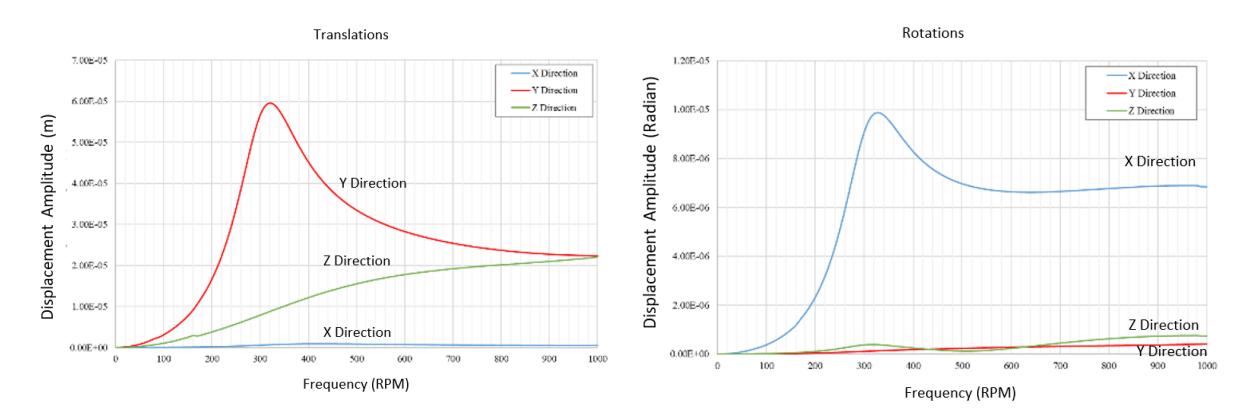
Predicted dynamic response of pile foundation using LMM.
Table 3 shows the corresponding translational/rotational displacements at the generator's operational frequency. At this frequency, the maximum displacement occurs in the Y horizontal direction, whereas the largest rotation occurs about the X axis.
| Mode | Axis | foperation (rpm) | Aoperation (m) |
|---|---|---|---|
| x | 500 | 1.41 x 10⁻⁷ | |
| Translation | y | 500 | 1.28 x 10⁻⁵ |
| z | 500 | 1.25 x 10⁻⁵ | |
| Mode | Axis | foperation (rpm) | Aoperation (rad) |
| x | 500 | 6.96 x 10⁻⁶ | |
| Rotation | y | 500 | 2.33 x 10⁻⁷ |
Table 3 Amplitude of displacements during machine operation by LMM
Based on the analysis result, the maximum amplitude of displacement on the Y axis occurs at a frequency of around 310 rpm. Amplitude of translation displacement on the X- and Z axis seem to be far above the observed frequency (i.e. > 1,000 rpm). The maximum amplitude of rotation around the X axis also occurs at a frequency of about 310 rpm.
FEM for a Group of Piles
The finite element model of the pile group and its predicted dynamic response are shown Figures 9 and 10, respectively. The analysis results show that the displacement amplitude on the X axis occurs at a frequency of ±30 rpm, and for the Y- and Z axes at ±23 rpm. Table 4 shows the corresponding translational displacements at the generator's operating frequency. At this frequency, the maximum displacement occurs in the Z vertical direction.
FEM model created using ABAQUS.
Computed Dynamic Response of Pile Foundation using FEM.
Table 4 Displacement amplitude of pile foundation at machine operating frequency using FEM.
| Mode | Axis | foperation (rpm) | Aoperation (m) |
|---|---|---|---|
| x | 500 | 1.41 x 10⁻⁶ | |
| Translation | y | 500 | 5.33 x 10⁻⁶ |
| z | 500 | 6.44 x 10⁻⁶ | |
The displacement amplitudes at the operating frequency of both LMM and FEM are presented in Table 5. The displacement amplitude ratios between LMM and FEM vary from 0.6 to 6.3, as presented in the table. FEM resulted in higher displacement in the X direction than that of LMM, whereas LMM resulted in higher displacement in the other directions. Similar to the findings in the block foundation analysis, the results for the pile foundation case also demonstrated distinct resonance frequencies between LMM and FEM. These variations can be ascribed to various contributing factors, notably the unique theoretical principles inherent in each method. Furthermore, the differences stem from how each method conceptualizes 'mass' at nodal points, with FEM employing a mesh-based approach and LMM opting for a lumped-mass configuration. The rigid vs flexible assumptions for the LMM and FEM, respectively, may also contribute to the results.
| Mode | Axis | foperation (rpm) | Aoperation LMM (m) | Aoperation FEM (m) | Amplitude Ratio (LMM/FEM) |
|---|---|---|---|---|---|
| x | 500 | 8.15 x 10⁻⁷ | 1.41 x 10⁻⁶ | 0.6 | |
| Translation | y | 500 | 3.35 x 10⁻⁵ | 5.33 x 10⁻⁶ | 6.3 |
| z | 500 | 1.55 x 10⁻⁵ | 6.44 x 10⁻⁶ | 2.4 |
Table 5 Predicted displacement amplitudes: FEM vs. LMM.
In order to assess the vibration's effect on nearby humans and structures, the predicted amplitude was evaluated using [1] and the local Indonesian standard for machine foundations issued by the Ministry of Environment and Forestry [20], as shown in Figure 11. According to [1], the predicted vibrations, while perceptible to individuals, remained within tolerable limits and fell within the permissible range specified in [20].
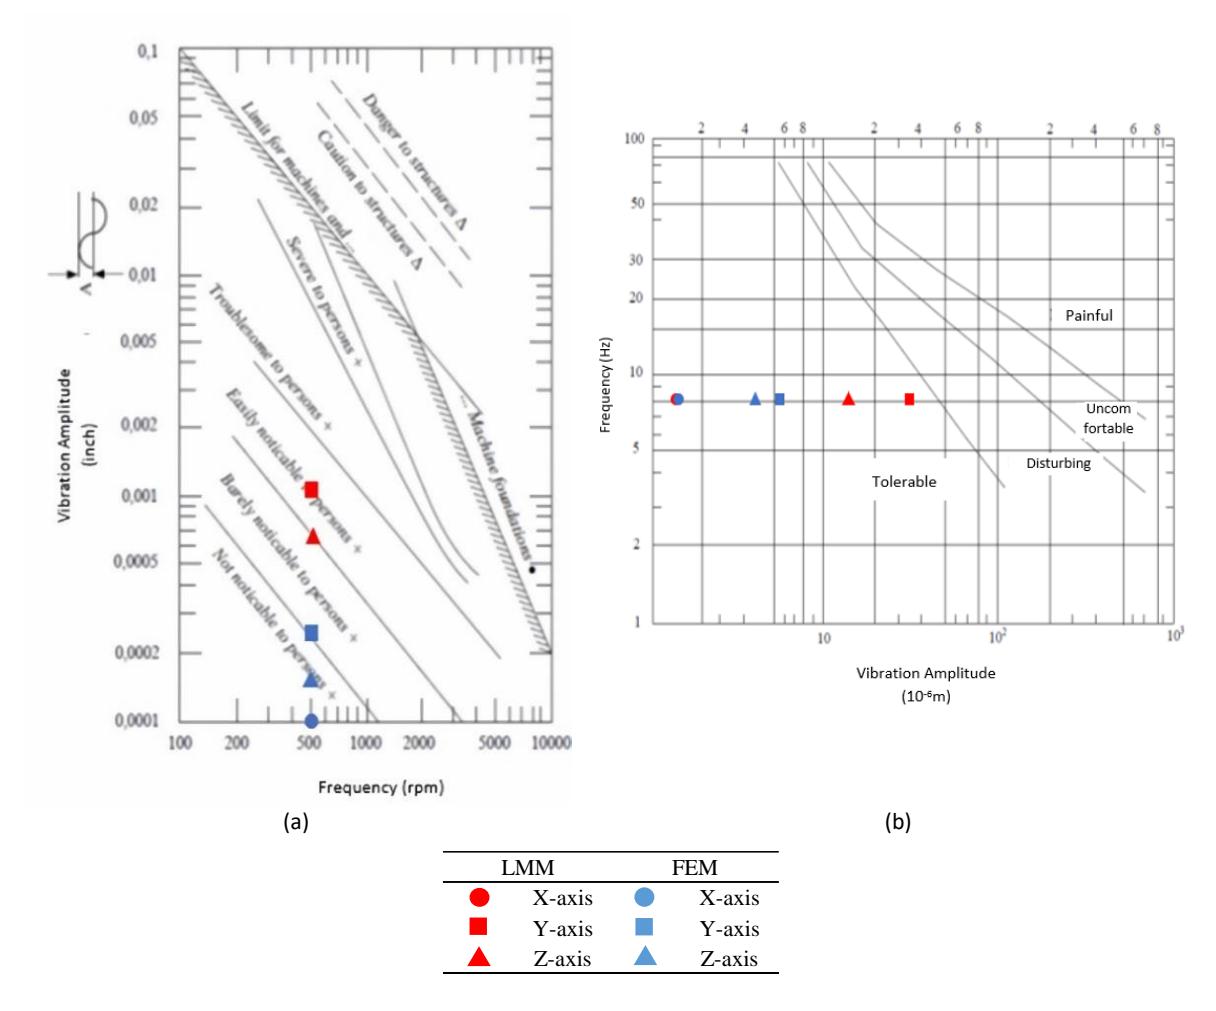
Evaluation of predicted vibrations based on (a) [1] and (b) [20].
Analysis of Parametric Study
As part of the design work, parametric studies were conducted using LMM and FEM for the pile group case in Duri. This study evaluated the effects of variations in pile cap thickness, pile diameter, number of piles, vertical dynamic load on the pile group foundation responses.
Pile Cap Thickness
The pile cap thickness was varied between 1.25 m, 1.50 m, 1.75 m, and 2.00 m. The relationship between pile thickness and maximum displacement, analyzed using the LMM on three axes, is depicted in Figure 12. It is important to emphasize that these values are associated with the machine's operating frequency. A summary of the maximum displacement associated with pile cap thickness using LMM is presented in Table 6. A quartermeter increment of pile cap thickness decreased the displacement amplitude by 7% to 8% on the X axis and 8% to 10% on the Y axis, whereas it increased the displacement amplitude about 0.1% to 0.5% on the Z axis increases.
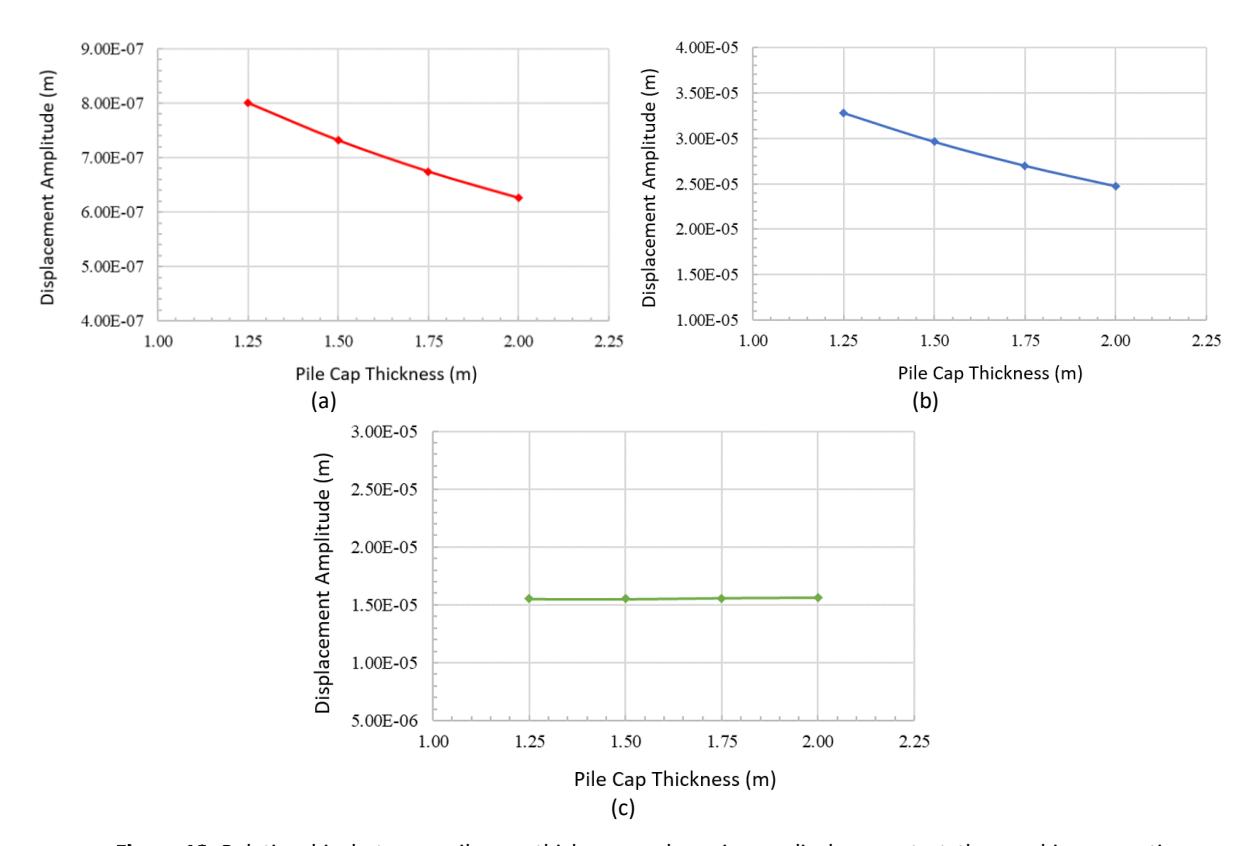
Relationship between pile cap thickness and maximum displacement at the machine operating frequency using LMM: (a) X, (b) Y, and (c) Z axes.
Table 6 Summary of pile cap thickness and associated displacement amplitude using LMM.
| Pile Cap | Displacement Amplitude | ||||
|---|---|---|---|---|---|
| Thickness | X axis | Y axis | Z axis | ||
| (m) | (m) | (m) | (m) | ||
| 1.25 | 8.00 x 10⁻⁷ | 3.28 x 10⁻⁵ | 1.55 x 10⁻⁵ | ||
| 1.50 | 7.32 x 10⁻⁷ | 2.96 x 10⁻⁵ | 1.55 x 10⁻⁵ | ||
| 1.75 | 6.75 x 10⁻⁷ | 2.70 x 10⁻⁵ | 1.56 x 10⁻⁵ | ||
| 2.00 | 6.27 x 10⁻⁷ | 2.48 x 10⁻⁵ | 1.56 x 10⁻⁵ | ||
| Pile Cap | Percentage | ||||
| Thickness | |||||
| Increment | X axis | Y axis | Z axis | ||
| 1.25 to 1.50 | 8.54% | 9.64% | 0.06% | ||
| 1.50 to 1.75 | 7.80% | 8.88% | -0.39% | ||
| 1.75 to 2.00 | 7.14% | 8.30% | -0.19% | ||
The relationship between pile cap thickness and displacement amplitude of the pile group foundation for each axis, analyzed using FEM at the operating frequency, is shown in Figure 13. Table 7 presents the effect of the thickness of the pile cap on the displacement amplitude of the machine foundation based on FEM analysis. According to this table, a quarter-meter increment of the pile cap thickness decreased the displacement
amplitude by ±1% in the X axis and by 1% to 4% on the Y axis, whereas it increased the displacement amplitude by about 4% to 7% on the Z axis.
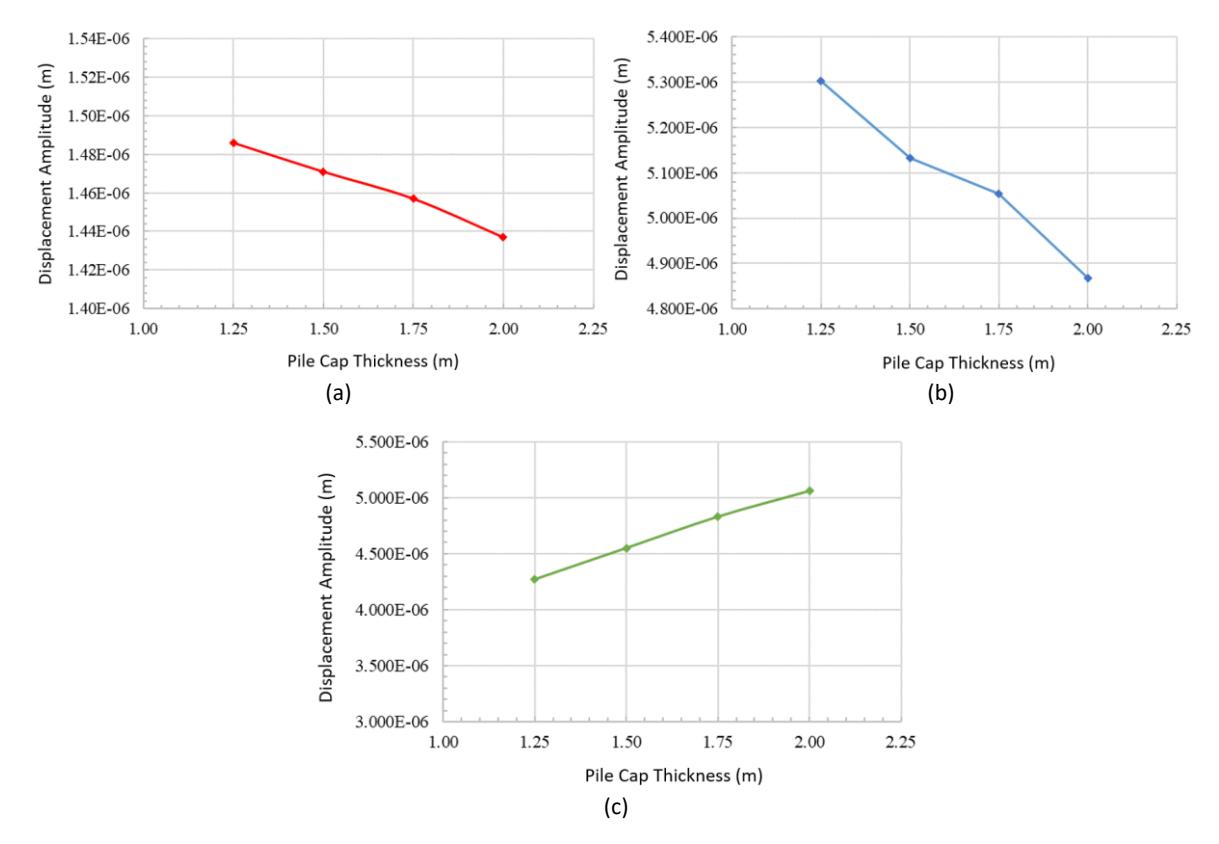
Relationship between pile cap thickness and maximum displacement at the machine operating frequency using FEM: (a) X, (b) Y, and (c) Z axes.
Table 7 Summary of pile cap thickness and associated displacement amplitude using FEM.
| Displacement Amplitude | ||||
|---|---|---|---|---|
| Pile Cap Thickness | X axis | Y axis | Z axis | |
| (m) | (m) | (m) | (m) | |
| 1.25 | 1.49 x 10⁻⁶ | 5.30 x 10⁻⁶ | 4.27 x 10⁻⁶ | |
| 1.50 | 1.47 x 10⁻⁶ | 5.13 x 10⁻⁶ | 4.55 x 10⁻⁶ | |
| 1.75 | 1.46 x 10⁻⁶ | 5.05 x 10⁻⁶ | 4.83 x 10⁻⁶ | |
| 2.00 | 1.44 x 10⁻⁶ | 4.87 x 10⁻⁶ | 5.06 x 10⁻⁶ | |
| Percentage | |||
|---|---|---|---|
| Pile Cap Thickness Increment | X axis | Y axis | Z axis |
| 1.25 to 1.50 | 1.01% | 3.19% | -6.56% |
| 1.50 to 1.75 | 0.95% | 1.56% | -6.15% |
| 1.75 to 2.00 | 1.37% | 3.67% | -4.76% |
Comparison of the results given by LMM and FEM is presented in Figure 14. Between these methods, it is obvious that an increase in pile cap thickness had significant different displacement amplitudes on the Y axis. In this case, FEM's displacement was significantly larger than that of LMM. However, it is apparent that the disparity between these methods diminished as the pile cap thickness increased. The FEM method, employed in this study, offers a significant advantage in accurately modeling the elastic plate, leading to more realistic predictions. Ultimately, this enhanced modeling capability contributes to the potential optimization of foundation design.
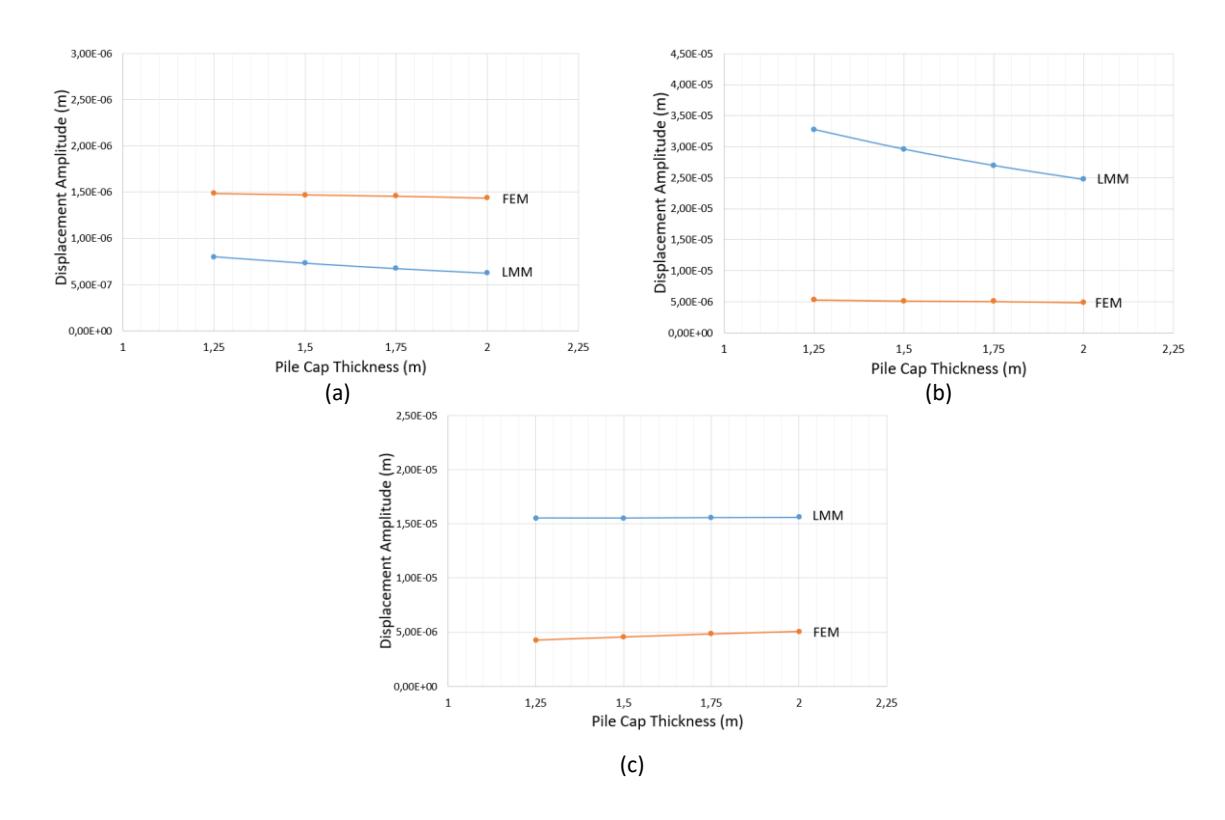
Comparison of LMM and FEM: effect of pile thickness on displacement amplitudes on the (a) X, (b) Y, and (c) Z axes.
Pile Diameter
The pile diameter was varied at 0.40 m, 0.45 m, 0.50 m, and 0.60 m. The relationship between the pile diameter and the maximum displacement, analyzed using LMM, on three perpendicular axes is shown Figure 15.
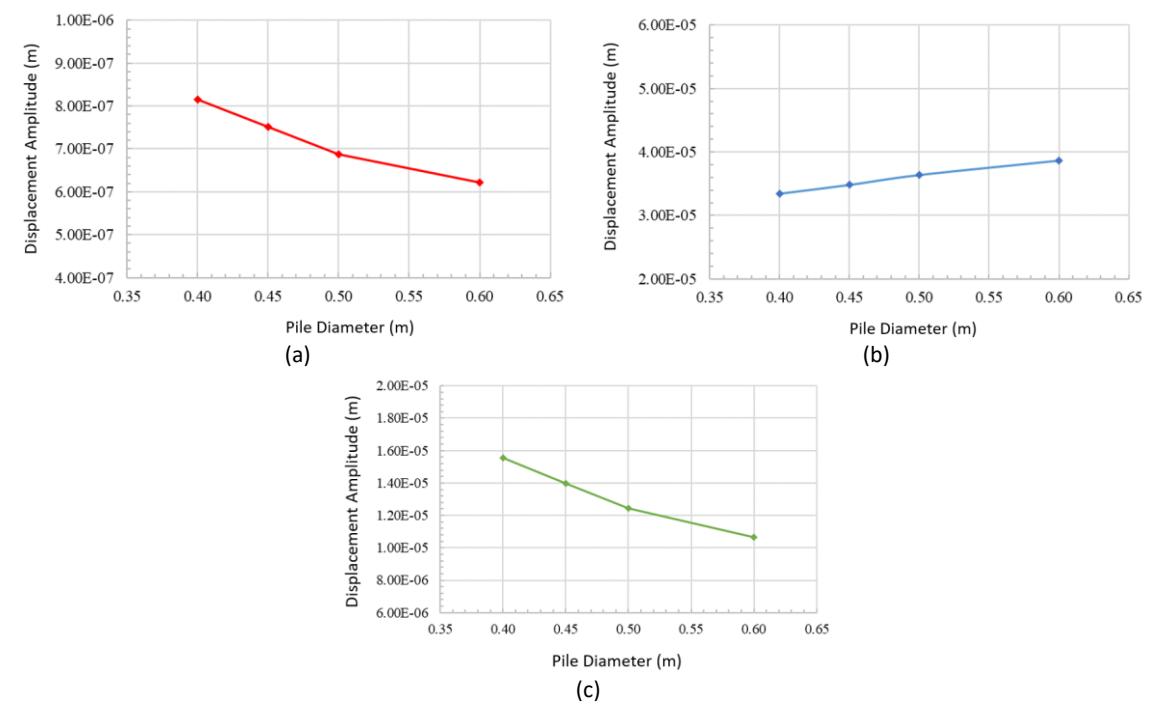
Relationship between pile diameter and maximum displacement at the machine operating frequency using LMM: (a) X, (b) Y, and (c) Z axes.
It should be noted that these values correspond to the machine's operating frequency. A summary of the maximum displacement associated with pile diameter using LMM is presented in Table 8. In general, a 5-cm increment in pile diameter decreased the displacement amplitude by 7% to 10% on the X axis and by 10% to 15% on the Z axis, whereas it increased the displacement amplitude by about 4% to 7% on the Y axis.
| Displacement Amplitude | ||||
|---|---|---|---|---|
| Pile Diameter | X axis | Y axis | Z axis | |
| (m) | (m) | (m) | (m) | |
| 0.40 | 8.15 x 10⁻⁷ | 3.35 x 10⁻⁵ | 1.55 x 10⁻⁵ | |
| 0.45 | 7.51 x 10⁻⁷ | 3.49 x 10⁻⁵ | 1.40 x 10⁻⁵ | |
| 0.50 | 6.88 x 10⁻⁷ | 3.64 x 10⁻⁵ | 1.25 x 10⁻⁵ | |
| 0.60 | 6.22 x 10⁻⁷ | 3.87 x 10⁻⁵ | 1.07 x 10⁻⁵ | |
| Pile Diameter | Percentage | |||
| Increment | X axis | Y axis | Z axis | |
| 0.40 to 0.45 | 7.92% | -4.15% | 10.05% | |
| 0.45 to 0.50 | 8.32% | -4.47% | 10.88% | |
| 0.50 to 0.60 | 9.57% | -6.23% | 14.38% | |
Table 8 Summary of pile diameter and associated displacement amplitude using LMM.
The relationship between pile diameter and displacement amplitude of the pile group for each axis, analyzed using FEM, at the operating frequency is shown in Figure 16. Table 9 presents the effect of pile diameter on displacement amplitude based on FEM analysis at the operating frequency. According to this table, a 5-cm increment of the pile diameter generally decreased the displacement amplitude by 7% to 14%, 1% to 3%, 2% to 6% on the X, Y, Z axes, respectively.
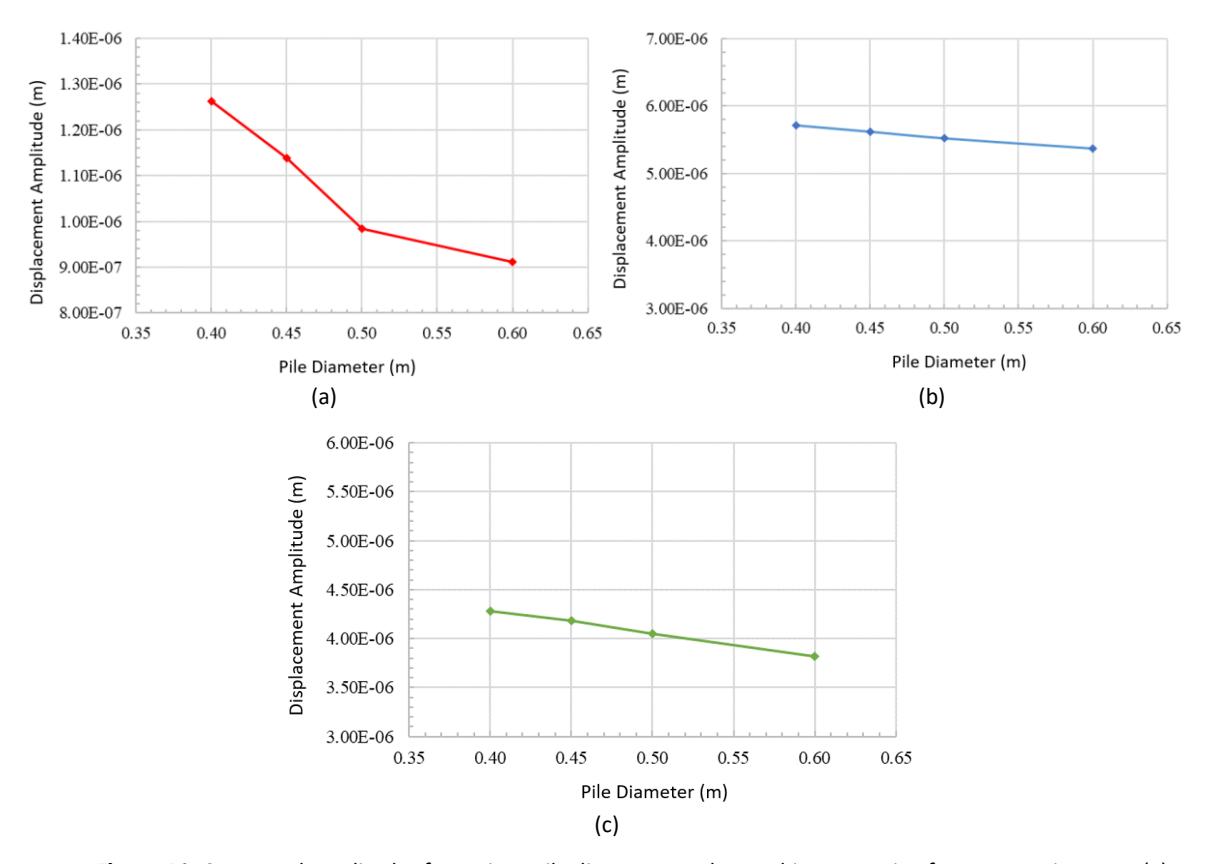
Computed amplitudes for various pile diameters at the machine operating frequency using FEM: (a) X, (b) Y, (c) Z axes.
Table 9 Computed displacement amplitudes for various pile diameters at the machine operating frequency using FEM and ratio of differential amplitudes.
| Displacement Amplitude | ||||
|---|---|---|---|---|
| Pile Diameter | X axis | Y axis | Z axis | |
| (m) | (m) | (m) | (m) | |
| 0.40 | 1.26 x 10⁻⁶ | 5.71 x 10⁻⁶ | 4.28 x 10⁻⁶ | |
| 0.45 | 1.14 x 10⁻⁶ | 5.62 x 10⁻⁶ | 4.18 x 10⁻⁶ | |
| 0.50 | 9.85 x 10⁻⁷ | 5.52 x 10⁻⁶ | 4.05 x 10⁻⁶ | |
| 0.60 | 9.12 x 10⁻⁷ | 5.38 x 10⁻⁶ | 3.82 x 10⁻⁶ | |
| Pile Diameter | Percentage | |||
| Increment | X axis | Y axis | Z axis | |
| 0.40 to 0.45 | 9.82% | 1.59% | 2.34% | |
| 0.45 to 0.50 | 13.49% | 1.69% | 3.11% | |
| 0.50 to 0.60 | 7.44% | 2.66% | 5.68% | |
A comparison of the parametric study of pile diameter, as provided by LMM and FEM, is presented in Figure 17. Notably, the differences in the results between these methods decreased with an increase in pile diameter on the X and Z axes, while the opposite was observed for the Y axis. It is important to highlight that the disparities between the results of these methods were more pronounced on the Y axis.
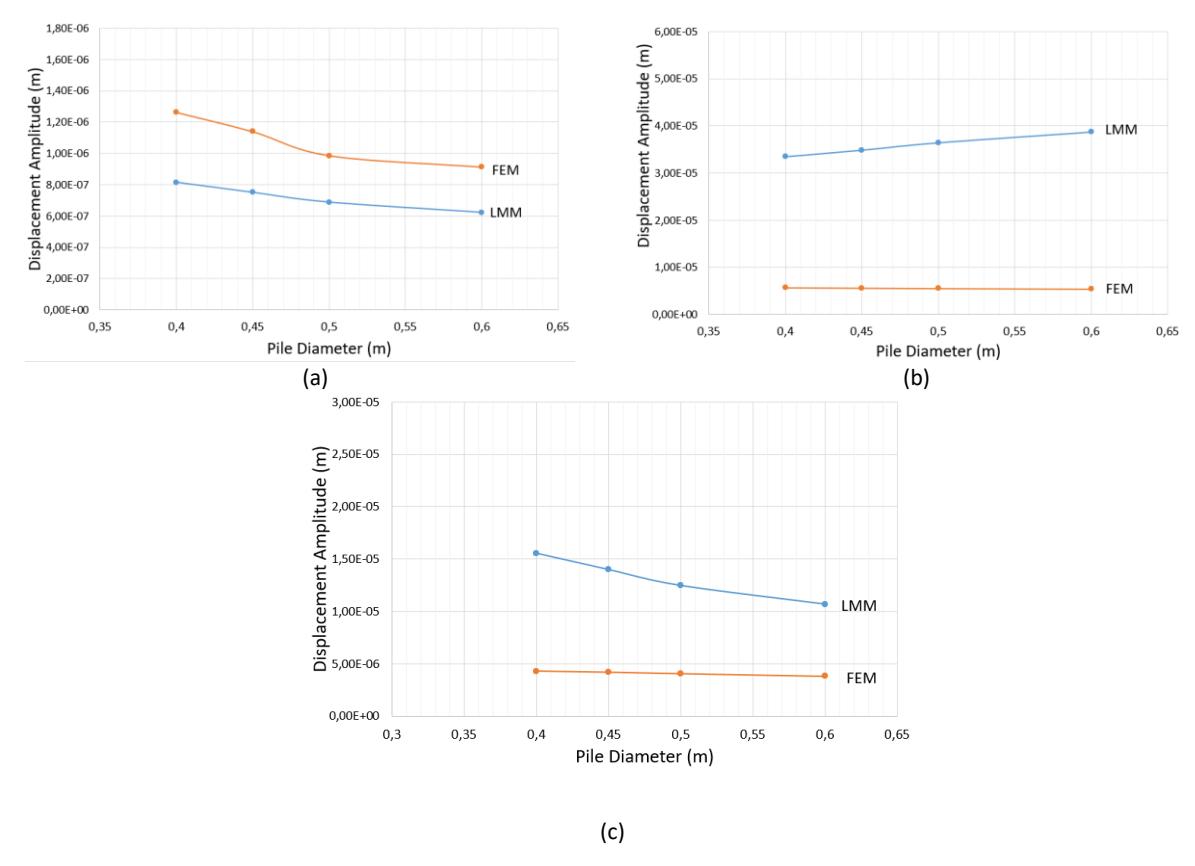
Comparison of LMM and FEM: pile diameters on displacement amplitudes on the (a) X, (b) Y, and (c) Z axes.
Number of Piles
The number of piles was varied at 17, 20, 23, and 26. The configuration of each pile group is shown in Figure 18. The relationship between the number of piles and the maximum displacement, analyzed using LMM, on the three axes is shown in Figure 19.
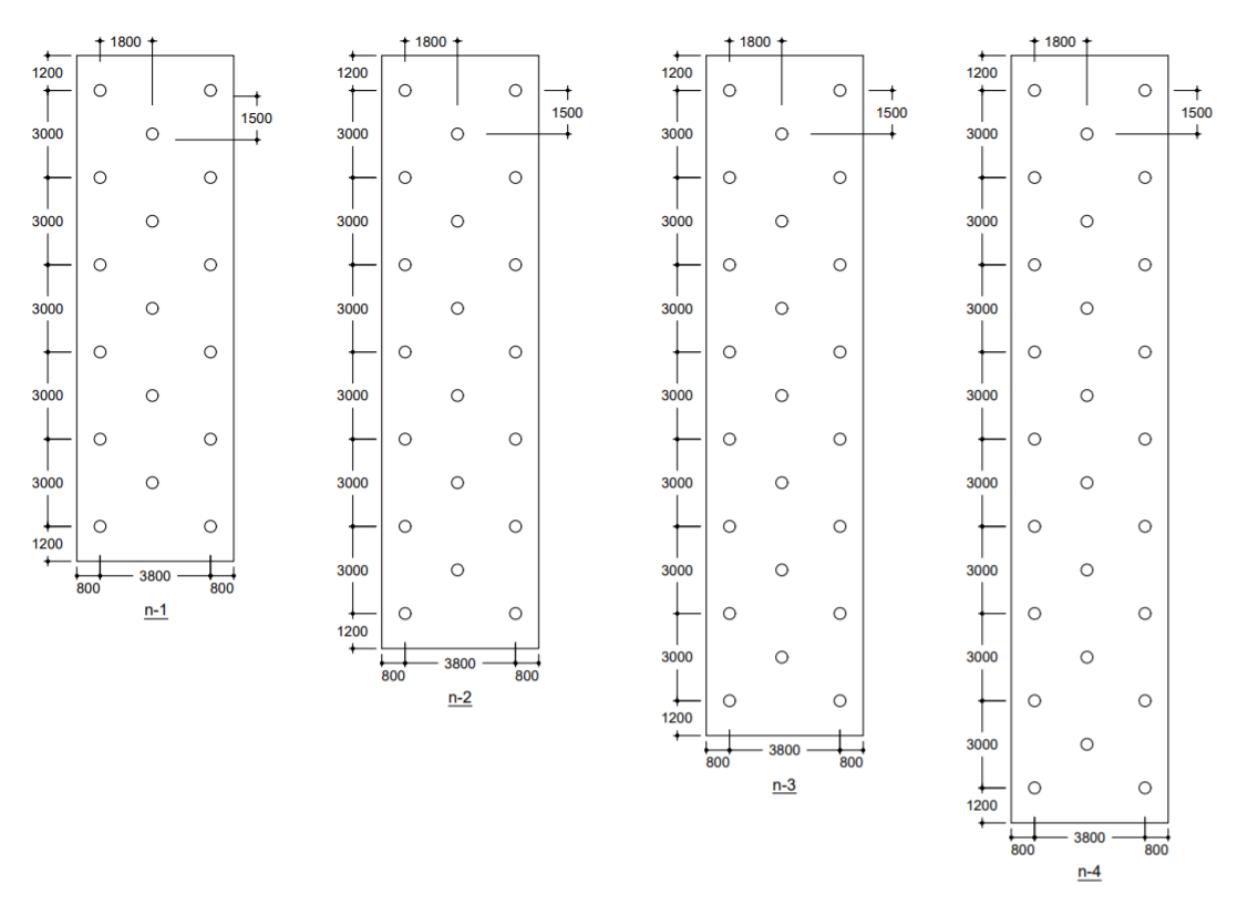
Pile group configuration for parametric study.
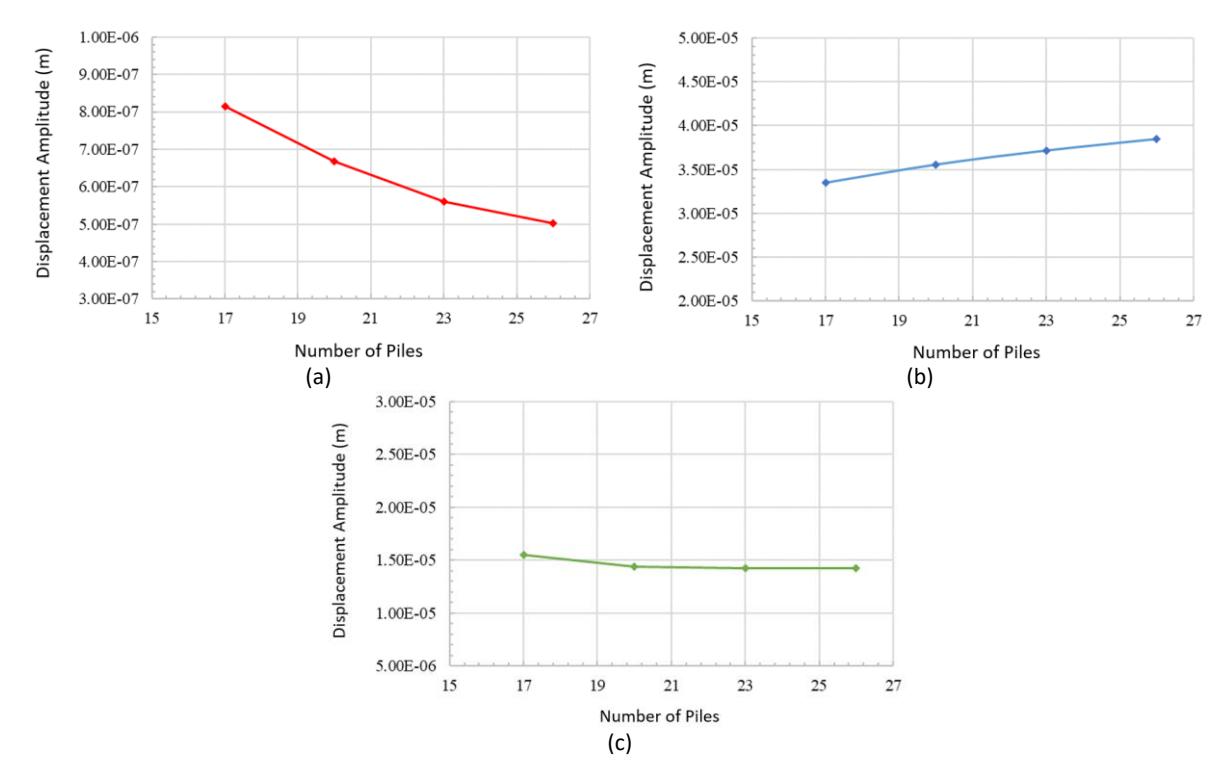
Computed displacement amplitudes for various numbers of piles at the machine operating frequency using LMM: (a) X, (b) Y, and (c) Z axes.
Importantly, these values correspond to the machine's operating frequency. A summary of the maximum displacement associated with the number of piles is provided in Table 10. A three-pile increment decreased the displacement amplitude by 10% to 18% on the X axis and by 0% to 7% on the Z axis. Notably, the effect of an increased number of piles on the displacement amplitude on the Z axis was less pronounced compared to the X axis. It is interesting to observe that the displacement amplitude slightly increased with the number of piles, i.e., about 3% to 6%. Consequently, according to the LMM analysis, the impact of and increased number of piles on the displacement amplitudes on the Y and Z axes appears to be insignificant.
Table 10 Computed displacement amplitudes for various numbers of piles at the machine operating frequency on each axis using LMM and the ratio of increment amplitude.
| Displacement Amplitude | ||||
|---|---|---|---|---|
| Number of Piles | X axis | Y axis | Z axis | |
| (m) | (m) | (m) | (m) | |
| 17 | 8.15 x 10⁻⁷ | 3.35 x 10⁻⁵ | 1.55 x 10⁻⁵ | |
| 20 | 6.67 x 10⁻⁷ | 3.56 x 10⁻⁵ | 1.44 x 10⁻⁵ | |
| 23 | 5.61 x 10⁻⁷ | 3.72 x 10⁻⁵ | 1.42 x 10⁻⁵ | |
| 26 | 5.03 x 10⁻⁷ | 3.85 x 10⁻⁵ | 1.42 x 10⁻⁵ | |
| Pile Number | Percentage | |||
| Increment | X axis | Y axis | Z axis | |
| 17 to 20 | 18.17% | -6.18% | 7.28% | |
| 20 to 23 | 15.95% | -4.50% | 1.11% | |
| 23 to 26 | 10.31% | -3.53% | 0.00% | |
Figure 20 illustrates the relationship between the number of piles and the displacement amplitudes of the pile group for each axis, as analyzed using FEM at the operating frequency. This figure is summarized in Table 11. According to this table, a three-pile increment generally decreased the displacement amplitude, ranging from 11% to 28% on the X axis, 4% to 13% on the Y axis, and 0% to 42% on the Z axis.
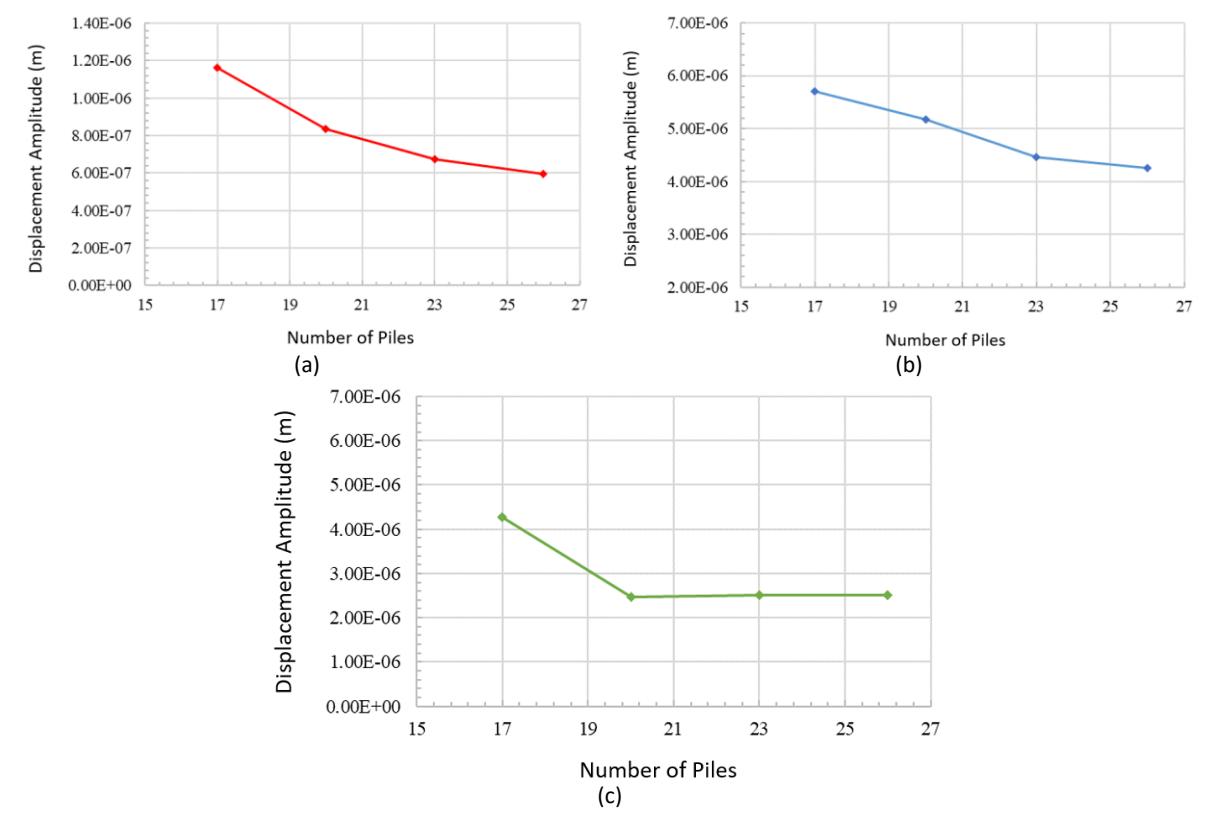
Computed displacement amplitudes for various numbers of piles at the machine operating frequency using FEM: (a) X, (b) Y, and (c) Z axes.
| Table 11 Computed displacement amplitudes for various numbers of piles at the machine operating | |
|---|---|
| frequency using FEM on each axis and ratio of increment amplitude. |
| Displacement Amplitude | ||||
|---|---|---|---|---|
| Number of Pile | X axis | Y axis | Z axis | |
| (m) | (m) | (m) | (m) | |
| 17 | 1.16 x 10⁻⁶ | 5.71 x 10⁻⁶ | 4.28 x 10⁻⁶ | |
| 20 | 8.37 x 10⁻⁷ | 5.17 x 10⁻⁶ | 2.46 x 10⁻⁶ | |
| 23 | 6.74 x 10⁻⁷ | 4.46 x 10⁻⁶ | 2.52 x 10⁻⁶ | |
| 26 | 5.94 x 10⁻⁷ | 4.25 x 10⁻⁶ | 2.52 x 10⁻⁶ | |
| Pile Number | Percentage | |||
| Increment | X axis | Y axis | Z axis | |
| 17 to 20 | 27.93% | 9.49% | 42.52% | |
| 20 to 23 | 19.46% | 13.78% | -2.44% | |
| 23 to 26 | 11.88% | 4.72% | 0.00% | |
A comparison of the parametric study results for the number of piles, as provided by LMM and FEM, is presented in Figure 21. Notably, the difference in results between these methods decreased with an increase in the number of piles on the X axis, while the opposite trend can be observed on the Y and Z axes. It should be noted that the disparities in results between these methods was more pronounced on the Y axis.
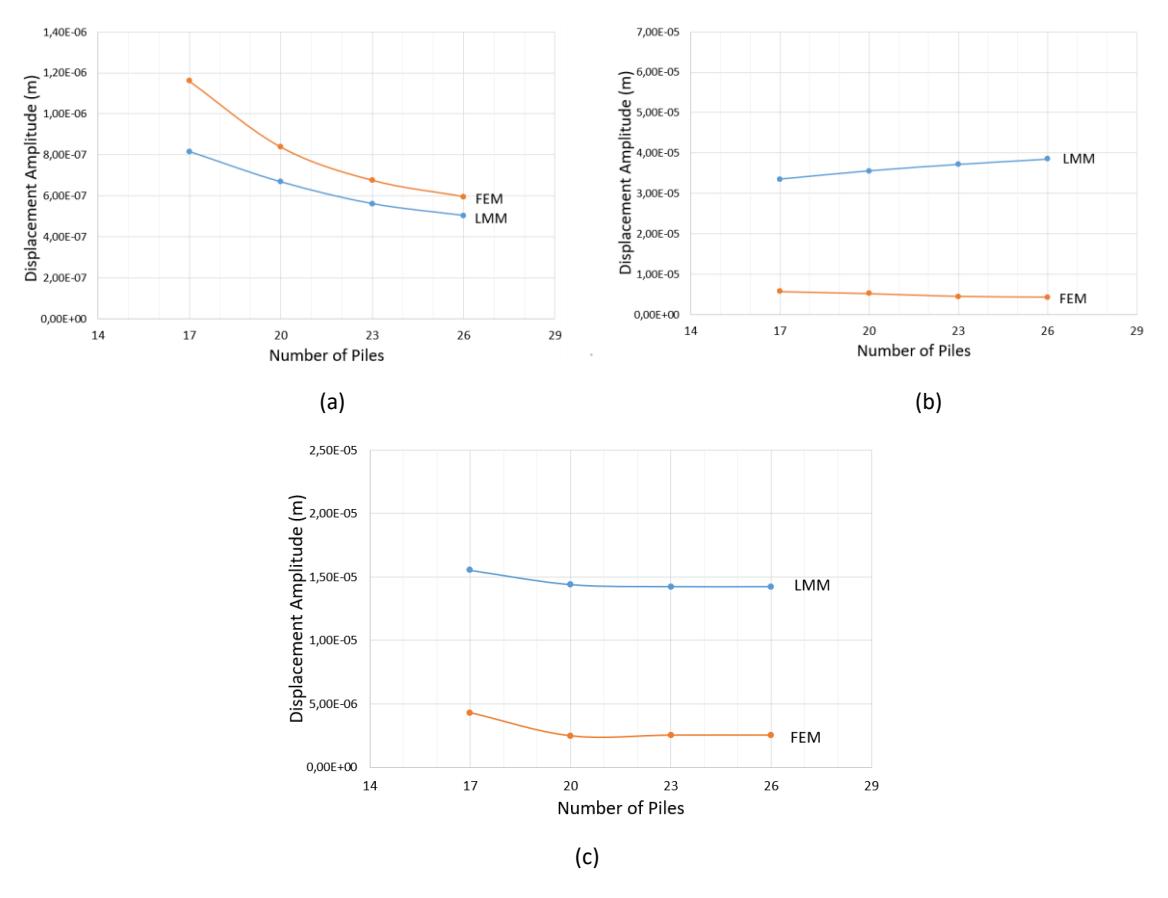
Comparison of computed displacement amplitudes for various diameters of piles using LMM and FEM: (a) X, (b) Y, and (c) Z axes.
Dynamic Loading
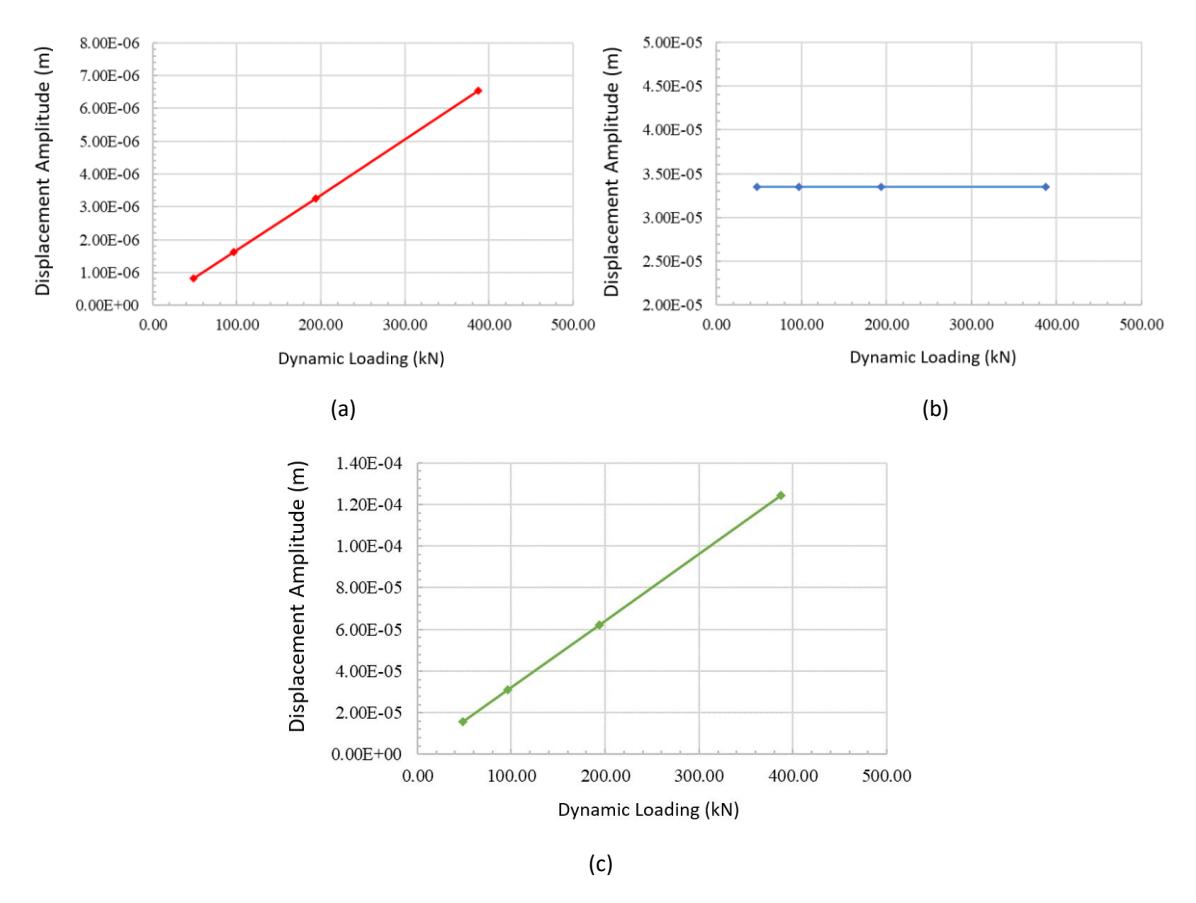
A parametric study examining the effect of vertical dynamic loads on the amplitude displacement was also performed by increasing the load by a factor of two. The relationship between vertical dynamic loads and their maximum displacements, analyzed using LMM, on three perpendicular axes at the machine operating frequency is shown in Figure 22. Table 12 summarizes the vertical dynamic loads and their corresponding maximum amplitudes, analyzed using LMM. Generally, increasing the load by a factor of two resulted in doubling the displacement amplitude on the X and Z axes, while it had a negligible impact on the displacement amplitude on the Y axis.
Computed amplitudes (by ABAQUS) for various vertical dynamic loads at the machine operating frequency: (a) X, (b) Y, (c) Z axes.
Table 12 Computed displacement amplitudes for various dynamic loadings at the machine operating frequency on each axis using LMM and computed ratio of increment of displacement amplitude.
| Displacement Amplitude | ||||
|---|---|---|---|---|
| Dynamic Loading | X axis | Y axis | Z axis | |
| (kN) | (m) | (m) | (m) | |
| 48.40 | 8.15 x 10⁻⁷ | 3.35 x 10⁻⁵ | 1.55 x 10⁻⁵ | |
| 96.80 | 1.63 x 10⁻⁶ | 3.35 x 10⁻⁵ | 3.11 x 10⁻⁵ | |
| 193.60 | 3.27 x 10⁻⁶ | 3.35 x 10⁻⁵ | 6.22 x 10⁻⁵ | |
| 387.20 | 6.53 x 10⁻⁶ | 3.35 x 10⁻⁵ | 1.24 x 10⁻⁴ | |
| Dynamic Loading | Percentage | |||
| Increment | X axis | Y axis | Z axis | |
| 48.40 to 96.80 | -100.27% | 0.00% | -100.19% | |
| 96.80 to 193.60 | -100.00% | 0.00% | -100.03% | |
| 193.60 to 387.20 | -99.97% | 0.00% | -100.03% | |
Figure 23 illustrates the relationship between the magnitude of the vertical dynamic loads and displacement amplitudes of the pile group for each axis, as analyzed using FEM at the operating frequency. A summary of this data is provided in Table 13. According to the table, increasing the load by a factor of two resulted in a notable increase in displacement amplitude, ranging from 22% to 108% on the X axis and from 64% to 99% on the Z axis.
However, doubling the vertical loads yielded an insignificant increase in displacement amplitude on the Y axis (i.e. less than 2%).
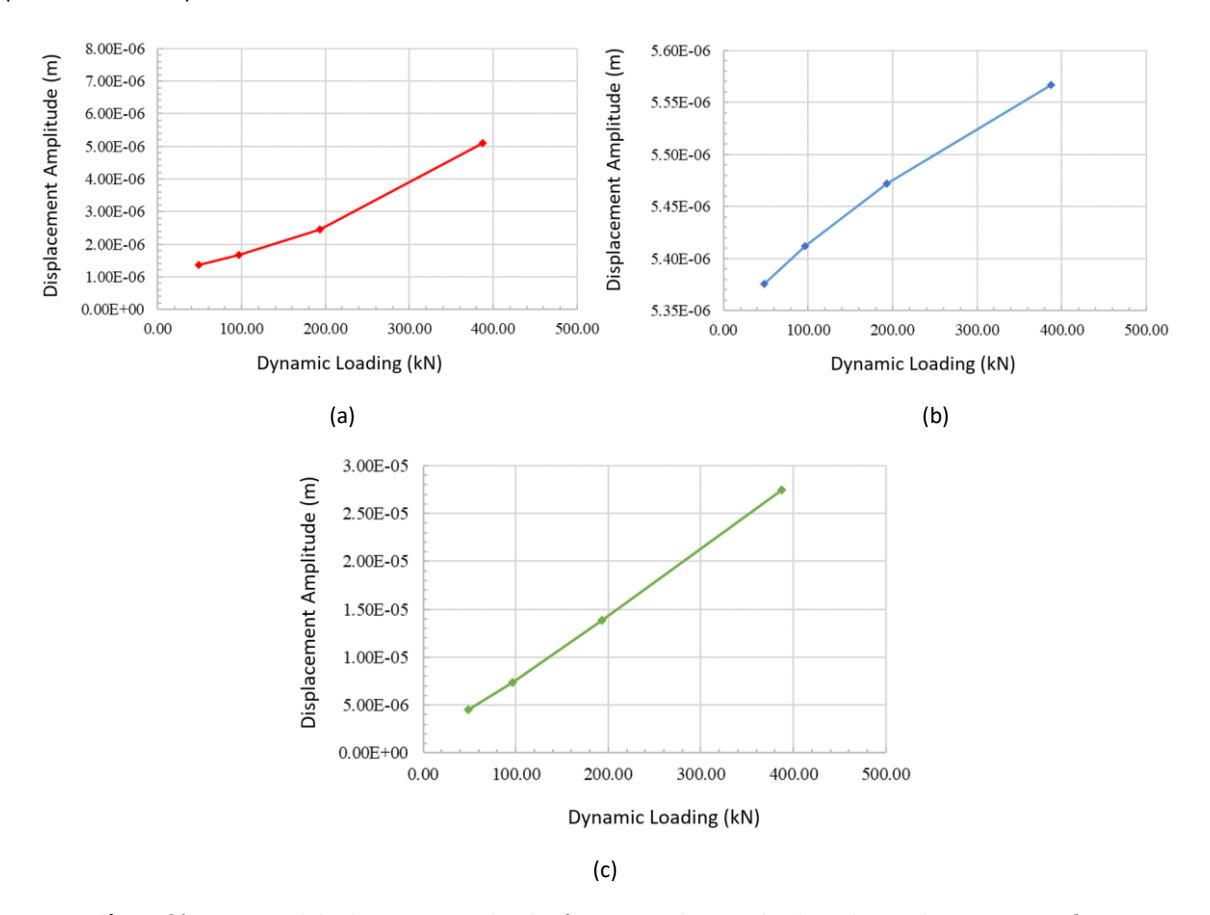
Computed displacement amplitudes for various dynamic loads at the machine operating frequency using FEM: (a) X, (b) Y, and (c) Z axes.
Table 13 Computed displacement amplitudes for various dynamic loads at the machine operating frequency on each axis using FEM and ratio of increment displacement amplitude.
| Dynamic Loading | Displacement Amplitude | ||
|---|---|---|---|
| X axis | Y axis | Z axis | |
| (kN) | (m) | (m) | (m) |
| 48.40 | 1.37 x 10⁻⁶ | 5.38 x 10⁻⁶ | 4.51 x 10⁻⁶ |
| 96.80 | 1.68 x 10⁻⁶ | 5.41 x 10⁻⁶ | 7.41 x 10⁻⁶ |
| 193.60 | 2.46 x 10⁻⁶ | 5.47 x 10⁻⁶ | 1.38 x 10⁻⁵ |
| 387.20 | 5.11 x 10⁻⁶ | 5.57 x 10⁻⁶ | 2.74 x 10⁻⁵ |
| Dynamic Loading | Percentage | ||
| Increment | X axis | Y axis | Z axis |
| 48.40 to 96.80 | -22.39% | -0.67% | -64.30% |
| 96.80 to 193.60 | -46.37% | -1.11% | -86.64% |
| 193.60 to 387.20 | -107.52% | -1.73% | -98.41% |
Comparison of the parametric study result for vertical dynamic loads given by LMM and FEM is presented in Figure 24. The differences in results between these methods decreased with increase in pile diameter on the X axis. For the displacement amplitude on the X axis, at low vertical load, the FEM gave a slightly larger amplitude than LMM. However, as the load increased, LMM gave larger displacements than FEM. It can also be observed that the relationship between vertical load and displacement was parabolic for FEM and linear for LEM on this axis. For the displacement amplitude on the Y axis, LMM resulted in a displacement that was seven times as large than that of FEM. On the Z axis, the LMM displacement increased more significantly with vertical load compared to FEM.
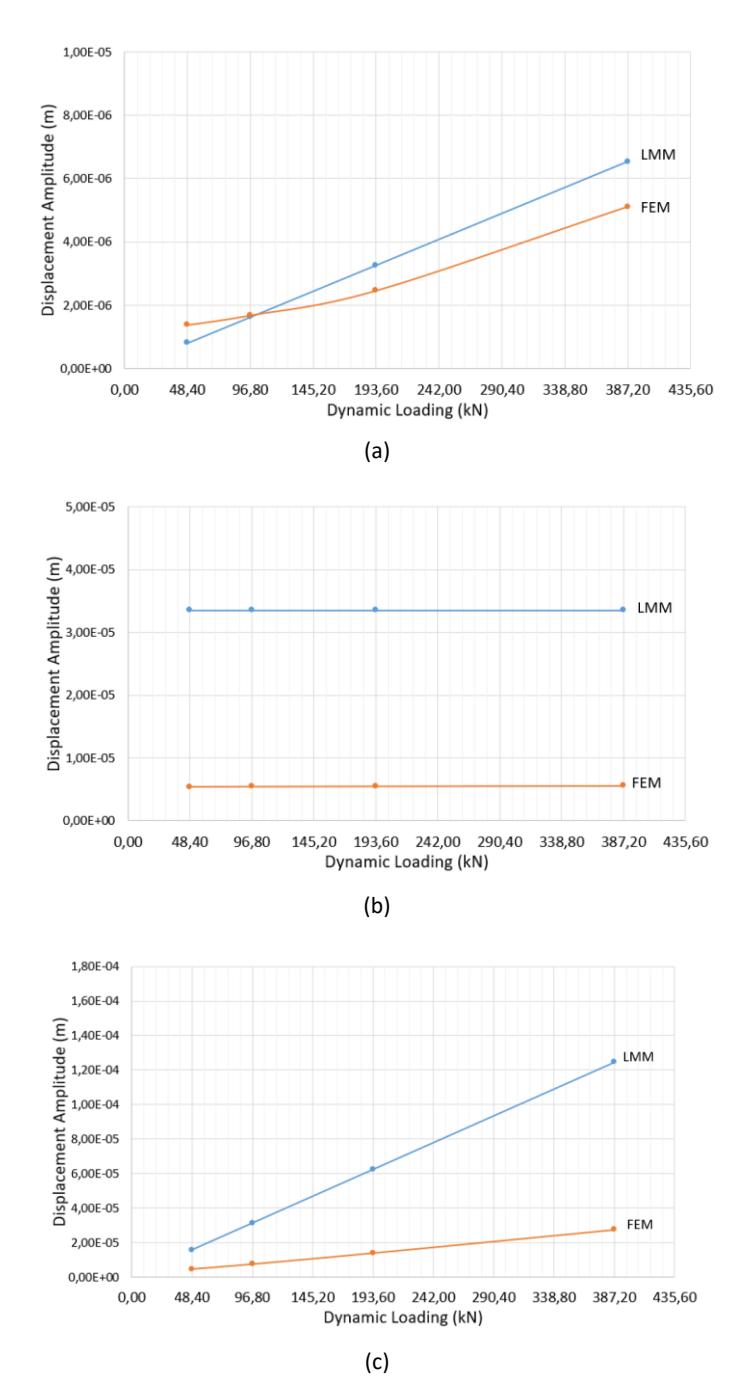
Comparison of computed displacement amplitudes for various dynamic loads using LMM and FEM: (a) X, (b) Y, and (c) Z axes.
Summary and Conclusions
A study of the dynamic responses of machine foundations on stratified residual soils in Duri and Ulubelu, Indonesia was presented in this paper. This study encompassed two distinct foundation types: a block foundation and a pile group foundation. Each foundation type was analyzed using DYNA as the LMM and ABAQUS as the FEM. A set of parametric studies was also performed to evaluate the effects of pile thickness, pile diameter, number of piles, and vertical load on the displacement amplitude.
This study demonstrated the versatility of LMM and FEM in modeling a wide range of complex machine foundations. Factors such as flexibility versus rigidity, foundation geometry, and foundation type play pivotal roles in shaping the disparities in the predicted dynamic responses between these methods. The analysis results also revealed that LMM and FEM yield different resonance frequencies for similar study cases. These differences may be attributed to several contributing sources, namely each method has its own basic theoretical principle and how each method assumes 'mass' in nodal points (i.e., mesh for the FEM and lump mesh for the LMM). In addition, the LMM models the foundations as rigid elements, while FEM employs flexible elements. Consequently, the more flexible element model exhibits a more elastic behavior, leading to a lower resonance frequency for the machine foundation system in FEM compared to LMM.
An increase in the thickness of the pile caps has a notable effect of reducing the displacement amplitude in both the x and the y direction when employing both LMM and FEM for analysis. However, it is important to highlight that the displacement in the z direction remains relatively unaffected when employing the LMM method. Similarly, an increase in the diameter of the pile leads to reduced displacement amplitudes in both the x and the y direction with both LMM and FEM. The only exception is the y direction displacement amplitude in the case of the LMM method. Furthermore, increasing the number of piles results in decreased displacement amplitudes with both LMM and FEM, except for the y direction displacement amplitude with the LMM method.
The analysis results demonstrated several noteworthy trends. In the case of a block foundation, both LMM and FEM yielded results that were in good agreement. However, it is worth noting that LMM predicted slightly larger deformations compared to FEM. On the other hand, for the pile group case, the LMM predicted significantly larger deformations than FEM, particularly in the y and the z direction, whereas the difference in the x direction (i.e. the most rigid axis) was less pronounced. This disparity can be attributed to FEM's ability to model the foundation's flexibility more realistically, resulting in better prediction of its natural frequencies.
Acknowledgements
This paper was written based on a research project that was financially supported by ITB through a P3MI grant. This research project was also part of Wim Ramartsa Ary's master study at ITB. The author would like to thank Dr. M. Hesham El Naggar of Geotechnical Research Centre at Western University, Canada for his permission to use Dyna 5. Any opinions, findings, conclusions, and recommendations presented in this paper are those of the author and do not necessarily reflect the views of any supporting institutions.