
Introduction
In 2021, around 28% of the overall energy usage in the United States was dedicated to the transportation of individuals and products between different locations. In the United States, gasoline is the primary fuel used for transportation, with distillate fuels (mostly diesel fuel) and jet fuel following closely behind [1]. Gasoline at refineries originates from many different processes, including crude oil steaming, catalytic cracking, catalytic reforming, hydrocracking, and alkylation [2]. The fluid catalytic cracking (FCC) process employs a zeolite-based catalyst as the main agent to turn petroleum into gasoline. It also utilizes an active matrix to pre-crack large hydrocarbon molecules, enabling them to penetrate the smaller zeolite pores. Additionally, filler and binder components are used. Zeolite is the main catalyst employed in the conversion of petroleum to fuel. The active matrix serves as a catalyst for the fragmentation of long-chain hydrocarbon molecules, facilitating their diffusion into the narrower zeolite pores. Matrices have benefits such as reduced coke yield, enhanced yield of liquid products, increased resistance to hydrothermal instability, and the capacity to withstand elements that could cause contamination [3].
The physical characteristics of an active matrix have a substantial influence on its functionality. A high-quality active matrix possesses physical characteristics that include a specific surface area ranging from 300 to 600 m2 /g,
a specific pore volume of 0.8 to 1.5 mL/g, and a pore diameter that varies between 3 and 10 nm [4]. The surface of the active matrix serves as a location of interaction between the hydrocarbon feed molecules and the acid sites of the active matrix. As the diameter of the pore increases, the barrier to diffusion decreases. As the diffusional barrier decreases, a greater number of molecules can enter and undergo cracking within the pores. Vacuum gas oil (VGO) is a residual product obtained from the lower section of the vacuum distillation column during the process of refining petroleum. Under normal room circumstances, VGO exists as a very viscous liquid phase with a diameter ranging from 1.0 to 2.5 nm [5]. The cracking performance of the active matrix is also influenced by the strength and amount of acid sites on its surface that are capable of performing cracking. If the acidity of the site is excessively strong, it will lead to excessive cracking, which in turn produces undesired dry gas and coke by-products. In addition to having a wide pore width and a high specific surface area, an optimal active matrix has a high degree of selectivity towards light cycle oil (LCO). The objective of this work was to create an active matrix by synthesizing aluminum salt in order to achieve a matrix with an average pore diameter exceeding 50 angstrom, a specific surface area ranging from 300 to 600 m2 /g, and a pore volume between 0.8 and 1.5 mL/g.
Experiment
Matrix Synthesis
The matrix was prepared using the process described in US Patent 67223297 B2, with aluminum chloride (AlCl3.6H2O) from Merck as the source of alumina, and a sodium silicate solution from Merck as the source of silica. The process involved dissolving aluminum chloride in water and combining it with a 10%-volume ammonia solution in an aqueous medium. This was performed at a temperature range of 65 to 70 °C, while ensuring the pH level was maintained between 7 and 8. Once the alumina sol formed, sodium silicate was added until a colloidal solution was generated. A certain quantity of 85% Merck phosphoric acid was introduced and agitated to enlarge the pore size until the appropriate phosphorous concentration was achieved. The solid was subjected to filtration, rinsing, drying at a temperature of 110 °C for 6 to 10 hours, and calcination at a temperature of 500 °C. The silica-alumina matrix is synthesized with a silica concentration ranging from 50 to 80%.
Matrix Characterization
The physical characteristics of surface area, pore size, pore volume, and acidity were all examined. The surface area, average pore size, and pore volume of the material were measured using a Micromeritics Tristar II Plus instrument using nitrogen physisorption utilizing the BET (Brunauer, Emmett, and Teller) method. The acidity assessment was conducted using the Microtrac MRB Belcat II Particle Characterization NH3-TPA/TPD (ammonia temperature-programmed adsorption/desorption) method.
Activity Test
A micro activity test (MAT) was performed to assess the cracking activity of the active matrix. The performance test utilized a TEXOL Fixed Bed Micro Reactor Unit series 3210-200-10-12. The feedstock used was vacuum gas oil (VGO), and the ratio of matrix to VGO was 1:1, following the protocols outlined in ASTM D 5154-03. The VGO composition, as reported in Federal Register/Vol. 77, No. 58, March 2012, amended 2015, consisted of hydrocarbons ranging from C20 to C40 or higher [6]. The temperature of the reactor was adjusted to 516 °C. The temperature was incrementally raised from the initial room temperature by 100 °C at regular intervals until it reached a final temperature of 516 °C. The reaction time was 8 minutes.
Cracking Products Analysis
The products were categorized into three distinct classifications: liquid, vapor, and solid. The liquid products were examined using a Shimadzu GC-2010 plus gas chromatography system equipped with a flame ionization detector (FID). Per the ASTM D5154 – 03 standard, LCO was characterized by a boiling point range of 216 to 343 °C, while HCO has a boiling point exceeding 343 °C. This research defined gasoline as a mixture of hydrocarbons with carbon chain lengths ranging from C5 to C12 and boiling points between 36 and 216 °C. LCO is a mixture of hydrocarbons with carbon chain lengths ranging from C13 to C20 and boiling points between 217 and 344 °C. HCO is a mixture of hydrocarbons with carbon chain lengths greater than C20 and boiling points higher than 344 °C. An analysis of carbon monoxide (CO) and carbon dioxide (CO2) was conducted using a Perkin-Elmer gas chromatograph (GC) equipped with a thermal conductivity detector (TCD). An analysis of C1-C4+ gas products was carried out using a Shimadzu 14-B gas chromatograph equipped with a flame ionization detector (FID). The gravimetric approach quantified the amount of coke produced as solid product during the VGO cracking reaction by measuring the change in mass of the used active matrix before and after heating in an atmospheric furnace.
Result and Discussion
Physical Characteristics
Ten distinct matrices were synthesized based on the silica (SiO2) composition and added phosphorus (P) load. The physical parameters of these matrices, including total specific surface area (SSA), average (Avg) pore diameter, and total pore volume, are presented in Table 1.
| SiO2 (%-wt) | P (%-wt) | Physical characteristics | ||||
|---|---|---|---|---|---|---|
| Sample code | Specific surface area (m2/g) | Avg. pore diameter (Å) | Total pore vol. (mL/g) | |||
| SA-50 | 50 | - | 416 | 98 | 0.78 | |
| SA-60 | 60 | - | 375 | 102 | 0.61 | |
| SA-70 | 70 | - | 366 | 123 | 1.15 | |
| SAP1-70 | 70 | 1 | 315 | 148 | 0.83 | |
| SA-75 | 75 | - | 292 | 161 | 1.10 | |
| SAP1-75 | 75 | 1 | 229 | 190 | 0.80 | |
| SAP2-75 | 75 | 2 | 190 | 203.8 | 0.49 | |
| SA-80 | 80 | - | 253 | 198 | 0.80 | |
| SAP1-80 | 80 | 1 | 226 | 203.8 | 0.70 | |
| SAP2-80 | 80 | 2 | 178 | 203.3 | 0.46 | |
Table 1 Physical characteristics of the matrix.
Effect of Silica Composition to Physical Characteristics of the Matrix
Figure 1 depicts the impact of silica composition on the properties of the matrix. The average pore diameter, specific surface area (SSA), and pore volume measured by the device were compared to the smallest value to calculate the specific surface area (SSA) ratio. Table 1 and Figure 1 show a positive correlation between silica composition and pore diameter, indicating that when the silica composition increases, the pore diameter also increases. This tendency occurs due to the forming of a Si-O-Al bond when pre-matrix alumina reacts with silica. Introducing Si atoms will increase the binding angle between Si and Al. As a result, the diameter of the capillaries in the matrix will increase [4]. This trend was corroborated by research undertaken by Chen et al. in [2], Souza et al. in [3], and Ishihara et al. in [7]. Unlike the pore diameter, the surface area of the active matrix decreases when the silica composition increases, as depicted in Figures 1 (a) and (b).
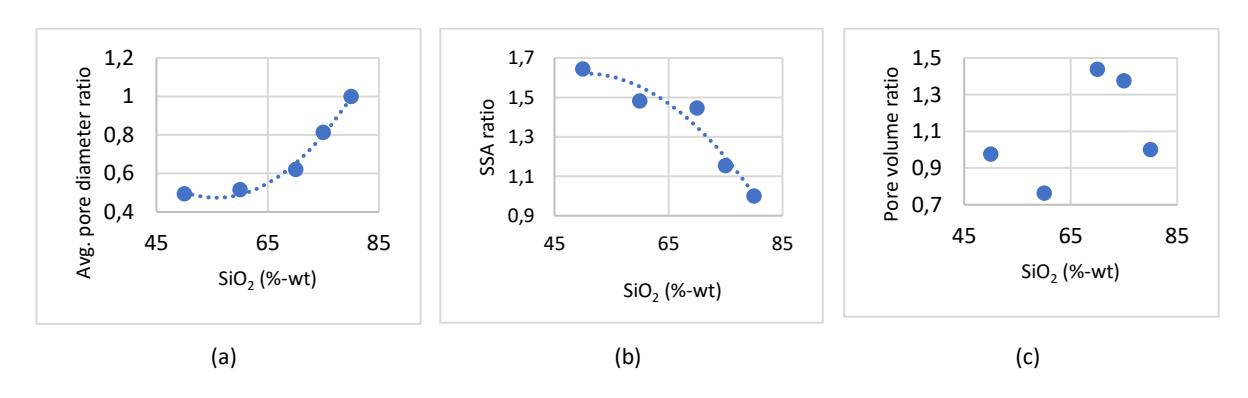
Effect of silica content on (a) pore diameter, (b) surface area, (c) pore volume of the active matrix.
Including silica content decreases the amount of aluminum atoms (Al) in the matrix, leading to a higher number of Si-O-Si bonds than Si-O-Al bonds. An augmentation in the quantity of Si-O-Si leads to a contraction in the matrix structure, resulting in a reduction in the surface area of the catalyst [8]. There was no correlation between the average pore volume of the synthesized matrices and the addition of silica content. This phenomenon aligns with the discoveries made by Hosseinpour et al. in their study [9]. The desired minimum pore volume was set at 0.8 mL/g. Active matrices containing silica compositions of 50%, 70%, 75%, and 80% by weight are suitable for achieving the desired goal.
Figure 2 exhibits the N2 adsorption-desorption isotherms for the SA-60, SA-75, and SAP1-75 samples. The SA-60 material demonstrates adsorption-desorption isotherms of IV(a) type and hysteresis of H4 type, as classified by IUPAC. These characteristics indicate that SA-60 is a mesoporous material [10]. Samples with elevated silica concentration, specifically SA-75 and SAP1-75, display adsorption-desorption isotherms of type II and hysteresis of type H3, indicating the presence of mesoporous material [10]. Thus, it can be inferred that raising the silica content to 75% by mass leads to the creation of macroporous structures inside the material.
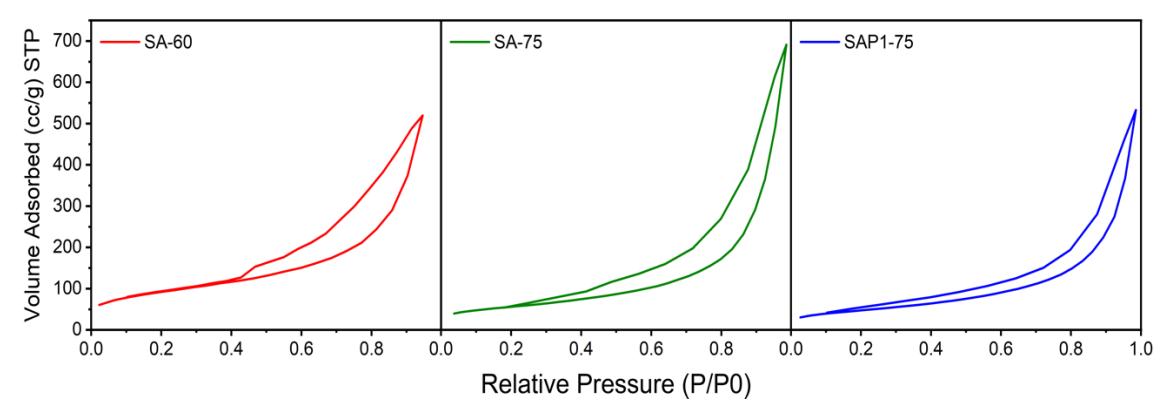
N2 adsorption/desorption isotherms of the synthesized active matrices (SA-60; SA-75; SAI-75).
Effect of Phosphorus Addition to Physical Characteristic of Matrix
The study also examined the impact of different levels of phosphorus addition on the physical characteristics and efficacy of the active matrix. Figure 3 displays data regarding the physical characteristics of the active matrix when phosphorus was added. The pore diameter increased following the incorporation of 1%-wt and 2%-wt phosphorus. This phenomenon occurs due to substituting aluminum atoms in the Al-O-Si link with Si-O-P. Replacing aluminum atoms with phosphorus atoms creates bigger pores, since Si-O-P has a greater bond angle than Al-O-Si [11]. However, the addition of phosphorus to an active matrix tends to reduce the specific surface area of the matrix in an inverse relationship with the average pore diameter [12]. Figure 2 demonstrates that introducing phosphorous into SA-75, resulting in SAP1-75, altered the synthesized active matrix's nitrogen adsorption/desorption isotherm.
Figure 3 shows that the inclusion of phosphorous decreased the pore volume of the active matrix , as depicted in Figure 4(c). This suggests that the addition of phosphorus reduces the average pore volume of the active matrix. This phenomenon aligns with the results reported by Hosseinpour et al. in [9] and Xu et al. in [12].
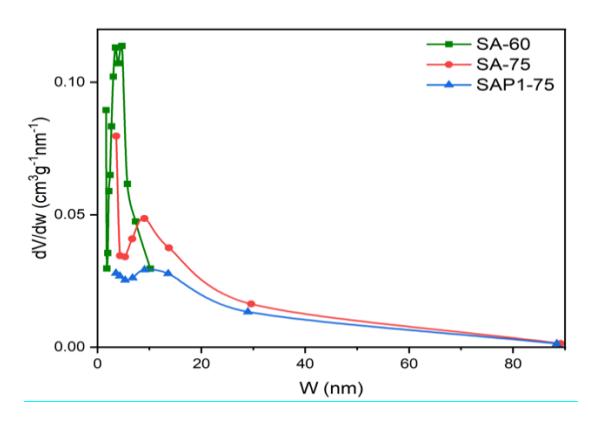
Pore size distribution of synthesized active matrix.
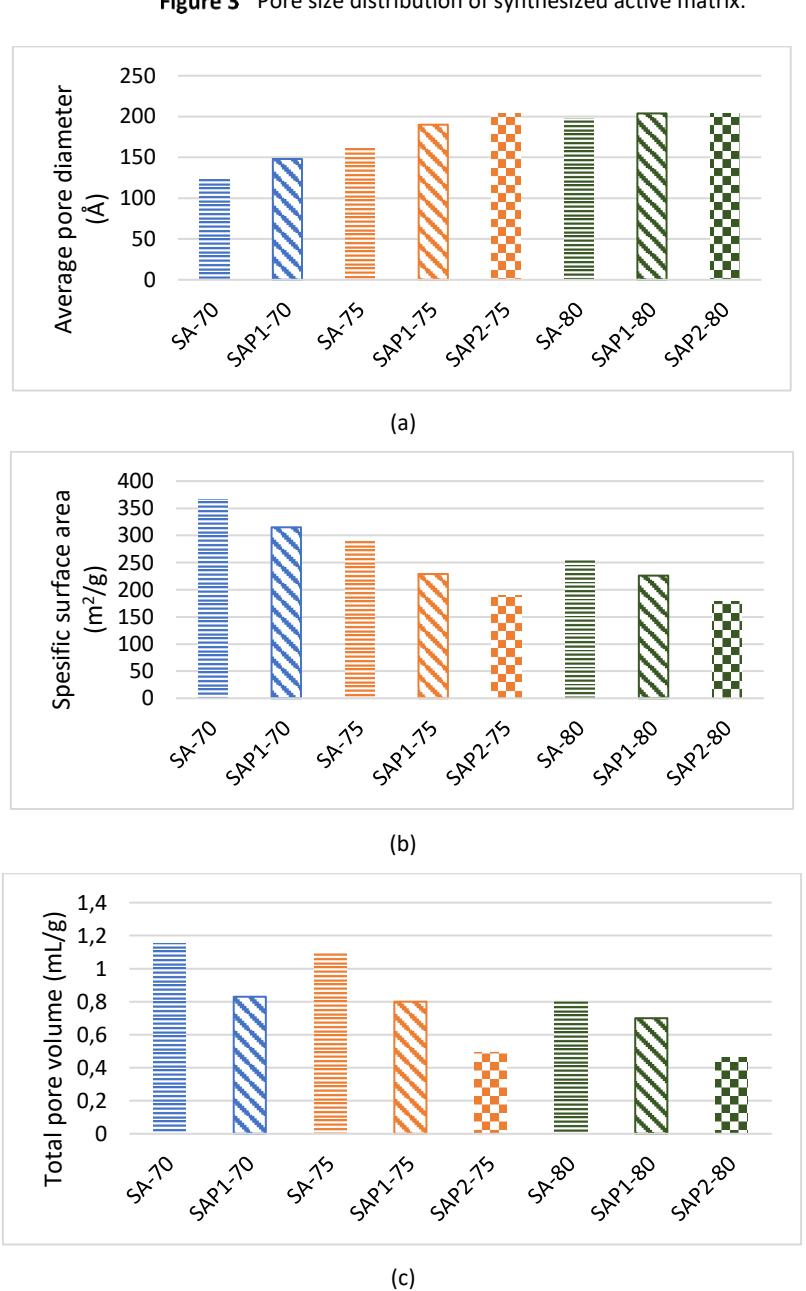
The effect of the phosphorus content on (a) pore diameter, (b) specific surface area, (c) matrix total pore volume.
Cracking Activity
Gas chromatography was used to examine the gas and liquid products of the cracking reaction. Meanwhile, a gravimetric analysis was conducted to determine the mass of coke on the active matrix. Table 2 presents a concise overview of the data analysis conducted of the cracking results. The intended matrix facilitates the decomposition of VGO, resulting in a much higher proportion of LCO fractions compared to other product fractions.
| Sample code | VGO conversion (%-wt) | Liquid product (%-wt) | Gas product | Coke | ||
|---|---|---|---|---|---|---|
| Gasoline | LCO | HCO | (%-wt) | (%-wt) | ||
| SA-50 | 87 | 55 | 9 | 13 | 16 | 8 |
| SA-60 | 95 | 56 | 16 | 5 | 16 | 6 |
| SA-70 | 88 | 53 | 15 | 12 | 15 | 4 |
| SAP1-70 | 77 | 34 | 28 | 24 | 10 | 4 |
| SA-75 | 77 | 33 | 23 | 23 | 14 | 6 |
| SAP1-75 | 70 | 23 | 33 | 32 | 9 | 3 |
| SAP2-75 | 65 | 24 | 29 | 35 | 8 | 3 |
| SA-80 | 73 | 35 | 20 | 29 | 14 | 2 |
| SAP1-80 | 73 | 29 | 31 | 25 | 9 | 7 |
| SAP2-80 | 61 | 23 | 29 | 33 | 7 | 7 |
Table 2 Active matrix cracking products.
Effect of Silica and Phosphorous Composition to Matrix Cracking Activity
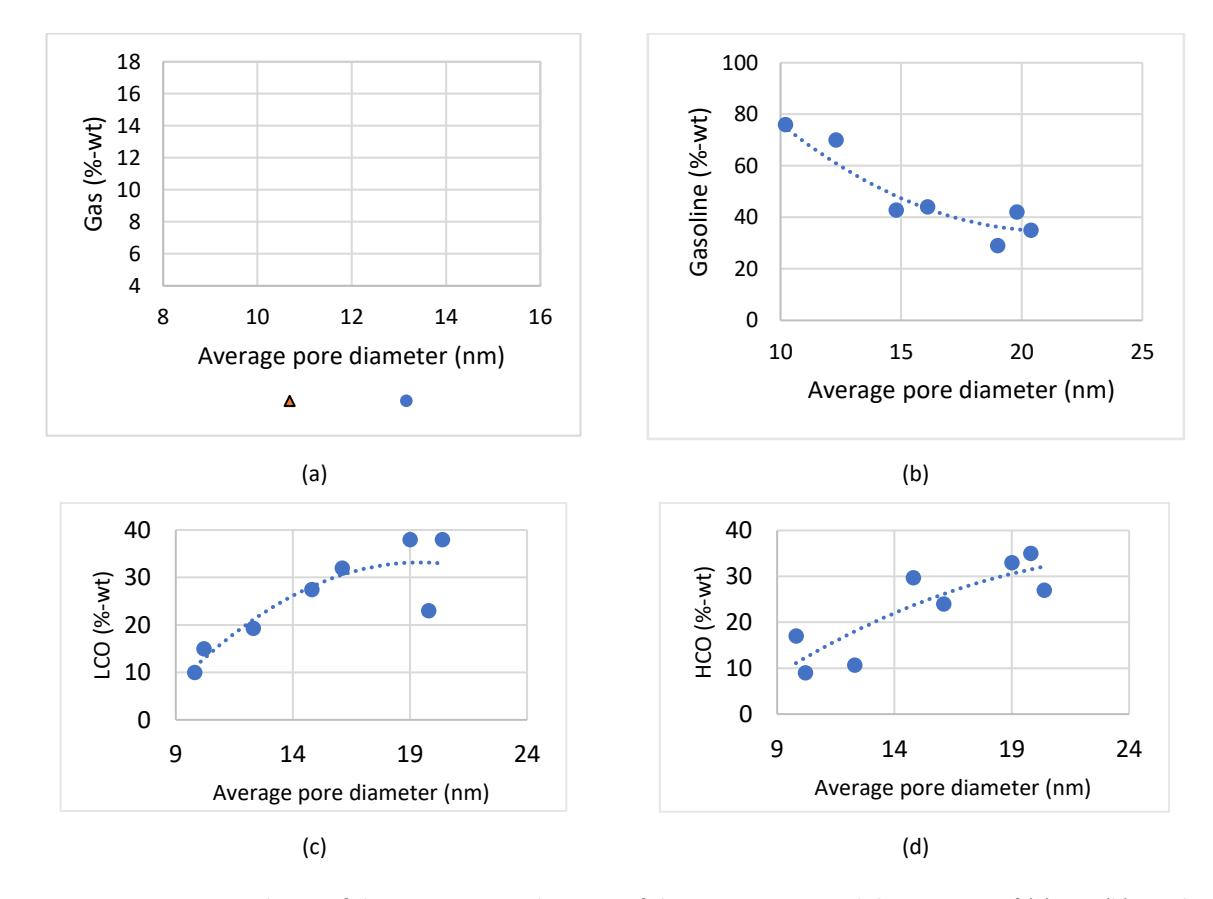
Figure 5 illustrates the impact of different silica and phosphorus content levels on the selectivity of liquid products in the VGO cracking process. Figure 6 displays the transformation of VGO across different active matrix compositions.
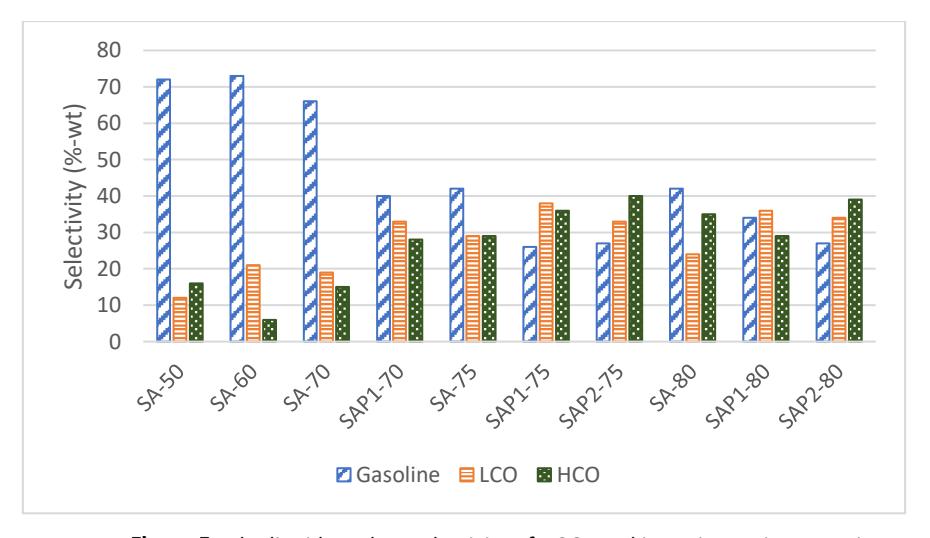
The liquid product selectivity of VGO cracking using various matrices.
The matrix with 75%-wt silica yielded the highest amount of LCO products, followed by the matrix with 80%-wt silica and 1%-wt phosphorus. Figures 5 and 6 illustrate a positive correlation between the alumina composition and the level of active matrix fracture activity. The trend is supported by studies conducted by Hosseinpour et al. [9]. The inclusion of aluminum in the silicate structure results in the formation of Si-(OH)-Al bonds, which significantly enhances the strength of the Brønsted acidity [13]. Amorphous silica-alumina, which can have a maximum of 20% by weight of Al2O3, is a frequently used active matrix in FCC catalysts. Traditionally, amorphous silica-alumina with 13% by weight of Al2O3 is commonly employed as the active framework for FCC catalysts [9]. Alumina is only necessary as a substitute for silica particles. Excessive alumina concentration leads to an increased number of Al-O-Al bonds, which can decrease the effectiveness of the Brønsted acid. When the concentration of alumina exceeds 20%, the efficacy of the Bronsted acid will drop [14].
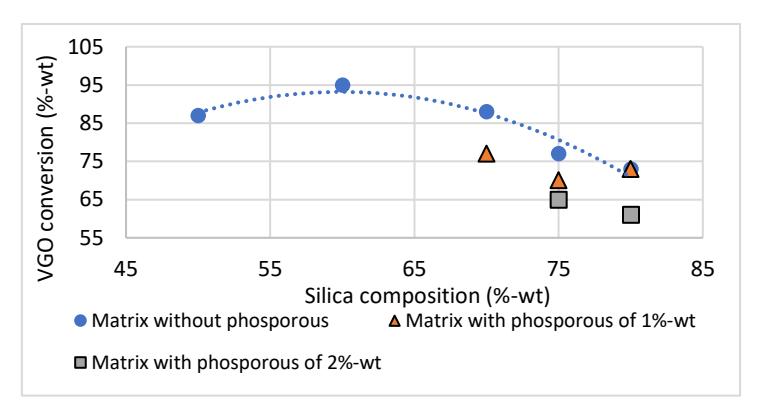
VGO conversion on various active matrix compositions.
According to Figure 5, the inclusion of phosphorus in the active matrix leads to a cracking product with a lower proportion of gasoline and an increase in the LCO product. This observation is supported by research conducted by Chen et al. [2]. The acidity of various active matrices was analyzed using the NH3-TPD method; the results are presented in Table 3 and Figure 7. The addition of phosphorus causes a decrease in the activity of the active matrix, as evidenced by lower conversion rates and a lower acidity ratio. Figure 7 shows that adding silica reduces the active matrix's overall acidity. Therefore, it can be concluded that the inclusion of silica in the active matrix weakens its activity, as higher silica content leads to a decrease in total acidity.
Table 3 Active matrix acidity characteristic.
| Sample code | Area/mass | Total acidity relative to SA-80 |
|---|---|---|
| SA-60 | 23914.29 | 3.85 |
| SA-75 | 15950.00 | 2.57 |
| SA-80 | 6215.69 | 1.00 |
| SAP1-80 | 5539.22 | 0.89 |
Table 3 and Figure 7 display the active matrix's total acidity compared to the total acidity of SA-80 for various matrices. Figure 7 demonstrates that the inclusion of phosphorus generally reduces the relative acidity of the active matrix. Adding phosphorus will replace the silica group in the active matrix. The hydroxyl group (P-OH) will replace the silanol group (Si-OH). The Brønsted acidity of Si-OH is higher than that of P-OH. There is an inverse relationship between the amount of phosphorus and the overall acidity. Specifically, as the phosphorus content increases, the acidity decreases [15]. Hence, substituting a fraction of the Si with P will decrease the overall acidity of the active matrix, leading to less activity.
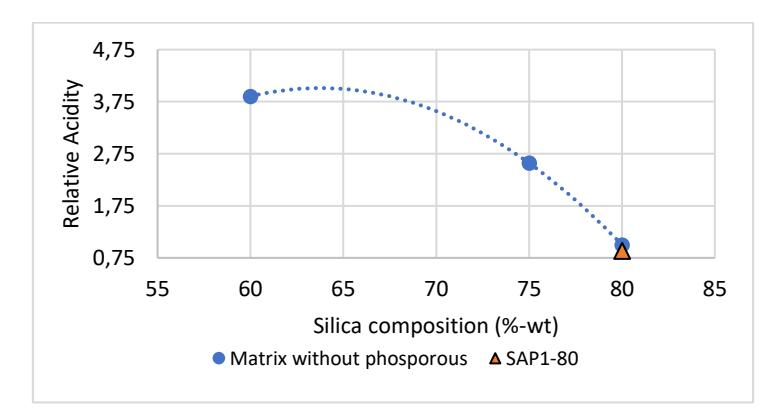
The effect of the addition of silica composition on relative acidity.
Coke Formation
During the catalytic cracking, carbonaceous materials or coke slowly build up on the catalyst's surface. This occurs through a mechanism where the reactants or products initially adsorb onto the surface and then undergo a chemical reaction that forms less volatile deposits. Aromatics often have a higher affinity for adsorption compared to more saturated hydrocarbons, so it is reasonable to infer that they possess the highest propensity for coking. After adsorbing molecules, they undergo several condensation and hydrogen elimination events to create deposits with increasing molecular weight, reduced hydrogen content, and decreased volatility [16].
To ensure that the catalyst used in the cracking processes remains active for longer periods, it is crucial to avoid the formation of coke products, which can lead to the catalyst's deactivation. In this study, the gravimetric method was employed to analyze the coke. The analysis results for each active matrix of the coke are reported in Table 4.
| SiO2 | P | Coke | |
|---|---|---|---|
| Sample Code | (%-wt) | (%-wt) | (%-wt) |
| SA-50 | 50 | - | 6.29 |
| SA-60 | 60 | - | 4.53 |
| SA-70 | 70 | - | 3.20 |
| SAP1-70 | 70 | 1 | 4.77 |
| SA-75 | 75 | - | 2.40 |
| SAP1-75 | 75 | 1 | 2.62 |
| SAP2-75 | 75 | 2 | 2.24 |
| SA-80 | 80 | - | 4.72 |
| SAP1-80 | 80 | 1 | 2.80 |
| SAP2-80 | 80 | 2 | 5.12 |
Table 4 Coke content in spent matrix.
Table 4 shows that the concentration of coke in each active matrix assessed for activity ranged from 2.24 to 6.29%-wt. A coke concentration below 5%-wt is considered relatively low. Therefore, the SA-50 and SAP2-80 matrices did not achieve the desired level. The matrix SAP1-75, which exhibited the highest LCO output, showed the second lowest coke concentration and successfully achieved the objective. This suggests that this particular matrix is more resistant to deactivation than the other matrices developed.
Correlation between Physical Properties and Active Matrix Acidity with Cracking Performance
The activity of the active matrix of silica alumina is determined by various parameters, specifically the physical characteristics and acidity. Figure 8 illustrates the association between specific surface area and VGO cracking conversion. Figure 9 presents the link between the specific surface area and the product selectivity of gas, gasoline, LCO, and HCO.
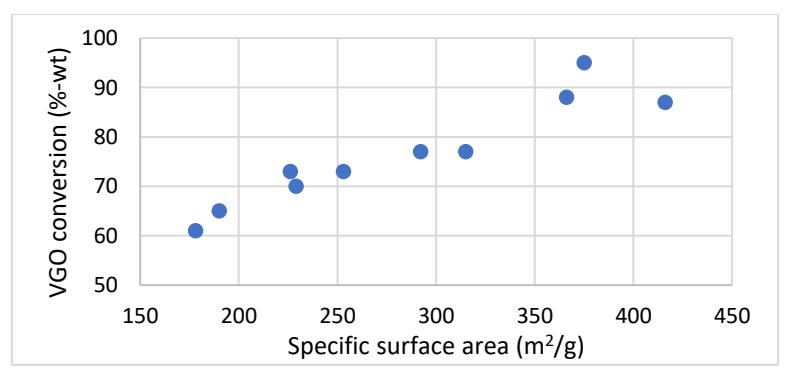
Correlation of specific surface area with VGO cracking conversion.
Figure 8 illustrates a direct relationship between the conversion rate and the surface area of the active matrix. This phenomenon arises due to the augmentation of catalytic sites when the surface area expands [17]. Ahmad et al. noted a similar pattern in their study [18]. Figures 9(a) and (b) demonstrate a positive correlation between the surface area of the active matrix and the production of gas and petroleum products. Figure 9(c) and (d) demonstrate that increasing the specific area of the active matrix leads to a decrease in the mass percentage of LCO and HCO. This study found that a higher surface area was obtained by reducing the amount of silica, which led to a more acidic matrix. The elevated acidity of the matrix led to an accelerated cracking process, leading to a higher production of gasoline and gas from the fragmentation of LCO or HCO. Silverman et al. noted a similar
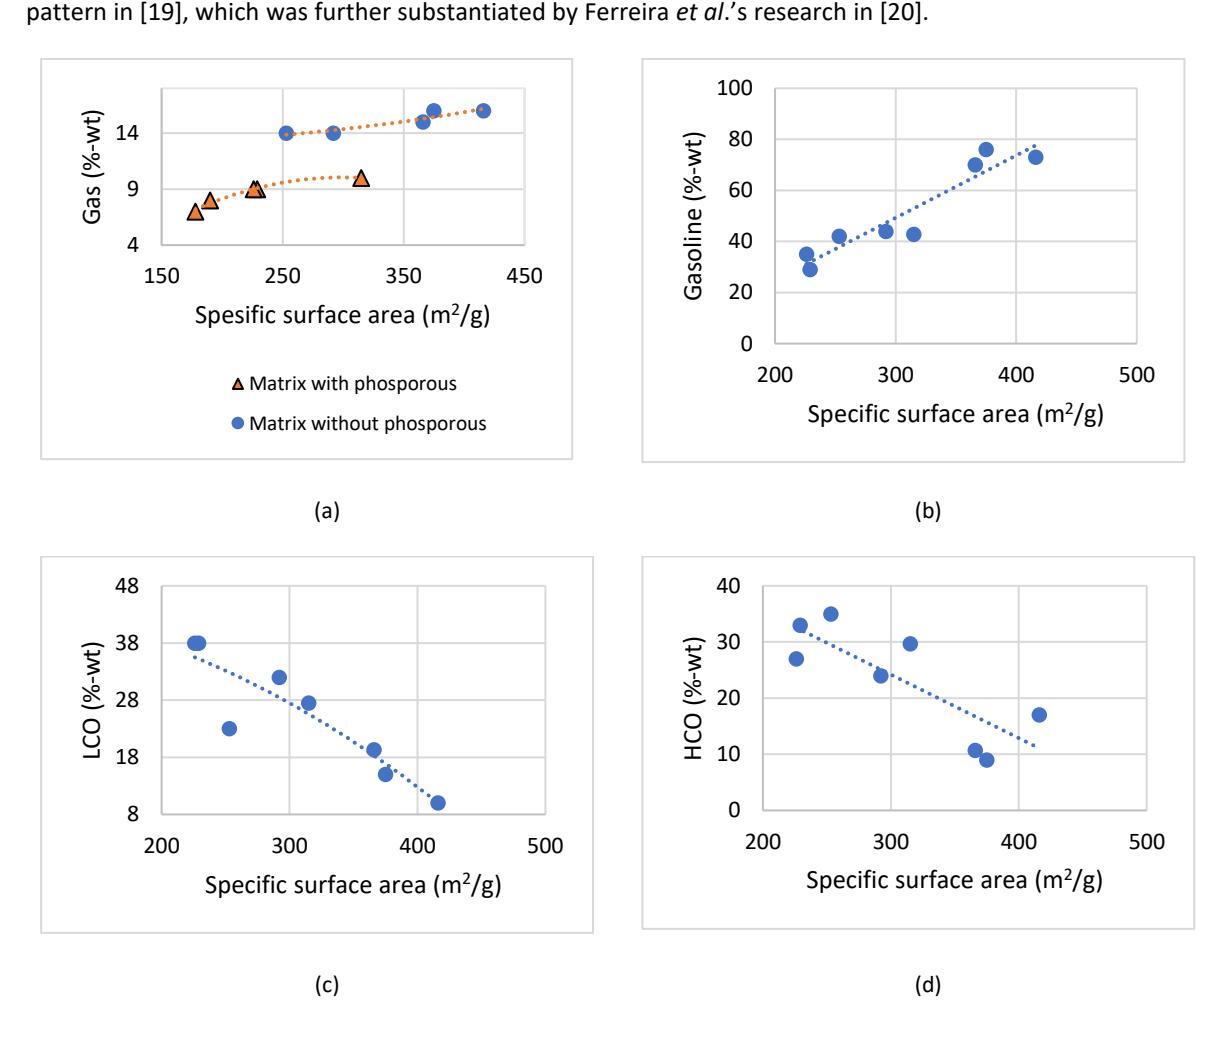
Correlation of the specific area of the active matrix to the recovery of (a) gas, (b) gasoline, (c) LCO, and (d) HCO from VGO cracking.
The VGO cracking process is influenced not only by the specific area of the active matrix but also by the average pore diameter. Figure 10 displays the association between the average pore diameter and the VGO cracking conversion. Figure 11 illustrates the relation between the average pore diameter and the product selectivity of gas, gasoline, LCO, and HCO.
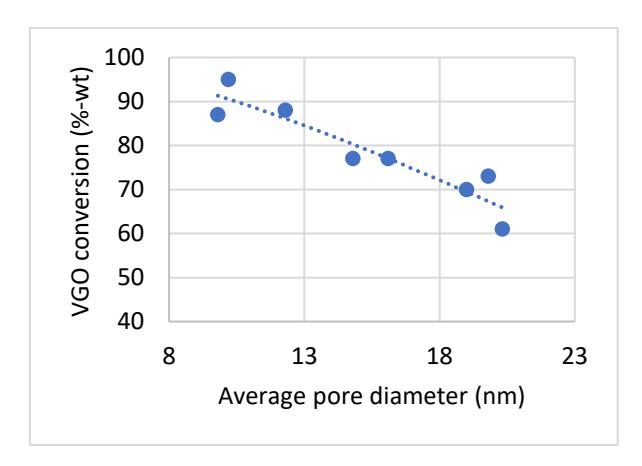
Correlation of average pore diameter and VGO cracking conversion.
Correlation of the average pore diameter of the active matrix and the recovery of (a) gas, (b) gasoline, (c) LCO, and (d) HCO from VGO cracking.
In Figure 11 (a), there is a negative correlation between the size of the pore diameter and the recovery of gas products. Similarly, the recovery of gasoline products also shows a decreasing trend as the pore diameter increases. Figure 11(c) and (d) demonstrate a positive correlation between the pore diameter and the production of LCO and HCO, indicating that as the pore diameter increases, the production of LCO and HCO also increases. This suggests that the average pore size of the manufactured active matrix in this study was sufficiently large to allow the VGO molecules to diffuse into it, despite the active matrix having a diameter of 1.0 to 2.5 nm [4].
Correlation of active matrix total acidity to VGO conversion.
The activity of the active matrix is influenced by its physical characteristics and acidity. Figure 12 illustrates the correlation between the acidity ratio of the active matrix and the conversion of VGO cracking. Figure 13 demonstrates the relation between the acidity ratio and the selectivity of gas, gasoline, LCO, and HCO. Figure 12 demonstrates a positive correlation between the acidity of the active matrix and the conversion rate. Figures 13(a) and (b) demonstrate that the levels of gas and petroleum products increase in correlation with the acidity of the active matrix.
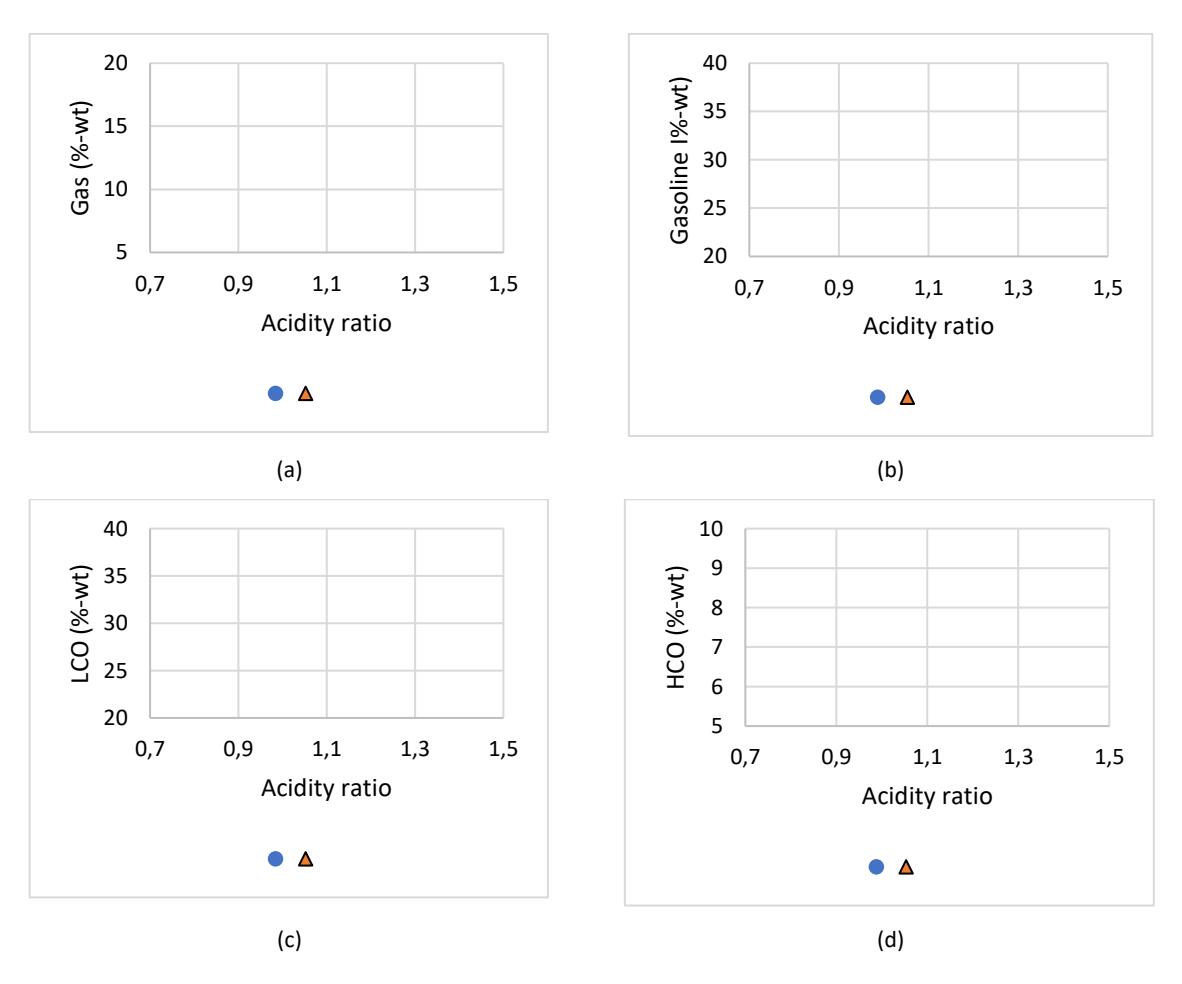
Correlation of active matrix acidity ratio to the recovery of (a) gas, (b) gasoline, (c) LCO, and (d) HCO from VGO cracking.
Figures 13(a) and (b) show that the percentage of mass obtained decreases as the acidity of the active matrix increases. The activity of the active matrix in splitting the input into gas and gasoline increases as the number of acid sites in the active matrix increases [21]. Ahmad et al. noted a similar pattern in their study [18].
Vacuum Gas Oil (VGO) Cracking Reaction Mechanism
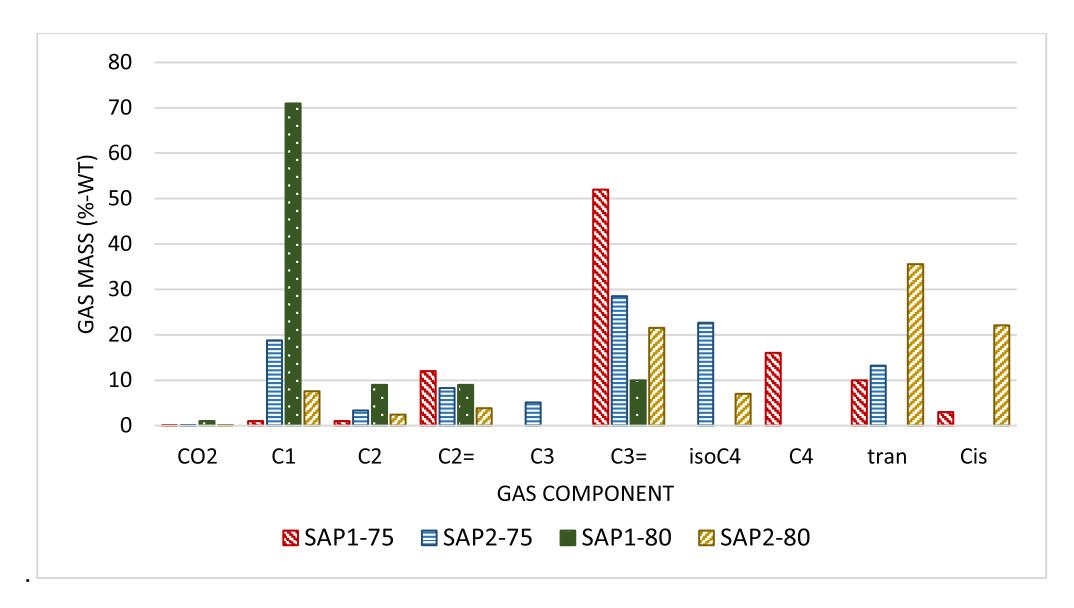
Vacuum gas oil (VGO) is a byproduct of petroleum refining obtained from the bottom section of a vacuum distillation column. At normal temperatures and pressures, VGO exists in the slurry-solid state. VGO consists of a carbon chain typically ranging from C20 to C40 or greater [3]. Hence, to utilize it as an energy source, an additional procedure is necessary to break down the substance into shorter molecular chains. The mechanism of the cracking reaction can be estimated by analyzing the composition of the gas products acquired from the active matrix activity test results. The gas composition of the VGO fragmented gas is distributed using different matrices, as depicted in Figure 14.
Distribution of the gas composition of the VGO cracked gas using a variety of matrices.
Figure 14 indicates that the predominant components of gas products are propylene and methane. The gas composition suggests the primary reaction mechanism is the addition and elimination mechanism. The acidity of the active matrix, specifically the mechanism of proton donation or proton acceptance, influences the addition or elimination processes of hydrocarbons. The acidity of an active matrix is directly proportional to the number of proton donors and acceptor processes. During the cracking reaction, the hydrocarbon molecule undergoes either addition or elimination reactions, forming a carbocation. The carbocation molecule undergoes beta-splitting, resulting in the division of the beta-carbon chain. When the beta chain is cut, it will produce an olefin carbon chain and a primary carbocation. To achieve stability, the carbocation ion will undergo an isomerization process to transform into a tertiary carbocation. Once the carbocation has achieved a stable state, the beta chain cleavage and isomerization process continues until a short carbon chain is formed [22]. Equations 1 through 6 illustrate the various stages of the process by which long-chain hydrocarbons are broken down.
\[Al-OH \rightleftharpoons Al-O^- + H^+ - (1)\] \[R_1-CH_2-CH = CH-CH_2-R_2 + H^+ \rightarrow R_1-CH_2-CH-C^+H-CH_2-R_2\] (proton addition) (2) \[R_1-CH_2-CH-C^+H-CH_2-R_2 \rightarrow R_1-CH_2-CH = CH_2 + C^+H_2-R_3\] (beta scission) (3) \[C^+-H_2-R_3 \rightarrow CH_3-C^+H-CH_2-R_4\] (isomerization) (4) \[CH_3-C^+H-CH_2-R_4 \rightarrow CH_3-CH = CH_2 + C^+H_2-R_5\] (beta scission) (5) \[C^+H_2-R_5 \rightarrow CH_3-C^+H-CH_2-CH_3\] (further isomerization) (6)
Conclusion
This paper presented novel insights into the behavior of silica-alumina-based active matrices employed as precrackers for heavy hydrocarbons. This research provides insights into several properties and the effectiveness of the active matrix. A greater average pore diameter and a lower surface area correspond to higher silica content in the active matrix. Furthermore, the use of silica decreases the overall acidity of the matrix. Hence, to produce LCO, a matrix with an average pore diameter of 18 to 20 nm is necessary. The optimal pore diameter range for producing gasoline is 9 to 13 nm. Phosphorus atoms added to the active matrix decrease the matrix's surface area and pore volume by increasing the average pore diameter. The research findings indicate that the maximum phosphorus content in the matrix needed to create LCO products is 1%-wt. The current solution for synthesizing an active matrix from aluminum salt has not achieved the needed matrix qualities. Consequently, further research and development are necessary.
Acknowledgement
The financial support provided by the Hibah Riset P2MI, Faculty of Industrial Technology, Institut Teknologi Bandung and the RU3P Center for Catalysis and Reaction Engineering, LPIT, Institut Teknologi Bandung are acknowledged.