
Introduction
The causes of highway landslide disasters are multifaceted, intertwining both natural factors such as terrain and geological conditions as well as external elements such as rainfall during engineering activities [1-3].
Traction landslides are caused by erosion [4], excavation [5], and other external forces at the foot of a slope due to increased sliding force. Ultimately, an initial tensile crack separates into a large-scale sliding body, leading to slope instability. Many studies have been done on the mechanism of traction landslides and corresponding treatment measures. The instability mechanism is mainly reflected in the change of the hydraulic boundary conditions [6-9] and the weakening of the geotechnical physical parameters of the landslide [10-12]. Yang Guang-hua [13] analyzed the formation mechanism of traction landslides, obtained the stress field and the displacement field by numerical analysis, and proposed a set of targeted treatment plans for traction landslides. Yuan Conghua [14] analyzed the development process of traction landslides, combined with the characteristics of the continuously expanding scale of -type landslides from bottom to top, and proposed the principle of effective reinforcement compensation. Ha [15] compiled an overview of the advancements in predicting rainfallinduced landslides, encompassing developments in numerical simulation, experimental approaches, and the application of machine learning in model predictions. Hidayat [16] found that mine instability during the landslide process is caused by excavations. Meanwhile, the Young modulus of a landslide decreases by 3% to 35%. Based on portable dynamic cone penetration tests, the mechanism of liquefaction-induced-flow failure caused by a confined aquifer was proposed in [17].
Copyright ©2024 Published by IRCS - ITB J. Eng. Technol. Sci. Vol. 56, No. 2, 2024, 231-243 ISSN: 2337-5779 DOI: 10.5614/j.eng.technol.sci.2024.56.2.5
School of Highway, Chang'an University, Xi'an 710064, China
3Guangdong Nanyue Transportation Investment and Construction Co. Lid, Guangdong 510100, China
Currently, the literature on the traction landslide mechanism, analysis of reinforcement measures, and engineering case studies is still limited. Slope foot excavation in mountain roads and traction landslides account for a large proportion of highway landslides [18]. Nevertheless, traction landslides in the initial instability stage have received limited attention due to the expenses associated with reinforcements. Conversely, the costs of reinforcement and treatment for landslides in the advanced stages are substantial. The following problems still exist in the stability analysis and reinforcement treatment of tractor landslides: the safety factors of the upper slope and the lower slope under the instability of tractor-type landslides are not equal, and the safety factors obtained by the existing strip method are obviously unreasonable [19-21]. Meanwhile, the understanding of the evolutionary mechanism directly affects the selection of analysis methods and reinforcement measures [22]. Combined with the practical situation of a large retrogressive landslide treatment project, i.e., K112+210 – K112+630, the present study used field monitoring and a numerical model to analyze the landslide mechanism and the stability of the landslide body. It determined the landslide potential slide surface to explain the landslide mechanism. Finally, a reinforcement scheme based on the landslide mechanism was developed, and its reinforcement effect was verified.
Landslide Mechanism Analysis
Basic Characteristics of Landslide Area
Characteristics of Landslide Body
Guangdong Province has the climatic characteristics of heavy and concentrated rainfall in the rainy season, with complex gully development and geological conditions in some areas. The slope on the right side of K112+210 – K112+520 of the highway is a grade-four slope with a height of 44 m. The right-side slope of K112+520 – K112+630 is a grade-three slope with a height of 31 m.
The landslide is a low mountain landform, which developed gullies primarily through four gully catchments. Eleven groundwater springs can be seen at the landslide's front position, with a flow of 630 L/H. The landslide direction was nearly 180° at an angle of 30° to 45°, the landslide plane has a dustpan shape, with a horizontal length is about 300 m, an oblique length of about 320 m, an upper slide body width of about 200 m, and a lower width of about 390 m. The landslide was a multi-layer, multi-stage landslide, with a main slide azimuth angle of about 170°. The height of the rear edge of the slide body is about 359 m, the height of the shear outlet is about 264 m, and the maximum height difference is about 95 m. Tensile cracks and steep ridges can be seen on the rear wall of the slide body. The width of the cracks is 0.1 to 1.0 m, and the height of steep ridges can reach up to 1.5 m.
The relative position between the landslide and the highway is shown in Figure 1.
Relative geographical position between the landslide and the highway.
The material composition of the landslide body is mainly gravel containing silty clay, fully weathered shale, fully weathered sandstone, strongly weathered sandstone, etc. The central thickness of the landslide body is larger, generally 25 to 30 m, while the lower and upper thickness is slightly smaller, generally 8.0 to 9.9 m, the overall average thickness is about 20 m, the volume of the landslide body is about 1.86 million m3 , belonging to the giant landslide category.
Sliding Bed Characteristics
The landslide slip bed is mainly composed of strong-medium-weathered sandstone, argillaceous sandstone, limestone, and argillaceous limestone from the Lower Carboniferous Datang Jiashui Formation (C1dc), and no trace of slip was found in the Dengzi member (C1ds). The landslide bed for field investigation is shown in Figure 2.
Landslide bed formation site and borehole core: (a) slip bed sandstone, (b) slip bed limestone core.
Characteristics of Landslide Body
The sliding zone is mainly a soft zone of fully weathered shale and carbonaceous shale. Drilling revealed obvious sliding traces in the core, high water content, and low soil strength. According to the exposure of the shear outlet of the side slope, the sliding zone is relatively wet, plastic, with a smooth and straight sliding surface. The sliding surface at the exit of the field investigation shear is shown in Figure 3.
Slip surface and drilling core at shear outlet: (a) cut of the slip surface at the exit, (b) sliding surface drilling shale core.
Landslide Mechanism Analysis
The landslide body is divided into two large areas in the east and the west. The natural gully in the middle is the boundary, including the natural hillside. The two natural slopes developed on a multistage landslide platform and the height of the same level platform is divided into several sliding blocks by a small gully. The classification of the landslide area is shown in Figure 4.
The western landslide can be divided into two zones, Zone I and Zone II. Zone I is a serious landslide deformation zone with a transverse width of about 160 m and a depth of about 325 m. Zone II is a landslide deformation traction zone with a transverse width of 160 m and a depth of 100 m. The top of Zone I is a broad platform. The eastern landslide is divided into two zones, Zone III and Zone IV. Zone III is an engineering landslide zone with a transverse width of about 295 meters and a depth of about 90 meters. Zone IV is the joint affected area of the landslides in Zones I and II, with a transverse width of about 235 meters and a depth of about 155 meters.
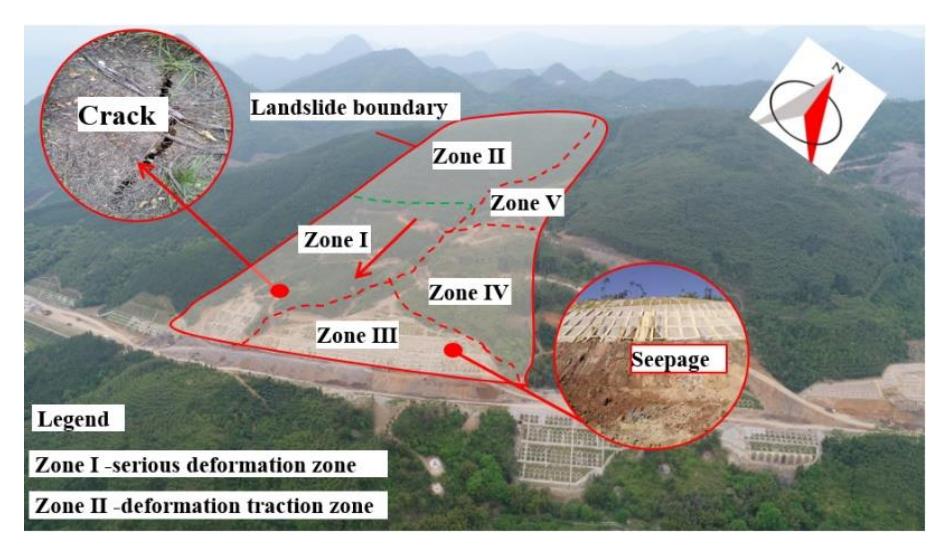
Landslide classification block diagram.
In the east and west, a gentle slope platform developed on the top of the landslide body, which can be regarded as its common platform. Zone V is the potential landslide zone.
According to the characteristics of the landslide materials and sliding surface zone, crack distribution, drilling and monitoring data, the landslide mechanism of this section can be summarized as follows: the poor geological environment is an internal factor of the landslide; engineering activities were the main cause; groundwater activities and heavy precipitation were the inducements, which can be divided into four stages:
1. The primary rock mass structure is broken.
The slope angle of the landslide area is about 15° to 20°, and a steep slope formed at the rear edge, which belongs to the easy slippery terrain and landform. The rock layer is composed of sand and mudstone mixed with carbonaceous shale, the rock mass is broken, and an initial structural plane has been formed.
2. Damage and deterioration of rock mass.
The excavation of the cutting-edge slope foot formed a new free surface, which destroyed the stress balance of the slope. The fracture of the original landslide rock mass further expanded.
3. Creep of rock and soil structure in water softening
There are cracks in the front of Zone I (Figure 4). Surface water and groundwater will increase the bulk density of the loose soil, and part of the rainfall will penetrate deeply into the rock mass through the cracks, resulting in rock mass creep and the formation of multiple potential slip surfaces. The rise of the groundwater level forms upward rock on the broken slip zone.
4. Rainfall induced instability failure.
Rainfall accelerated the creep process in the rock mass and made the potential slip surface gradually connected. The upper part of the slope has a relatively low-lying terrain with a large catchment area. Moreover, continuous rainfall occurred from July to October 2016. The infiltration of surface water into the groundwater increased the saturation severity of the rock and soil mass and increased the sliding force. Finally, the above factors led to the slope to slide down.
Field Monitoring of Landslide Deformation
Measuring Point Layout
In order to further monitor the landslide deformation and crack development, and prevent secondary landslide disasters, a typical section of the landslide was selected. Deep displacement monitoring holes were laid to measure the landslide deformation, and a borehole fixed clinometer was used, with a monitoring session one time per two days at an accuracy of 0.02 mm/500 mm. A total of 16 test points were arranged in this section of the landslide, forming 4 typical monitoring sections.
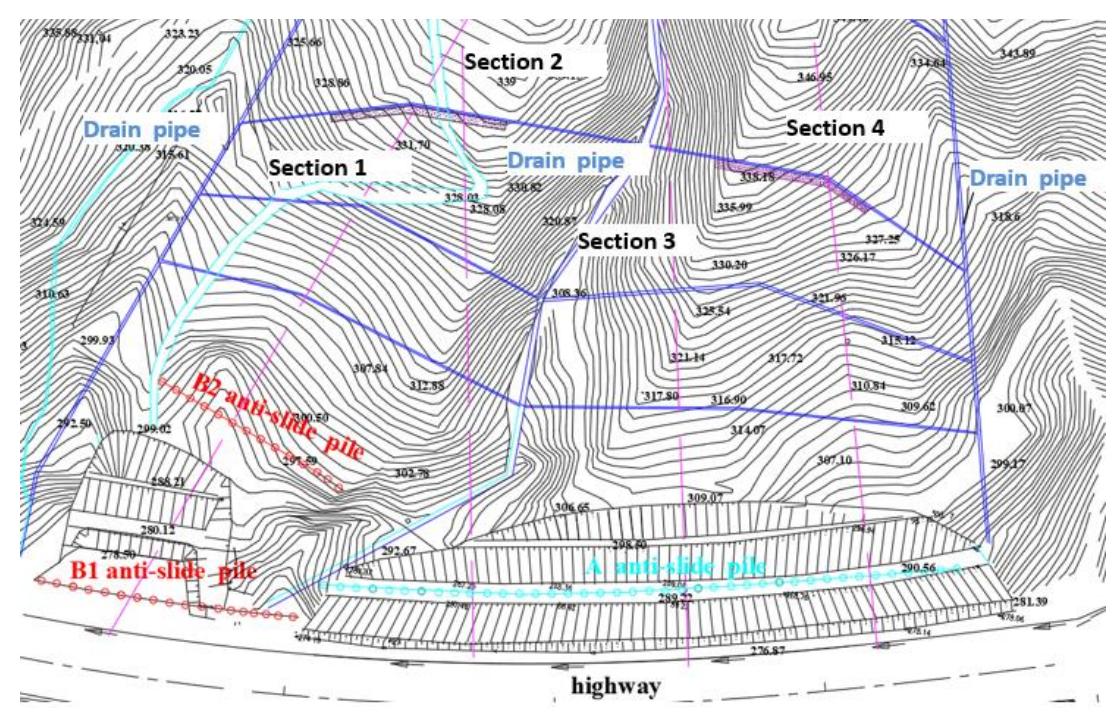
The 4 typical sections were arranged in K112+210-520, which was mainly dominated by Section 1, and there were 5 measuring test points, numbered CX12 to CX16. Meanwhile, 3 monitoring points were arranged in Section 2, numbered CX9 to CX11.There were 4 monitoring test points in Section 3, CX5 to CX8. There were 4 monitoring test points in Section 4, CX1 to CX4. The specific arrangement of the measuring points is shown in Figure 5.
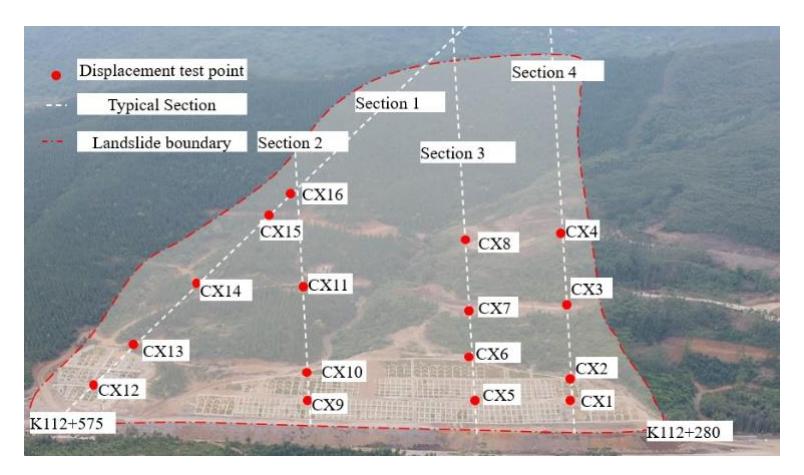
Layout of measured test points.
Analysis of Displacement Monitoring
Because the slope deformation was serious in Zone I, four test points (CX12, CX13, CX14, CX16) were continuously selected in Section 1. The horizontal displacement-depth (H-D) curves are shown in Figure 6. It can be seen from the curves in Figure 6(a) and 6(b) that the deformation curve changes from vertical deformation to horizontal oblique, and the slope deformation is a typical sliding deformation mode along a specific sliding surface. Moreover, the cumulative displacement of measuring points CX14 and CX16 suddenly increased at a depth of 31 m and 30.5 m, respectively. It can be inferred that the positions of the sliding surface at CX14 and CX16 was at depths of 31 m and 30.5 m, respectively. Test points CX13, CX14 and CX15 were sharply increased at the sliding surface on March 22. The cumulative horizontal displacement of CX14 was 15.5 mm from March 8 to March 20, 2017. The average displacement rate of each measuring point was 1 mm/d to 3.4 mm/d. The displacement rate was obviously higher than the warning rate by 2mm/d, where the leading edge sliding body was unstable.
A schematic diagram of the presumed sliding surface is shown in Figure 7(a). The calculation of the deformation in two directions of each monitoring hole shows that corresponding to the landslide of K112+520-630, the reference direction is N (Figure 4) and the slide direction is mainly 175°. Near the top line of the slope cut (CX13), the slide direction is mainly 211°, due to the great influence of the free surface.
By the same method, the sliding surface of each typical section was determined comprehensively according to the abrupt change point of the cumulative displacement of the deep survey hole in the depth direction. Figure 7(b), 7(c), and 7(d) show the position of the inferred sliding surface of the three-line section, the four-line section and the entire five-line section, respectively. It can be seen from Figure 7 that the sliding surface of each typical
section was mainly distributed in strongly weathered shale. In addition, the depth range of slip zone I is larger, indicating that Zone I is the slope deformation area, which is the landslide traction area.
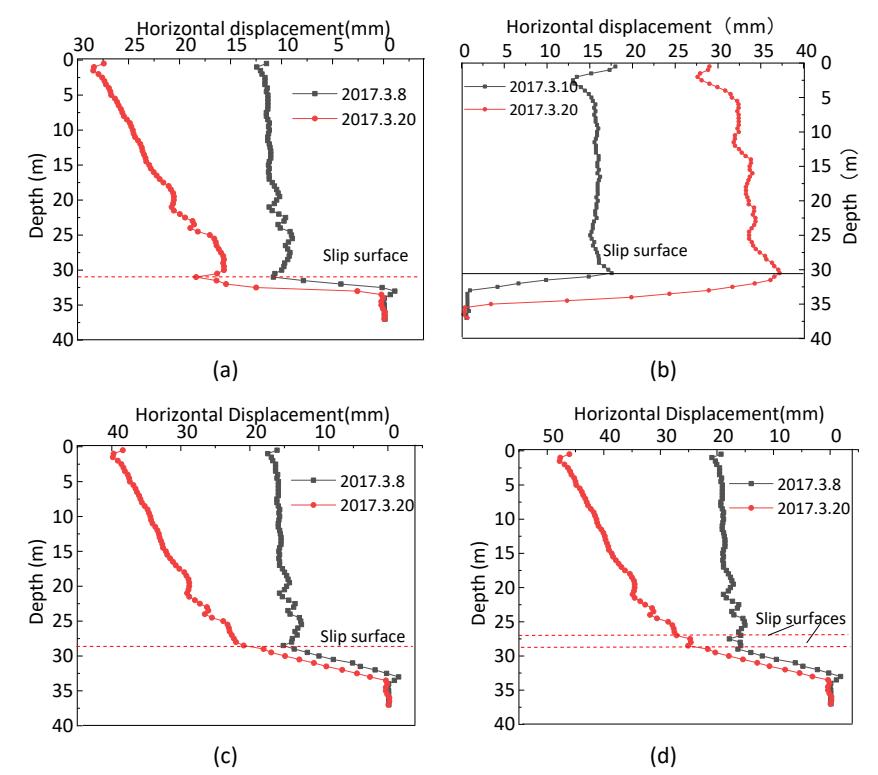
Figure 6 Displacement with depth distribution curve in Section 1: (a) H-D curve for CX14, (b) H-D curve for CX16 (c) H-D curve for CX13, (d) H-D curve for CX12.
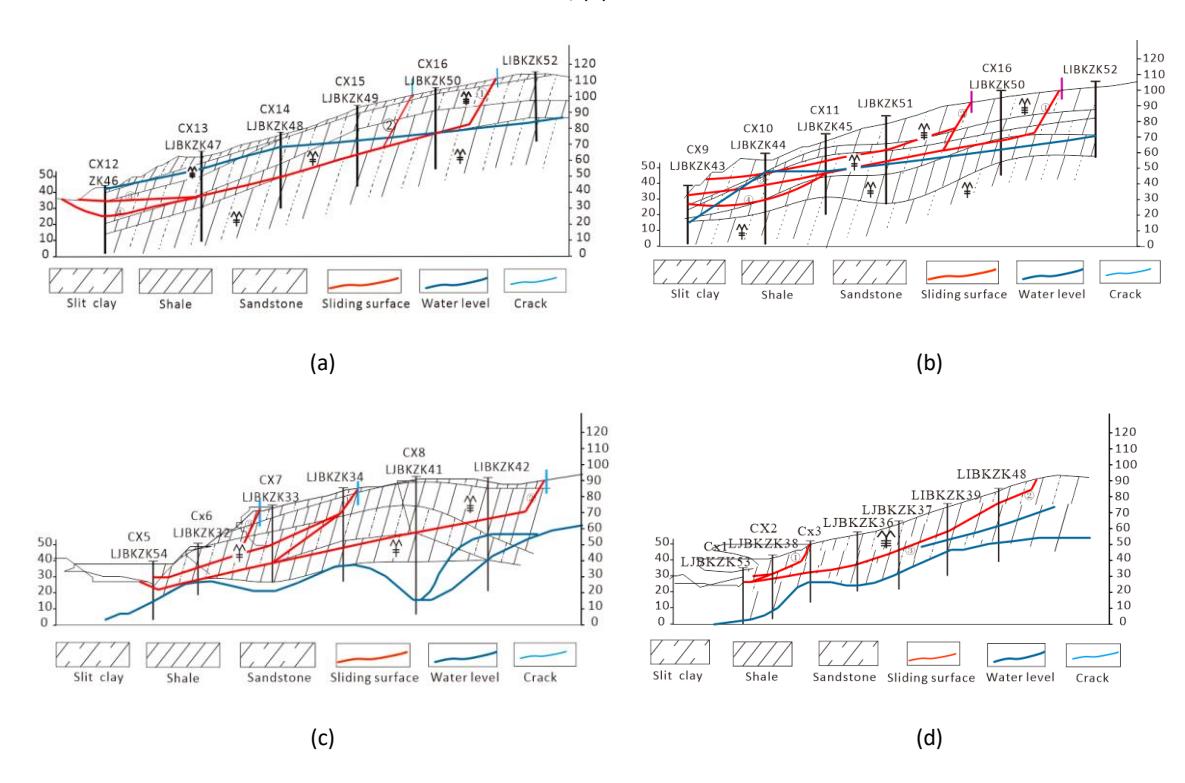
Figure 7 Schematic diagram of the landslide sliding section: (a) geological profile of Section 1, (b) geological profile of Section 2, (c) geological profile of Section 3, (d) geological profile of Section 4.
Landslide Treatment Technology
Unload Scheme
This slide section is located in the northern part of the mountain, and the crack at the rear edge of the landslide is located in the steep intersection of the natural slope. The controlled section was selected through repeated trial calculation combined with the potential slide area, determined by the results of deep displacement in the field. On the basis of the original design, the width of the platform and the excavation height and slope rate of the rear slope were determined.
After the formation of the main slope unloading, the secondary unloading of the first stage wide platform was carried out in combination with the detailed design positioning of the anti-slide pile, the shear strength of the sliding surface at the local further unloading position and the final influence on the residual sliding force. For Sections 1 to 3, the wide platform continued to clear 20 m from the rear square after the main body was unloaded. A typical section proposed for the unloading scheme is shown in Figure 8.
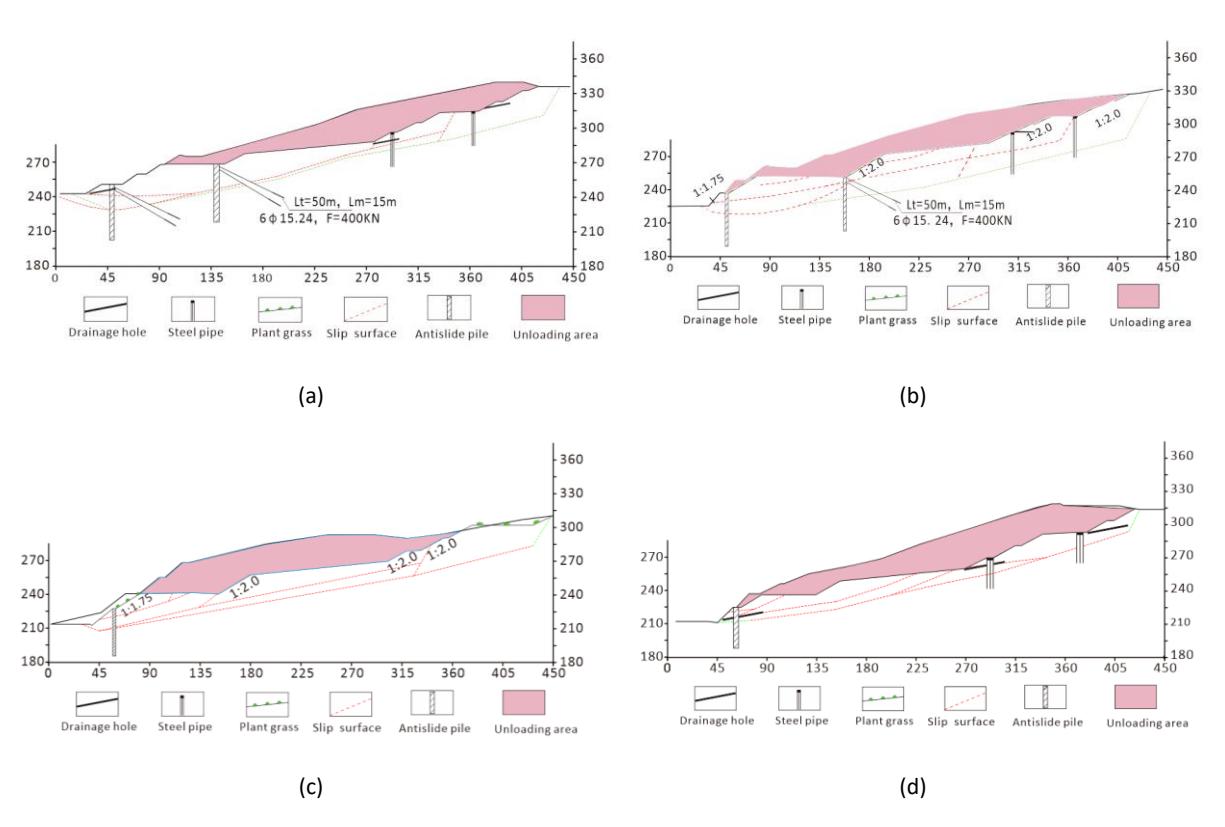
Schematic diagram of landslide unloading in typical sections: (a) Section 1, (b) Section 2, (c) Section 3, (d) Section 4.
Support and Protection Scheme
After landslide unloading, the rear part of the slope formed a high slope free surface. Because the stability still has difficulty to meet the requirements, there is the need to provide strong support. Considering the poor engineering properties of the rock and soil mass, steel flowered pipe grouting was selected as treatment. Meanwhile, for the sliding direction and maximum sliding deformation position of K112+210 – K112+520 and K112+520 – K112+630, two sets of steel flower-tube grouting reinforcements were set on the first-stage slope platform and the third wide platform of the rear slope, respectively, with a setting range of 45 to 65 m. The parameters of the steel flower-tube grouting are shown in Table 1.
Table 1 Steel pipe grouting parameters.
| Length (m) | Diameter (mm) | Thickness (mm) | Transverse spacing (m) | Longitudinal interval (m) |
|---|---|---|---|---|
| 22-30 | 89 | 6 | 1.2 | 3.6 |
Based on the calculation of the residual sliding force and the reinforcement principle of compensating the antisliding force of the key block in the traction area and reducing the deformation of the sliding body in the traction area, the setting and number of anti-sliding pile partitions and blocks were determined. For Section K112+210- 520, the direction of sliding for the mass movement was clearly defined, designating it as anti-sliding zone A.
The segment between K112+520-630 is primarily characterized by oblique Section 1, with the significant deformation zone of Section A situated within this stretch. Section B was designated as the anti-slide pile zone.
After unloading, the remaining sliding force was small in Zone A. A row of anti-sliding round piles was set, and two prestressed anchor cable holes were reserved at the top of piles. Two rows of anti-sliding round piles were set in Zone B, respectively in the front anti-sliding section and the middle of the sliding surface. The pile top was set with a prestressed anchor cable, with a length of 50 to 60 m. The length of the anti-slide piles was determined by the position of the sliding surface and the bedrock of the sliding bed. The pile length should not be smaller than 1.1 times the length of the cantilever section. The landslide disposal plan is shown in Figure 9.
Landslide disposal plan.
The tops of each three anti-slide piles were connected by a transverse beam, and prestressed anchor cables were reserved along a longitudinal interval of 3.6 m along the route of the transverse beam. As Area B is a serious deformation area, an anchor cable was also added, and a prestressed anti-slide pile was used. The parameters of the anti-slide pile and the anchor cable are shown in Tables 2 and 3.
Table 2 Anti-slide pile parameters.
| Road Section | Region | Diameter(m) | Spacing(m) | Number | Design Load(kN/m) |
|---|---|---|---|---|---|
| K112+210-520 | A | 2.6 | 6 | 42 | 500 |
| B1 | 2.6 | 6 | 19 | 500 | |
| K112+520-630 | B2 | 2.6 | 6 | 22 | 500 |
Table 3 Prestressed anchor parameters.
| Anti-skid section | Prestressed anchor cable | Length (m) | Design anchorage force (kN) |
|---|---|---|---|
| Zone A | / | -/ | -/ |
| Zone B | 6Φ15.24 | 50-60 | 400 |
Evaluation of Treatment Effect
Numerical Model
Finite element software was utilized to establish numerical models for the typical Section 1. The stability coefficients were investigated and calculated before treatment, after unloading, and after bracing protection. The safety coefficients of each section before and after treatment, as calculated by the strength reduction method, were compared to the results and used to compare and verify them.
According to the field monitoring data, the numerical model could be divided into three parts: sliding body, sliding zone (soft rock and soil body located below the sliding body), and sliding bed. The finite element Midas-GTS was used to establish a two-dimensional slope model. The More-Coulomb model was used for the soil mass, and the elastic model was used for the anchor cables, anti-sliding piles, and grouting steel pattern piles. The model's sides and bottom were constrained, whereas the slope and its crest remained unrestricted. The values of the supporting material parameters, i.e., anchor cable, anti-slide pile and grouting steel flowered pile, are shown in Table 8, and the physical and mechanical parameters of the soil are the same as in Table 4.
Table 4 Material parameters of supporting structure.
| Name | Density (g/cm3 ) | Poisson's ratio (μ) | Modulus of elasticity (Gpa) | Cohesive (kPa) | Friction (°) |
|---|---|---|---|---|---|
| Cable | 7.6 | 0.20 | 200 | / | / |
| Pile | 2.0 | 0.20 | 30 | / | / |
| Steel grouting pile | 2.0 | 0.2 | 30 | / | / |
| Sliding body | 1.86 | 0.30 | 18 | 18 | 22 |
| Slip surface | 1.75 | 0.25 | 10 | 10 | 17 |
| Slide bed | 2.49 | 0.22 | 200 | 200 | 30 |
Landslide Stability Analysis
Combined with the characteristics of the landslide body and the detailed technical parameters of the treatment, the stability of a typical section in the original state after unloading treatment and protection treatment were analyzed numerically, and the difference between the stability of the slope in the natural condition and the most unfavorable condition was considered.
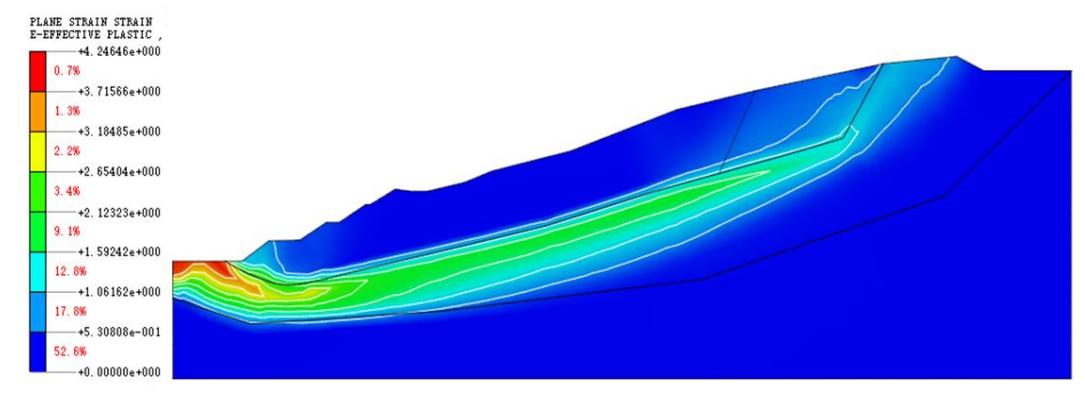
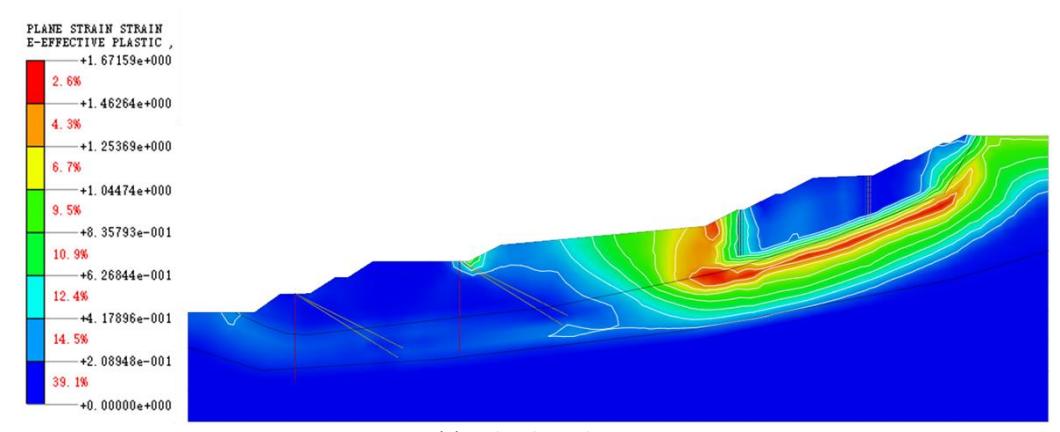
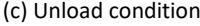
For the most unfavorable working conditions, a total displacement cloud chart for the downhill body under different treatment conditions of each typical section before treatment, excavation unloading, and support protection is shown in Figure. 10. It can be seen from the cloud map of the plastic region that the plastic region of the landslide in the original state was large and the area of the plastic region decreased significantly after excavation and reinforcement.
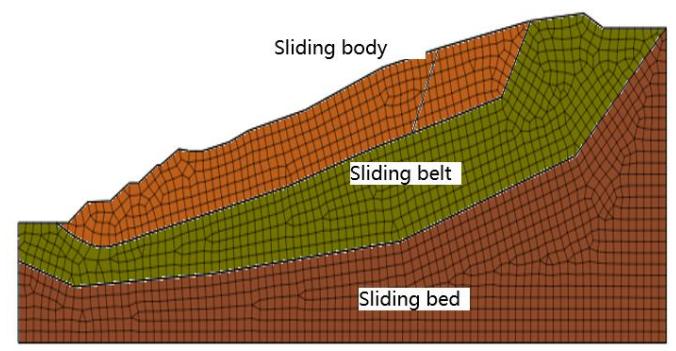
(a) Landslide numerical model
(b) Unprocessed condition
(d) Reinforcement condition
Equivalent plasticity cloud chart under unloading and reinforcement condition.
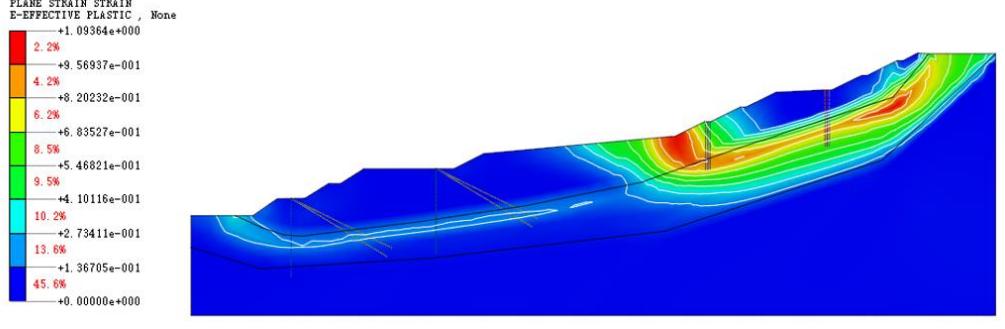
Figure 11 shows the calculation results of the slope safety factor for Section 1 before treatment, excavation and
Figure 11 Safety factors under different working conditions in Section 1.
Figures 10 and 11 show that the sliding surface of the unenforced front slope was breached, leading to a reduced sliding range and maximum strain value on the reinforced back slope. The safety factor of Section 1 was 0.96 under the most unfavorable working conditions, indicating instability. The sliding surface intersects the original design slope, which was disturbed during construction, triggering a large-scale landslide by pulling the rear rock and soil mass. Under natural conditions, the safety factor of Section 1 increased from 1.02 to 1.24 after unloading, indicating a basically stable state. Considering the characteristics of Section 1, the safety factor was 1.28 under the most unfavorable working conditions and only 1.20 under natural conditions. The anchor cable anti-slide piles and steel pipe grouting pass through the potential sliding surface, significantly reinforcing the potential sliding soil. It is evident that after unloading excavation and reinforcement measures were implemented, the landslide stabilized, demonstrating the effectiveness of the reinforcement measures.
Evaluation of Landslide Treatment Effect
unloading, and protection by retaining.
The stability of a landslide at each stage can be analyzed by measuring the maximum displacement of test points in a typical section. Cumulative displacement of CX14 at 0.5 m depth is shown in Figure 12.
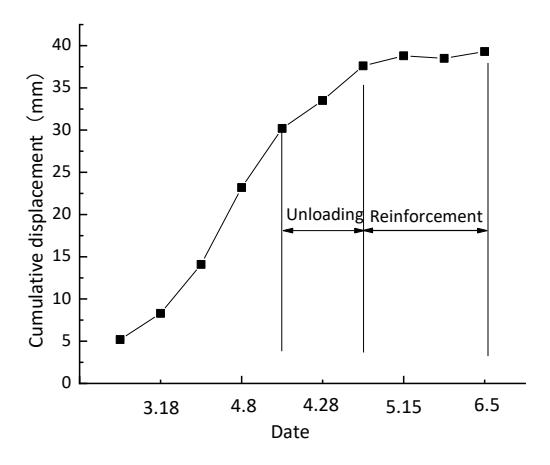
Figure 12 Cumulative displacement of CX14 at 0.5 m depth.
Table 4 and Figures 11 to 12 illustrate that the stability of the landslide was significantly improved due to treatment measures, i.e., unloading, steel flowered pipe grouting reinforcement, and the setting of anti-slide piles. The cumulative displacement of the slope in the landslide's traction area was notably inhibited, showing no significant increase. Prior to treatment, the slope was unstable under the most unfavorable conditions but stable under general conditions. After extensive clearing at the top and load reduction, the landslide reached a state of basic stability. The safety factor of four typical sections of the landslide body exceeded 1.2 after reinforcement treatment with anchor cable anti-slide piles and steel pipe grouting reinforcement. Our analysis indicates that the proposed treatment scheme comprising unloading, prestressed anti-slide piles, steel flowered pipe grouting, and drainage has a positive effect and can prevent secondary slope disasters. The safety factors of typical sections determined by theoretical calculation methods closely aligned with the results of the numerical simulations. Theoretical calculations and numerical simulations were consistent with practical outcomes.
Conclusions
The mechanism of a large retrogressive landslide can be divided into four stages: primary structural breakage, rock mass damage, softening of the rock mass in water, and instability failure induced by rainfall. In the case study, the excavation of slopes causing rock mass damage and rainfall were the main cause and the inducement of landslide instability, respectively. The field displacement monitoring results indicated that the slip surface had been fully developed, appearing at the interface between strongly weathered shale and moderately weathered shale. Based on the depth range of the slip source, this area was identified as a severe deformation area, namely the traction area of the landslide.
Based on the theory of varying support strengths between the traction area and the influenced area, especially in cases where back-pressure slope protection is ineffective in the early stages of a traction landslide, a combination of reinforcement measures is proposed. These include unloading at the top of the landslide, supporting with anchor cable anti-slide piles in the middle slope, and grouting steel flowered pipes for drainage. Following reinforcement, the cumulative displacement speed of the slope decreased from 0.3 mm/day to 0.02 mm/day, indicating stability and a positive impact of the reinforcement.
Acknowledgments
The authors are grateful for the support provided by the Doctoral Research Start-up Fund (Grant No. 23SKY025), the Fundamental Research Funds for the Central University (Grant No. 41272285), and the Education Department Think Tank Connotation Construction Project (Grant No. 23JT010).