
Introduction
Coffee is one of the world's oldest agricultural plants, having been grown for over 80 centuries in tropical and subtropical regions such as Brazil, Indonesia, Ethiopia, and Uganda [1,2]. Coffee plants are classified into the genus of Coffea L. and the subgenus of Coffea, both of which belong to the Rubiaceae family [3]. There are approximately 80 species of coffee that fall under the Coffea L. genus, but only three of those species are economically valuable: C. arabica L. (also known as Arabica coffee), C. canephora L. (also known as Robusta coffee), and C. liberica L. (also known as coffee Liberica) [4, 5]. Nevertheless, markets most highly appreciate Arabica beans, which dominate more than 95% of the global coffee market, followed by Robusta beans which are widely planted in Malaysia [5]. In contrast to Robusta beans, which are considered to have a more bitter flavor, an earthy roast aroma, and a stronger body, markets have recognized that Arabica beans produce a more flavorful aroma and a more satisfying taste [6].
To produce a delightful coffee beverage, the intrinsic characteristics, including chemical composition and reactional capabilities of the coffee powder are indispensable. Both properties are inextricably linked and can significantly impact the powder's reconstitute behavior, sensory profile, and shelf life [7, 8]. The intrinsic characteristics are associated with parameters that can be directly measured, including physical characteristics, and are unrelated to the surrounding environment or food matrices. While reaction characteristics such as
Copyright ©2024 Published by IRCS - ITB J. Eng. Technol. Sci. Vol. 56, No. 3, 2024, 389-403 ISSN: 2337-5779 DOI: 10.5614/j.eng.technol.sci.2024.56.3.7
stickiness and absorption capacity indicate the behavior of the coffee powder when interacting with its surrounding environment or food matrixes [9].
Physical properties such as coffee powder particle size and distribution influence a range of reconstitute behaviors such as (i) solubility, (ii) bulk density, (iii) wettability, and (iv) foam formation. Also, particle size has a significant impact on the bulk density (g/cm3 ) of coffee powder. Larger particles increase interparticle voids with smaller contact surface areas per unit volume as a result of trapped air and incur packaging and transport expenses. While small particles hampered coffee powder flow ability since smaller particles have more contact points with neighboring particles [10]. The chemical components of coffee, such as arabinogalactan, galactomannan, and cellulose, influence the solubility or solid content of coffee beverages, resulting in an increase in the viscosity and thickness of the coffee fluid, which is proportional to its organoleptic quality [11]. Organic acids such as malic acid, quinic acid, and caffeic acid have a significant impact on the sourness and bitterness of coffee brew [12], while the oil content of coffee has a substantial impact on its mouthfeel/body [13]. It has been reported that the chemical composition of coffee is significantly affected by post-harvest processing, such as the type of fermentation [14]. When compared to Robusta coffee, Arabica coffee has been the subject of many fermentation studies and to the best of our knowledge there are no investigation reports regarding the physicochemical and sensory properties of spontaneous wet fermentation (SWF) using locally planted Robusta coffee. Hence, the present study investigated the physicochemical and sensory properties of roasted Robusta coffee beans that underwent different SWF durations.
Methodology
Sample Collection and Spontaneous Wet Fermentation
Sample collection and wet fermentation were carried out in accordance with Evangelista et al. in [15], with minor modifications made to the types of samples, fermentation period, and manual depulping. Ripe Robusta coffee cherries were collected from University Agriculture Park, Universiti Putra Malaysia (UPM), Serdang, Selangor, Malaysia. Ripe, non-defected cherries (such as dried, moldy, damaged or black cherries) were harvested by hand using gloves and a container that was sprayed with 70% ethanol, and immediately transported to the laboratory. The cherries' fruit skin (exocarp) and part of the mucilage (mesocarp) were manually removed using disinfected (sprayed with 70% alcohol) mortar and pestle upon arrival at the UPM laboratory. The pulped green coffee beans (without exocarp and part of the mesocarp) were spontaneously fermented using ultrapure water (Arium 611 UV) at an ambient temperature for 0 to 5 days. Zero-hour fermentation (0 days) was used as negative control (sample that did not undergo any fermentation). The microbiological, phytochemical constituents, and antioxidant properties of fermented green Robusta coffee beans has been reported in Pertanika Journal of Tropical Agricultural Science, PJTAS Vol. 47(2) May 2024. Conversely to the starter culture applied in steer fermentation, spontaneous fermentation uses naturally occurring microorganisms. In addition, water participation in wet fermentation is the primary difference compared to solid-state fermentation (dry without water participation).
Roasting of Robusta Coffee Beans
After SWF, the fermented green coffee beans were dried to a moisture content of 10 to 12% and the parchment was manually removed. The same procedure was performed for unfermented green coffee beans (negative control). The green Robusta coffee beans (100 g) were roasted at 245 ℃ for 12.5 min using a coffee roaster (Gene Cafe CBR-101, United States) to achieve a light-medium roast degree [4,16]. The roasted Robusta coffee beans were cooled to ambient temperature and placed in a desiccator for subsequent physicochemical analysis. The percentage of weight loss of the roasted Robusta coffee beans was calculated using the difference between pre- (Wi) and post-roasting weights (Wf) with the following Eq. (1) [17]:
% of weight loss = \[\frac{Wi - Wf}{Wi} \times 100\%\] (1)
Hardness Analysis of Roasted Robusta Coffee Beans
The hardness of the washed green Robusta coffee beans was measured in accordance with Pittia et al. in [18], with minor modifications of the beans used and of the working temperature, with three replications. The hardness of the washed green Robusta coffee beans (10 beans) was measured using a TA.XTplusC texture analyzer (Stable Micro Systems, Surrey, England) equipped with a 1,000 N load cell at a rate of 0.83 cm/s and a working temperature of 25 °C. The coffee beans were placed on the analyzer plate with the flat side up. The result was expressed as Newton (N) ± SD.
Proximate Composition Analysis of Roasted Robusta Coffee Powder
The freshly ground coffee powder was sieved with a mesh size of 600 to 710 µm (30 – 25 mesh), and its approximate compositions for (i) ash, (ii) moisture, (iii) fat, (iv) protein, and (v) carbohydrate were analyzed in triplicate in accordance with AOAC procedures.
Color Analysis of Robusta Coffee Powder and Brew
Color analysis was performed in accordance with Wongsa et al. in [4] with three replications. The color of the washed green Robusta coffee powder (10 g) and the brew (10 mL) was measured using a colorimeter (Konika Minolta CR 400 Chroma Meter) to determine the color parameter values i.e., L* (L* = 100 means white, L* = 0 means black), a* [redness (+) and greenness (−)] and b* [yellowness (+) and blueness.
Total Soluble Solids, Water Solubility Index and Water Absorption Index of Roasted Robusta Coffee Powder
The total soluble solids (TSS) were measured with an Atago Hand Refractometer (Atago, Japan) in a range of 0 to 10 °Bx, and the results were represented in degrees Brix. The water solubility index (WSI) and water absorption index (WAI) were conducted in triplicate in accordance with Wongsa et al. in [4] with a minor adjustment to the sample – water ratio (0.6:10). The freshly ground coffee powder (0.6 g) was sieved and mixed with 10 mL hot distilled water (90 to 95℃) before being cooled to room temperature. The mixtures were vortexed for 1 min, centrifuged for 20 min at 6,000 rpm. The supernatants were collected in a pre-weighed petri dish. The supernatants were oven-dried at 105℃ for 24 h, and the residues were weighed. In addition, the WSI was calculated as follows in Eq. (2):
\[WSI = \frac{\text{weight of dried supernatant}}{\text{weight of coffee powder}} \times 100\%\] (2)
The pellets were collected and weighed to determine the water absorption ability with the following Eq. (3):
\[WAI = \frac{pallet \ weight}{weight \ of \ coffee \ powder} \times 100\%\] (3)
Flow Properties Analysis of Robusta Coffee Powder
Free Flow and Tapped Bulk Densities
The powder bulk density (B) and tapped bulk density (T) flow ability properties were determined in triplicate in accordance with Ishwarya and Anandharamakrishnan in [10] and Bauer et al. in [16], with a minor modification of the sample volume. The freshly ground powder was sieved with a mesh size of 600 to 710 µm for standardization. The measuring cylinder was weighed (m1) and 10 mL (VB) of sample was poured into the cylinder and weighed (m2). The powder bulk density (ρB) was determined using the following Eq. (4):
\[\rho B = \frac{m2 - m1}{VB} \tag{4}\]
The tapped bulk density (T) was determined by manual hand tapping 300 times and measuring the compacted volume (VT). The result was determined using the following Eq. (5):
\[\rho_{\mathsf{T}} = \frac{m_2 - m_1}{V_{\mathsf{T}}} \tag{5}\]
Hausner Ratio and Carr Index
The coffee powder flow characteristic was determined using the Hausner ratio (H) and the Carr index (C):
\[H = \frac{\rho_{\rm B}}{\rho_{\rm T}} \tag{6}\]
\[C = \left(\frac{\rho_{\rm T} - \rho_{\rm B}}{\rho_{\rm T}}\right) \times 100 \tag{7}\]
pH Analysis of Robusta Coffee Brew
The pH of the coffee fluid was determined in triplicate in accordance with Yüksel et al. in [19] with minor modifications of the sample – water ratio. Freshly ground 0.6 g coffee powder was mixed with 10 mL of hot distilled water (90 to 95 ℃) before being cooled to room temperature. The mixture was filtered (Hario V60 coffee filter paper, Japan), and the pH was measured using a glass-electrode pH meter (Delta 320 pH meter) after calibration with pH 4.0 and pH 7.0 buffer.
Rheology Analysis of Robusta Coffee Brew
Dynamic Viscosity
The dynamic viscosity was measured in duplicate in accordance with Tarzia et al. in [20] with minor modifications of the type of rheometer and shear rate range. Freshly ground coffee powder (0.6 g) was sieved and mixed with hot distilled water (90 to 95 ℃). The dynamic viscosity of the filtered coffee was determined using a HAAKE RheoStress 600 device (Thermofisher, United States) with a gap of 1 mm, at 60 ℃ and a shear rate (1/s) from 0 to 200 over 300 s. The critical viscosity (η in Pas) and critical shear rate (ɣ̇in 1/s) were identified from the graph of dynamic viscosity.
Frequency Sweep
The frequency sweep was conducted in accordance with Chun et al. in [21] with minor modifications of the type of rheometer and the frequency range. Freshly ground coffee powder (0.6 g) was sieved and mixed with 10 mL of hot distilled water (90 to 95 °C). The frequency sweep of the filtered coffee was determined using a HAAKE RheoStress 600 device (Thermofisher, United States) with a gap of 1 mm, at a temperature of 25 ℃, and under a frequency range of 10-1 to 101 Hz. The storage (G') and loss (G") modulus was determined from the frequency sweep graph and the loss tangent (G"/G') was calculated by dividing the loss modulus with the storage modulus.
Consumer Acceptability Sensory Evaluations
Consumer acceptability sensory evaluations were carried out according to Fine Robusta Standards and Protocols in [22] with minor modifications to the number of panelists and sensory parameters. The sensory evaluations were conducted in the sensory evaluations room at Food 5, Faculty of Food Science and Technology, University Putra Malaysia. There was a total of 62 panelists, ranging in age from 23 to 68 years old and coming from a variety of backgrounds, such as students, housewives, bankers, engineers, and human resource workers. All panelists were regular coffee drinkers consuming at least one cup of coffee per week, with 46 panelists consuming at least one cup per day. The roasted Robusta coffee beans, which in accordance with Section 4.2.2., were allowed to rest for 8 h prior to the sensory session. Prior to the sensory evaluation session, the roasted Robusta coffee beans were ground for 15 min and sieved through a 600 to 710 µm (30 – 25) mesh. The coffee powder (8.75 ± 0.25 g) was transferred to a cup and mixed with 150 ml of hot distilled water (93.5 ± 1.5 ℃) and steeped for 4 min. The panelists evaluated nine sensorial attributes, i.e., (i) powder fragrance/aroma, (ii) coffee beverage fragrance/aroma, (iii) flavor, (iv) aftertaste, (v) salt/acid sensation, (vi) bitter/sweet sensation, (vii) mouthfeel, (viii) overall balance, and (ix) overall preference/impression. The result was recorded using a 9-point hedonic scale.
Statistical Analysis
All results were reported as mean ± standard deviation (SD) and statistical analyses were performed using oneway analysis of variance (ANOVA). Tukey's multiple range tests were used with a probability of p < 0.05 to identify significant differences between the results. The PCA was used to identify the related variables and GLM regression analysis was used to explain the variance of the dependent variables influenced by the independent variables through adjusted R 2 . The direction and strength of correlation between the variables were evaluated using Pearson correlation. The software used for statistical analysis was Minitab V.19 (Minitab Inc., State College, PA, USA).
Result and Discussion
Weight Loss and Hardness of Roasted Robusta Coffee Beans
The Robusta coffee beans lost 8.3 to 8.7% of total weight after a light-medium roast at 245 ℃ for 12.5 min, as shown in Table 1. There was no significant variation (p > 0.05) between the samples, as anticipated, because the impetus for weight loss is the roasting degree, i.e., time and temperature, and the parameter was standardized in all cases [23, 24]. Lee et al. [25] reported the same result, where steer fermentation (inoculate of started culture) did not show any variance in weight loss of roasted coffee beans but rather was attributed to varying roasting levels. During roasting, the thermal energy disrupted the surface film of the coffee beans and produced new capillaries for water diffusion and evaporation [19]. Consequently, water removal occurs mostly at the start of the roasting process, followed by solid mass reduction while vaporization continues. The coffee beans finally cracked as internal pressure increased, releasing a considerable amount of vapor along with other volatile chemical components, including carbon dioxide. This loss is exacerbated as the roasting temperature rises [24, 26, 27]. The vaporization and dehydration process affected the coffee beans' physical as well as chemical properties. The roasted coffee beans exhibited weaker structural characteristics than the green Robusta coffee beans, as shown in Figure 1, due to a higher number of micropores. The hardness of the coffee beans had decreased by 80 to 90% after roasting. The reduction in hardness (p > 0.05) of the coffee beans during fermentation remained evident even after the roasting process. The cause of the softer fermented coffee beans could be evidence of microbial pectinase, amylase, cellulase, and protease activities from SWF that break down cell wall components [28]. Notably, germination during SWF may also contribute to softer, fermented green Robusta coffee beans. During germination, α-galactosidase combines with (1→4)-β-mannan (endo-βmannanase), and β-mannosidases to break down galactomannans, which are the principal component of the cell wall responsible for the hardness of green Robusta coffee beans [29]. In Poláková et al. [30], a comparison is made between the dry and wet fermentation processes for the hardness of green beans. The results indicated that green coffee beans are harder for wet fermentation compared with dry fermentation; however, the difference was not statistically significant.
Table 1 Summary of physical parameters.
| Fermentation | Fermentation | Fermentation | |
|---|---|---|---|
| day 0 | day 3 | day 5 | |
| Percentage (%) of weight loss | 8.297 ± 0.114a | 8.248 ± 0.087a | 8.712 ± 0.536a |
Note: a= mean values ± standard deviations within the same row with a common superscript are not significantly different (p > 0.05).
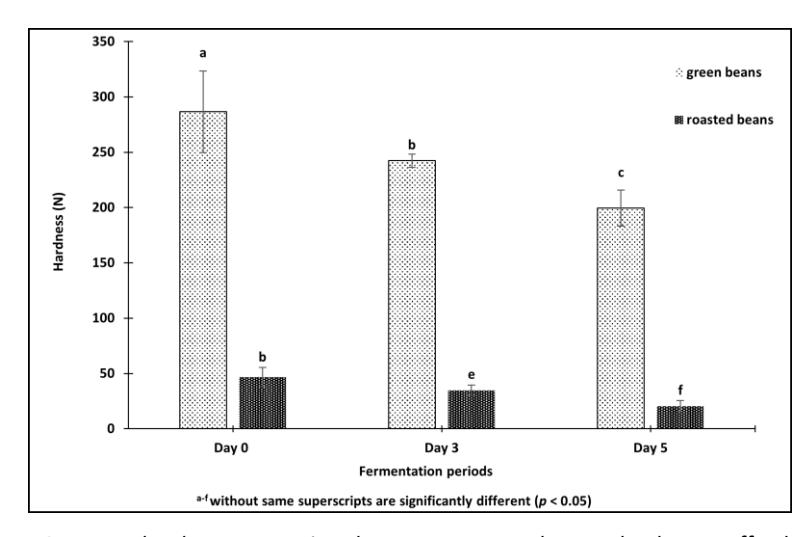
Bean hardness comparison between green and roasted Robusta coffee beans.
With regard to the effect of chemical properties, the pores formed in the roasted coffee bean matrixes led to higher water activities (aW), which may have an impact on the plasticizing effect and shelf life [31]. In terms of the impact on chemical properties, polysaccharides were hydrolyzed by water vapor to various monosaccharide isomers, including glucose and fructose, and subsequent dehydration converted these isomers into diketone
intermediates. Continued thermal-oxidative decomposition of diketone intermediates results in the creation of a variety of final aromatic chemicals such as aldehydes, ketones, and furans [32].
Proximate Composition of Roasted Robusta Coffee Powder
The proximate composition of the roasted Robusta coffee powder is shown in Table 2. Carbohydrates dominated the composition of roasted Robusta coffee, with non-FRRC containing approximately 5% fewer carbohydrates than FRRC beans at both 3 and 5 days of SWF. SWF likely contributed to the degradation of cell wall polysaccharides (CWP) into disaccharides and monosaccharides, including arabinose, xylose, and galactose, which contributed to the higher carbohydrate content of FRRC beans. This is consistent with the crude-fiber content, which was roughly 1.5% lower in FRRC compared to non-FRRC and serves as basic confirmation of cellulose, hemicellulose, and pectin from CWP breakdown to simple carbohydrates. During SWF, these simple carbohydrates are a crucial carbon source for microbial survival and multiplication, while in the roasted Robusta coffee, they contributed to the production of LMW melanoidins or degraded into volatile chemicals.
| Fermentation | Fermentation | Fermentation | |
|---|---|---|---|
| Proximate composition | day 0 | day 3 | day 5 |
| Moisture (%) | 2.85 ± 0.17a | 2.76 ± 0.20a | 2.48 ± 0.01a |
| Ash (%) | 5.18 ± 0.05a | 5.17 ± 0.03a | 4.51 ± 0.04b |
| Fat (%) | 10.33 ± 0.12a | 10.61 ± 0.08a | 10.82 ± 0.12a |
| Protein (%) | 9.69 ± 0.537a | 6.97 ± 0.01b | 6.60 ± 0.02b |
| Crude Fiber (%) | 17.13 ± 0.16a | 15.95 ± 0.014b | 15.46 ± 0.04c |
| Carbohydrate (%) | 54.66 ± 0.18a | 59.03 ± 0.09b | 59.81 ± 0.14c |
| Total % | 100 | 100 | 100 |
Table 2 Approximate compositions of roasted Robusta coffee powder.
Note: a-c = mean values ± standard deviations within the same row without common superscripts are significantly different (p < 0.05).
Similar to the crude fiber content, the protein content of the FRRC was approximately 3% lower, which is in line with the study conducted by Lee et al. [33] after fermentation of coffee beans using Y. lipolytica. The degradation of proteins during SWF leads to a rise in free amino acids such as (i) alanine, (ii) proline, (iii) phenylalanine, (iv) aspartic, and (v) glutamic acids, which are responsible for the formation of antioxidant and flavor compounds [34-36]. Phytochemicals with C6C3-phenyl groups such as vanillin, 3-(3,4-dimethoxyphenyl)acrylic acid and 2 methoxy-4-vinylphenol that are derived from L-phenylalanine or L-tyrosine in the presence of phenylalanine ammonia-lyases (PAL) via the shikimic acid pathway are examples of antioxidant compounds derived from amino acids [37, 38].
The fat content comprised a significant portion of the roasted coffee beans, i.e., around 10% of the bean's composition. This fraction mostly consisted of triglycerides and free fatty acids. However, no significant variation (p > 0.05) was observed in the fat content throughout the fermentation period. This finding is consistent with the findings reported by Osorio Perez et al. in [39]. However, the literature review of Febrianto and Zhu [40] presents a contrasting viewpoint, suggesting that the fat content of coffee beans may vary depending on the fermentation methods used, such as using a bioreactor, as well as the specific microorganisms involved in the fermentation process that could metabolize fat. The fat level in roasted coffee beans can be affected by the degree of roasting, whereby higher temperatures result in increased oil content in a consistent manner. However, this likewise leads to lipid oxidation, which has an impact on the sensory qualities of the coffee [41]. The ash concentration exhibited a significant reduction (p < 0.05) after 5 days of wet fermentation, consistent with the findings of [42]. Yet, limited explanations for this outcome have been provided by other literature.
Color Properties of Robusta Coffee Powder and Brew
According to Table 5.3, the lightness intensity of the FRRC bean powder appeared significantly (p < 0.05) darker (low luminosity), i.e., L*35.547, when compared with the Robusta coffee beans that underwent 3 days and 5 days of fermentation, i.e., L*47.777 and L*49.553, respectively. Similarly, the red and green values of the non-FRRC powder were significantly greater (p < 0.05). Low luminosity (darker) of the non-FRRC beans was likely due to a higher ratio of high molecular weight (HMW) melanoidins (> 10 kDa) formation from complex polymers of protein (hydrazyl group) and sugar (carbonyl group) [43-45]. In contrast, the FRRC powder exhibited a lighter brown hue, most likely as a result of a higher ratio of low molecular weight (LMW) melanoidins derived from
LMW carbohydrates, specifically monosaccharides [20, 46]. In a striking contrast, the FRRC brew was significantly darker (p < 0.05) than the non-FRRC brew. The probable reason was related to the solid content in the coffee brew, which is further elaborated in the subsequent discussion.
Table 3 Color properties of roasted Robusta coffee.
| Fermentation day 0 | Fermentation day 3 | Fermentation day 5 | |
|---|---|---|---|
| Robusta coffee pow | der | ||
| CIE L* a* b* color | L*35.547 ± 1.435b a*7.433 ± 0.289a b*10.000 ± 0.173a | L*47.777 ± 0.176a a*1.217 ± 0.211c b*3.977 ± 0.516b | L*49.553 ± 0.580a a*2.393 ± 0.153b b*4.830 ± 0.0432b |
| Robusta coffee brev | v | ||
| CIE L* a* b* color | L*35.180 ± 0.522a a*7.489 ± 0.369b b*5.483 ± 0.206a | L*32.117 ± 0.123b a*8.03 ± 0.945a b*3.86 ± 0.730b | L*31.983 ± 0.214b a*6.767 ± 0.326b b*4.590 ± 0.165b |
Note: \(a^{-c}\) = mean values \(\pm\) standard deviations within the same row without common superscripts are significantly different (p < 0.05). The color chart was obtained from Nix Sensor (nixsensor.com/free-color-converter)
Since the aim of the present study was to evaluate the influence of SWF on physicochemical properties, the degree of roasting was held constant across all cases in order to minimize the influence of other factors besides SWF. The above-mentioned one-way ANOVA analysis in Table 3 indicates that the means of the variables were significantly different (p < 0.05) for each fermentation period. However, the direction of the effect caused by SWF could not be shown by one-way ANOVA analysis. Hence, the relationship was validated further by GLM and Pearson correlations, which are presented in Tables 4 and 5. The positive coefficient in the regression equation for coffee powder lightness suggests that the coffee powder became lighter by 3.407 to 5.037 units from the overall means as the fermentation period increased. However, the regression equation for coffee brew presented the opposite outcome. The adjusted \(R^2\) of the fermentation period and the lightness of the coffee powder was 93.63%, indicating that if there was a variation in lightness, 93.63% was due to the change in fermentation period, and only 6.37% was due to error or unexplained factors. A similar interpretation was given to the coffee brew lightness. From the Pearson correlations analysis, the SWF period demonstrated a significant (p < 0.05) and very strong correlation with the lightness of both Robusta coffee powder (r = 0.948) and brew (r = -0.988). The observed positive correlation between fermentation period and coffee powder lightness signifies that longer fermentation periods could cause an increase in LMW, which in turn contributes to a lighter brown hue. Conversely, the higher solubility of LMW in the brew may result in a darker brown hue, indicating a negative correlation. This observation may be due to the variation of volatile and non-volatile phytochemical compounds in the Robusta coffee beans.
Table 4 GLM of fermentation period with lightness of Robusta coffee powder and brew.
| Independent variable | Dependent variable | Model p- value | Regression Equation |
|---|---|---|---|
| Fermentation periods | Coffee powder lightness | 0.000 | Coffee powder lightness = 44.453 – 8.443 fermentation day 0 + 3.407 fermentation day 3 + 5.037 fermentation day 5 Adjusted R2 = 93.63% |
| Coffee brew lightness | 0.000 | Coffee brew lightness = \(33.1883 + 2.2867\) fermentation day 0 – 1.0033 fermentation day 3 – 1.2833 fermentation day 5 Adjusted \(R^2 = 99.17\%\) |
Table 5 Pearson correlations of fermentation period with lightness of Robusta coffee powder and brew.
| Variables | Fermentation period | Coffee powder lightness |
|---|---|---|
| Coffee powder lightness | 0.948 | |
| Coffee brew lightness | -0.941 | -0.988 |
Noted: All correlations are significant (p < 0.05).
The color of the green Robusta coffee beans generally was greenish-brown and changed to brown after roasting. Chlorophyll is believed to be the primary pigment responsible for the green hue before roasting [47]. After roasting, chlorophyll degrades into pheophytins and transforms into a brown hue [48]. Furthermore, sugar caramelization and the synthesis of melanoidin compounds such as 2-furoic acid, 2-furylmethanol, 4 hydroxybezoic acid, and 3,4-dihydroxybenzoic acid from Tables 4.1 and 4.2 during roasting could influence the luminous intensity and pigment variation [24, 26]. In addition, it has been reported that portions of hydroxycinnamates such as p-coumaric, caffeic acids, and phenolic compounds, such as (i) 2-methoxy-4 vinylphenol, (ii) (2E)-3-(3,4-dimethoxyphenyl)acrylic acid, and (iii) CQA, make a significant contribution to the formation of melanoidin by interacting with the amide carbonyls of the peptide [49].
In terms of roasting degree influence, researchers conceived of optimizing the roasting time and temperature, such as 22 to 28 min at a temperature of 225 to 230°C, which corresponded to the formation color of L* between 37.05 and 40.69, a* between 2.29 and 4.15 and b* between 2.70 and 6.29.5 of roasted Robusta coffee beans and could produce better sensory attributes [50]. Nevertheless, the study of Pramudita et al. in [26] refuted the aforementioned theory by demonstrating that the same color of roasted Robusta coffee beans can result in distinct roast loss and compound profiles. For instance, roasting at a lower temperature for a longer time (to achieve the same color as roasting at a higher temperature) promotes the formation of intermediate-molecularweighted melanoidins. In contrast, HMW melanoidins were produced during high-temperature roasting.
Total Soluble Solids, Water Solubility Index and Water Absorption Index of Roasted Robusta Coffee Powder
In order to avoid the participation element of powder size to solid solubility, the powder size in the current study was identical in all cases since the investigation interest was the effects of SWF. Comparing FRRC with non-FRRC in Table 6, the TSS was approximately 21% significantly (p < 0.05) greater in FRRC. WAI had comparable results, with an FRRC that was approximately 8% (p < 0.05) greater; however, the main distinction between TSS and WAI is that WAI is measured based on the total solid content retrieved after drying of the supernatant. Further GLM analysis in Table 7 and Pearson correlations in Table 8 validated the TSS and WSI as substantially strong positive correlates (r > 0.9) to fermentation period. The positive coefficient in the regression equation from Table 7 confirmed that the TSS and WSI means increased with a longer fermentation period by 0.15 to 1.2 units. The adjusted R 2 also suggests that the variation was only 8.77% to 14.85% due to error or unexplained factors. This observation is consistent with the notion that SWF tends to degrade complex cell wall polymers, including proteins and crude fibers, as described in Section 5.3.3, thereby increasing the availability of free and LMW carbohydrates and amino acids [36, 51]. Additionally, the decomposition of cell wall materials, particularly hemicellulose and pectin, during SWF leads to an increase in free-soluble arabinogalactans and glucomannans, which can be extracted as soluble solids from coffee fluid [52]. As a result, LMW melanoidins are formed and dominant in FRRC, where they are more soluble in coffee brew compared with HMW melanoidins, producing lower illumination, as shown in Table 3 [53, 54]. The effect of TSS on viscosity is discussed further in following rheology properties.
Table 6 TSS, WSI and WAI of roasted Robusta coffee powder.
| Fermentation day 0 | Fermentation day 3 | Fermentation day 5 | |
|---|---|---|---|
| TSS (°Brix) | 1.0 ± 0.1a | 1.2 ± 0.1b | 1.3 ± 0.0c |
| WSI | 20.8 ± 0.7a | 22.4 ± 0.2ab | 23.4 ± 0.3b |
| WAI | 78.2 ± 0.1a | 77.0 ± 0.0b | 76.4 ± 0.3b |
Note: a-b = mean values ± standard deviations within the same row without common superscripts are significantly different (p < 0.05).
Independent variable Dependent variables Model pvalue Regression Equation Fermentation periods TSS 0.012 TSS = 1.1500 – 0.1500 Fermentation day 0 + 0.000 Fermentation day 3 + 0.1500 Fermentation day 5 Adjusted R2 = 91.23% WSI 0.000 Water solubility index = 22.191 – 1.404 Fermentation day 0 + 0.241 Fermentation day 3 + 1.191 Fermentation day 5 Adjusted R2 = 85.15%
Table 7 GLM of fermentation period with TSS, WSI and WAI.
Table 8 Pearson correlations of fermentation period with TSS, WAI and WSI.
| Fermentation period | WSI | Brew lightness | |
|---|---|---|---|
| WSI | 0.954 | ||
| Brew lightness | -0.941 | -0.891 | |
| TSS | 0.967 | 0.934 | -0.876 |
Note: All correlations with fermentation period are significantly different (p > 0.05).
Flow Properties of Roasted Robusta Coffee Powder
Regarding the flow ability properties described in Table 9, the bulk density of the ground coffee powder did not show any significant variation (p > 0.05) in all cases. Similar to the tapped density, it also did not show any significant variance (p > 0.05). This result was anticipated because the flow properties of coffee powder are influenced by particle size, shape, and the surrounding environment, such as humidity and temperature, rather than SWF [55]. The powder's bulk density and tapped density indicate the mass of a powdered substance per unit volume, which is an important property that can be used to calculate the powder's flow ability (as measured by the Hausner ratio) and compressibility (as measured by the Carr index) to evaluate if the coffee powder flows freely without being significantly affected by interparticle frictional force and compacts tightly [56]. The Hausner ratio and Carr index in the present study demonstrated that the ground coffee powder had poor flow characteristics, most likely due to the rough and irregular surfaces created by burr grinding, as opposed to spraydried powder, which produces more uniform and smooth surfaces [55, 57]. This finding also revealed that greater vibration energy may be required to pack burr-grinded coffee Robusta powder for packing and shipment [58].
Table 9 Flow properties roasted Robusta coffee powder.
| Flow properties | Fermentation day 0 | Fermentation day 3 | Fermentation day 5 |
|---|---|---|---|
| Bulk density (g/cm3 ) | 0.395 ± 0.018a | 0.404 ± 0.018a | 0.361 ± 0.016a |
| Tapped density (g/cm3 ) | 0.564 ± 0.026a | 0.577 ± 0.020a | 0.516 ± 0.023a |
| Hausner ratio | 1.429 ± 0.000 | 1.429 ± 0.000 | 1.429 ± 0.000 |
| Carr index | 30.000 ± 0.000 | 30.000 ± 0.000 | 30.000 ± 0.000 |
Note: a = mean values ± standard deviations within the same row with common superscripts are not significantly different (p > 0.05).
pH of Roasted Robusta Coffee Brew
The pH values in Table 10 show no significant difference (p > 0.05), ranging from 5.465 to 5.595. The weak acidity in the coffee brew was likely due to the presence of organic acids, such as citric acid, and they were generally heat-stable, which could explain the uniformity of pH in the current investigation for all cases [33].
Table 10 pH of roasted Robusta coffee brew.
| Parameter | Fermentation | Fermentation | Fermentation |
|---|---|---|---|
| day 0 | day 3 | day 5 | |
| pH | 5.465 ± 0.021a | 5.595 ± 0.009a | 5.515 ± 0.148a |
Note: a= mean values ± standard deviations within the same row with a common superscript are not significantly different (p > 0.05).
Rheology Properties of Roasted Robusta Coffee Brew
According to Table 11, the FRRC brew had a significantly lower (p < 0.05) critical viscosity and critical shear rate than the non-FRRC brew. The critical shear rate corresponds to the critical viscosity as a measure of the point at which shear-thickening begins. The lower the critical shear rate, the greater the volume fraction of particles [59]. Therefore, the result indicates that the FRCR produced a more viscous liquid due to a greater concentration of solid contents. To further validate this statement, GLM and Pearson correlation of fermentation durations, TSS and critical viscosity were performed; the results are shown in Tables 12 and 13. The GLM models with a p-value less than 0.05 validated the effect of fermentation periods and TSS on critical viscosity. The negative coefficient in the regression equation provides additional support for the prediction that longer fermentation periods and higher TSS are associated with decreased critical viscosity (more viscous) in coffee brews.
Table 11 Rheology properties of roasted Robusta coffee brew.
| Fermentation day 0 | Fermentation day 3 | Fermentation day 5 | |
|---|---|---|---|
| Critical Viscosity (η in | 0.056 ± 0.004a | 0.018 ± 0.000b | 0.011 ± 0.000b |
| Pas) at 60 oC Critical shear rate (ɣ̇in | 95.750 ± 0.057b | 79.950 ± 0.000a | 71.750 ± 0.042c |
| 1/s) at 60 oC Storage modulus (G') | 0.239 ± 0.041a | 0.263 ± 0.011a | 0.216 ± 0.011ab |
| Loss modulus (G") | 0.207 ± 0.024ab | 0.184 ± 0.037ab | 0.143 ± 0.037b |
| Loss Tangent (G"/G') | 0.873 ± 0.06a | 0.703 ± 0.156a | 0.660 ± 0.139a |
Note: a-c = mean values ± standard deviations within the same row without common superscripts are significantly different (p < 0.05).
Table 12 GLM of fermentation period and critical viscosity.
| Independent variable | Dependent variables | Model p value | Regression Equation |
|---|---|---|---|
| Critical viscosity = 0.028260 + 0.02806 Fermentation | |||
| Fermentation | Critical viscosity | 0.001 | day 0 – 0.01052 Fermentation day 3 |
| periods | – 0.01755 Fermentation day 5 | ||
| Adjusted R2 = 98.91% | |||
| Critical viscosity = 0.02563 + 0.03069 TSS 1.000 – | |||
| TSS | Critical viscosity | 0.010 | 0.00787 TSS 1.100 – 0.00791 TSS 1.200 |
| – 0.01492 TSS 1.300 | |||
| Adjusted R2 = 98.36% |
Table 13 Pearson correlations of fermentation period with TSS and critical viscosity.
| Fermentation period | Critical viscosity | |
|---|---|---|
| Critical viscosity | -0.962 | |
| TSS | 0.967 | -0.901 |
Note: All correlations with fermentation period are significantly different (p > 0.05).
The strong correlation (r = 0.967) between fermentation period and TSS provides clear insight that a longer fermentation period resulted in more TSS, and both variables strongly affected (r = -0.962 and r = -0.901) the coffee brew's viscosity. In terms of the rheology concept, coffee fluid exhibits shear-thickening characteristics, as shown in Figure 2: the viscosity increased as the shear rate increased [60]. Further frequency sweep, as illustrated in Figure 3, demonstrates that the coffee brew was in all cases more susceptible to a solid-elastifying state with gel-like properties (G' > G'') than a liquid-viscosifying state. Chun et al. in [21] reported a similar finding that the elastic components of coffee fluid in all cases were greater than the viscosity. Even so, further loss tangent (Tan δ = G" /G') analysis denoted weak gel in all cases, the intermediate material state between the ideal Newtonian fluid (finite viscosity) and Hookean solid states (finite shear modulus), since the Tan δ > 0.1 [61- 63]. Food gels defined as a high moisture three-dimensional polymeric network that resists flow under pressure and preserves their specific structural shape (mechanical rigidity). Hydrogen bonds, electrostatic forces, Van der Waals forces, and hydrophobic interactions between polysaccharides and proteins are typically liable for the formation of such networks [64]. The gelling effects of Robusta coffee brew could be explained by the interaction between pectin, arabinogalactan, and galactomannans [64-66].
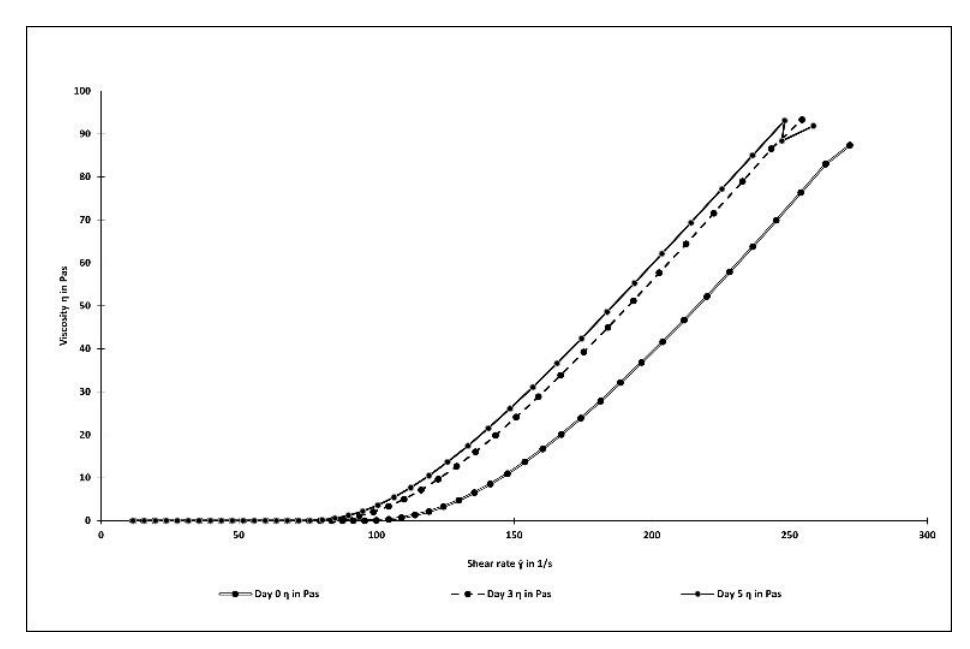
Shear rate versus viscosity of roasted Robusta coffee brew.
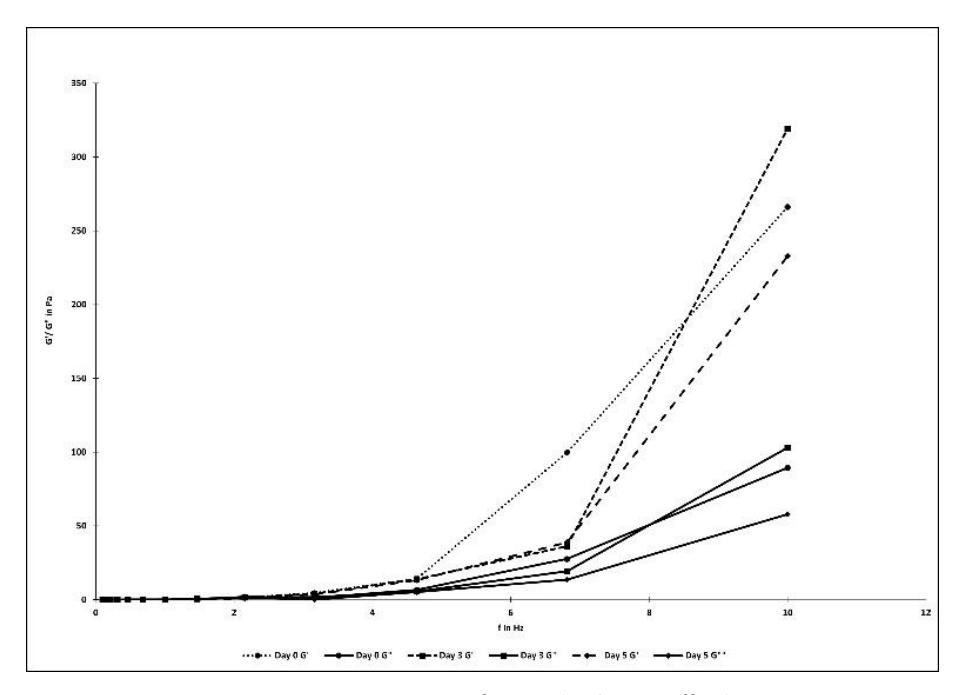
Frequency sweep of roasted Robusta coffee brew.
Consumer Sensory Acceptability
The present sensory acceptability study adapted the cupping protocol from Fine Robusta Standards and Protocols, 2019, which is a technical standard developed by CQI in collaboration with the Uganda Coffee Development Authority (UCDA). The evaluation scale was modified to employ the commonly used 9-point hedonic scale rather than the cupping rating scale used by industry professionals [4,67]. Uniform cups (consistency of flavor of the different cups of the sample) scoring was compensated by adequate sample size of panelists (n = 62), while clean cup evaluation was excluded because this attribute was used to merit or disqualify particular sensory samples and is not in accordance with the principle of consumer preference evaluation [68]. Only regular coffee drinkers were chosen for the preference test in order to provide a more accurate and objective evaluation [69]. Referring to Figure 4, the FRRC scored significantly higher (p < 0.05) on eight of the nine parameters evaluated in the current study. However, there was no significant difference (p > 0.05) in the powder aroma in all cases. Between the FRRC, consumers preferred coffee brew that underwent 5 days of SWF.
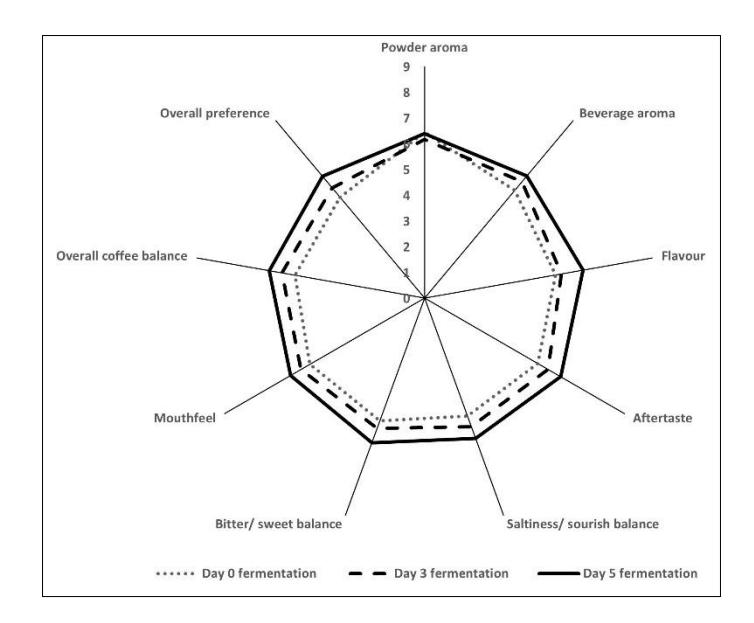
Consumer sensory acceptability rating for roasted Robusta coffee brew.
Conclusion
After SWF, the FRRC beans are softer, and the variation in color, whether in coffee beans or brew, indicates distinctions in chemical structure and composition. Additionally, higher soluble solids from FRRC brews with low luminosity have been confirmed. According to the coffee powder proximate composition, it is believed that the higher soluble solids in FRRC were caused by the decomposition of proteins and crude fiber. Also, an increase in soluble solids increases the viscosity of coffee brew. The frequency sweep revealed that coffee brew more closely resembles a solid state with a mild gelling effect. The consumer sensory acceptability evaluation revealed that eight out of nine parameters had significantly higher (p < 0.05) scores than non-fermented Robusta coffee, with 5-day FRRC obtaining the highest score.
Compliance with ethics guidelines
The authors declare that they have no conflict of interest or financial conflicts to disclose.
This article does not contain any studies with human or animal subjects performed by any of the authors.