
Introduction
Volcanoes in Indonesia need to be monitored continuously, during or after an eruption, to know the status and to predict the next eruption [1-5]. There are issues with the existing Indonesian volcano monitoring system (consisting of sensors and a radio-communication telemetry system only for seismicity data), which may delay the automatic response required for anticipating the effect of a disaster [2]. For example because of delayed, non-real-time, and not automatically managed data, while the system is also unsafe for users in the field. Therefore, since 2013, we have been developing a new volcano monitoring system, called MONICA, consisting of a wireless sensor network (WSN), a mobile robot, and unmanned aerial vehicles(UAVs), to solve these problems [1-5]. A mobile robot (called Prawira) was designed to be deployed in this dangerous area and other locations where other sub-systems such as the monitoring sensor (WSN) are defective [6, 7].
Mobile robots for volcano monitoring systems, which have been developed in Japan, USA and Europe, are limited by their big size, rigid movement and are able to monitor only one physical parameter (such as gases) [7-9]. Prawira (Perangkat Kendaraan Tanpa Awak untuk Wilayah Rawan – an unmanned ground vehicle for dangerous areas) is the first four-wheeled mobile robot designed for both exploration and volcano monitoring in Indonesia, to improve the limitations of previous robot designs [7]. Automatic obstacle avoidance is a requirement for field robotssuch as Prawira. To move over uneven volcano surfaces with rocks and some vegetation areas, the robot has to successfully detect and avoid these [10]. In some research, object detection systems have been proposed, even though some of them have not been tested in real conditions yet. YOLOv3 (You Look Only Once – an object detection algorithm [11]) has been tested in a semi-controlled environment. Nevertheless, this version runs slower than the latest version (YOLOv5) [16]. YOLO – a deep learning-based detector [12] – is the fastest algorithm for detecting objects compared to others, such as Faster R-CNN (Region-Based Convolutional Neural Network) [13-15].
Faculty of Earth Science and Technology, Institut Teknologi Bandung, Jalan Ganesa 10, Bandung 40132, Indonesia
This research used YOLOv5s – a variant of YOLOv5 (the latest version of YOLO, which has the fastest running time at 244 FPS in 1 GPU) [16,17]. This small variant with its small file size is suitable for implementation in Raspberry Pi3 [7] to control the front camera of the robot. Although this variant has low detection accuracy, it is tolerable for field application purposes [18]. The system has been tested on Tangkuban Parahu Volcano, an active stratovolcano located in the Sunda Volcanic Complex (SVC), West Java Province, Indonesia [19]. This volcano has ten craters, with the two biggest of them (Ratu Crater and Domas Crater) frequently releasing gases and molten sulphur [20]. The testing took place around Ratu Crater, which is covered with various rocks (pyroclastic rocks, Neogene sedimentary rocks, coarse, composite, hypabyssal rocks, quartz, pyroxene, etc.) of various sizes [21,22]. Furthermore, there is also vegetation near the craters, dominated by Vaccinium sp., Eugenia sp., Gaultheria leucocarpa, and Gaultheria puntata [23].
Related Work
The mobile robot navigation system relies on a classification method involving ground plane segmentation to identify various objects encountered on the scene. This classification is crucial for implementing different mobile robot navigation algorithms, such as obstacle avoidance, path planning, target following, and landmark detection algorithms [24]. In their research, Conrad and DeSouza utilized a modified Expectation Maximization (EM) algorithm to navigate the mobile robot by segmenting object images from the ground plane. However, despite the accuracy achieved in their research, the detection process was limited to distinguishing between ground and non-ground objects.
Moreover, advancements in unmanned surface vehicles (USVs) have expanded navigation capabilities across various domains, including air, land, underwater, and surface environments [25]. USVs have been instrumental in environmental missions such as volcano monitoring, marine exploration, and military applications. Garcia [25] emphasized the importance of obstacle avoidance for achieving optimal robot performance in such missions. In a related study by Adam Gunnarsson in 2019 [26], two object detection methods, SSDLite and YOLOv3-tiny, were compared using the COCO dataset. Gunnarsson aimed to assess the suitability of real-time object detection on a Raspberry Pi by varying input size parameters to measure speed and accuracy [26]. While SSDLite performed better in terms of frames per second (fps), YOLOv3-tiny excelled in inference time.
The study by Layek in 2018 [18], developed an integrated surveillance system using Raspberry Pi- and YOLO-based object recognition. This system conducts surveillance in two stages: simple processing on the Raspberry Pi and cloud-based analysis of continuous information sent from the device [18]. The Raspberry Pi performs basic motion analysis, while the cloud detects and records individual objects within the field of view (FoV) [18]. The evolution of object detection algorithms, from YOLOv3 to YOLOv5, highlights ongoing advancements in real-time detection capabilities [27,28]. YOLOv5, with its fast detection speed of 140 frames per second on a Tesla P100, outperformed its predecessors, demonstrating the continual progress in this field, although no real-environment testing has been reported. Therefore, in this research, YOLOvs was implemented on a Raspberry Pi 3 for a real volcano object detection system for a mobile robot. Before the system was tested on a real volcano, it a model was generated that had been trained beforehand through labeling and augmentation.
Labeling
This real-time detection system was applied to the obstacle avoidance mechanism of the robot so the robot can detect objects that it should avoid [29]. In this case, the objects are rocks and trees [22,23]. Two hundred pictures of rocks and two hundred pictures of trees in JPG/JPEG format, taken from a real volcano, were used as the dataset for the training process, with the number 0 indicating trees and 1 indicating stones as class names before the labeling process. It used LabelImg (an open-source tool for graphically labeling pictures, written in Python and the QT application as a framework development application in YOLO) for the process where the picture is labeled and the object is segmented by a bounding box [11].
Augmentation
Augmentation changes the dataset (pictures) during training to increase the model's performances, for example by flipping, rotating, cropping, adding noise, occluding portions of the images, etc. In this research, the pictures were augmented in two ways: rotation and blur. Rotation is related to the camera orientation of the robot, which mostly moves on uneven terrain or rolls over on this surface. Blur represents visual distortion because of fog or ash from the volcano. The dataset was augmented before it was divided into three parts. We used a composition of 70% for training, 20% for validation, and 10% for testing.
Training
The dataset was trained by Google Colab using Python 2 and 3 on an open-source platform. Some aspects had to be considered for the training process: the YOLOv5 repository cloning step (model, utilization for analysis, and plotting the graphs, weight, etc.) as the pre-training process, converting the dataset format to txt by YOLOv5 Pytorch, and defining the configuration and architecture of YOLOv5 for the Raspberry Pi's maximum memory capacity (16 GB).
Furthermore, there were some adjustments in the training process: the size of the input images, the batch size, the number of epochs, the data settings, the model configuration, the directory for the training result, and the training acceleration. Epochs were used in three variants of batch 16 (which produced the best gradient descent [30]): 100, 300, and 500 epochs. The results are presented in mAP (mean average precision) and loss curves to determine the best variant for implementation on a Raspberry Pi [31].
Raspberry Pi3 Implementation
The implementation of YOLOv5 for object detection has been researched extensively by previous researchers. The table below (Table 1) presents a comparison between the algorithm and similar object detection algorithms to show that YOLOv5 is reliable for the purposes of this research, i.e., the versions YOLOv5 large (YI), YOLOv5 medium (Ym), YOLOv5 small (Ys), ResNet50 (FPN), VGG16, MVGG16, Mobile-Net V2, and Inception V3. YOLOv5 small (Ys) has the smallest model size, at 14.8 MB [32].
| Metrics | Yolov5 | Faster R-CNN | ||||||
|---|---|---|---|---|---|---|---|---|
| Yı | Ym | Ys | ResNet5 0 (FPN) | VGG16 | MVGG1 6 | Mobile- Net V2 | Inceptio n V3 | |
| Precision (P) | 86.43% | 86.96% | 76.73% | 91.9% | 69.8% | 81.4% | 63.1% | 72.3% |
| Training loss | 0.015 | 0.017 | 0.020 | 0.065 | 0.226 | 0.136 | 0.209 | 0.149 |
| Mean average precision (mAP@0.5-0.95) | 63.43% | 61.54% | 58.9% | 64.12% | 35.3% | 45.4% | 30.5% | 32.3% |
| Inference speed: image resolution (1774 × 2365) | 0.014 s | 0.012 s | 0.009 s | 0.098 s | 0.114 s | 0.047 s | 0.036 s | 0.052 s |
| Inference speed: image resolution (204 × 170) | 0.018 s | 0.013 s | 0.009 s | 0.065 s | 0.119 s | 0.052 s | 0.032 s | 0.056 s |
| Training time/epoch | 26 s | 16 s | 12 s | 124 s | 173 s | 105 s | 80 s | 95 s |
| Total training time | 31,200 s | 19,200 s | 14,400 s | 12,400 s | 17,300 s | 10,500 s | 8000 s | 9500 s |
| Model size (MB) | 95.3 | 43.3 | 14.8 | 165.7 | 175.5 | 134.5 | 329.8 | 417.2 |
Table 1 Comparison of YOLOv5 and Faster R-CNN performance [32].
On the other hand, Raspberry Pi as the operating system for the mobile robot in this research, has 1 GB of memory, and the micro-SD card used had a capacity of 16 GB. Along with several integrated programs, YOLOv5s was chosen due to its smaller weight, smallest training time per epoch, highest inference speed, and better mean average precision (mAP@0.5-0.95, at 58.9%) compared to Faster R-CNN (VGG16, MVGG16, Mobile-Net V2, and Inception V3) [32].
Raspberry Pi3 is a Broadcom-based computer that consists of an ARM processor, graphic chip, RAM, GPIO, and other connectors for external devices. It has a Linux operating system, USB ports, and ethernet for internet or peer-to-peer network connectivity [33] for configuring the training result of YOLOv5 to be implemented on this small computer (Figure 1).
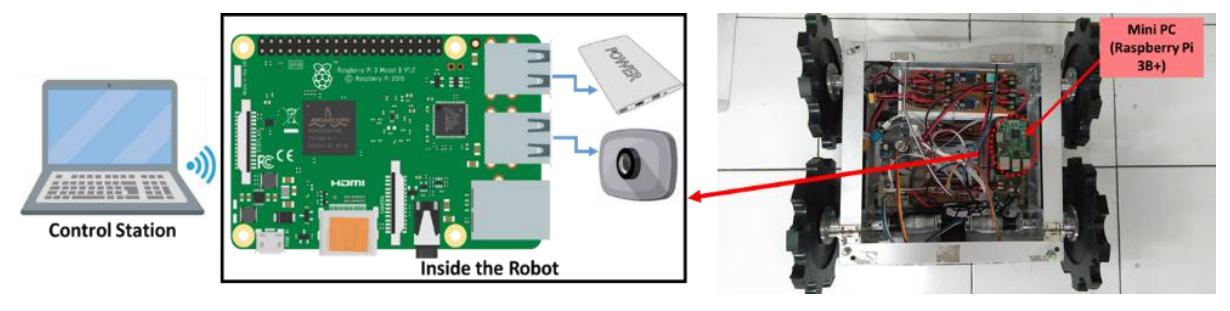
Figure 1 The system configuration (left) shows the Raspberry Pi 3 integrated into the robot's prototype, as shown in the picture on the right [7].
After the library had been installed, installation of the directory, the virtual environment, and all dependencies was prepared. Moreover, TFLite and Pytorch (an open-source library for Python [34, 35] machine learning in computer vision) were installed for the Raspberry architecture. A Git clone was used for downloading YOLOv5 in the Raspberry Pi terminal before the requirements were installed. The objects were detected in Phyton version 3 by a camera as the source for testing the third model in Section 3.1 (batch = 16, epochs = 500) in its specific location.
The data acquired by real-time object detection was transferred through the cloud server of YOLOv5 to the control station (Figure 2), where it was processed to get the confusion matrices [36]: TP (true positive – both prediction and real data are positive), TN (true negative – both prediction and real data are negative), FP (false positive – positive prediction and negative real data), and FN (false negative – negative prediction and positive real data) for calculating recall (how accurately the classification model identified all relevant samples), precision (how precise the model returns the relevance), recall–precision combination such as the F1 score (combining recall and precision using harmonic average), FPR (false positive rate as error probability), and accuracy as the summation of TP and TN divided by the summation of all confusion matrices [37].
The connection between the Raspberry Pi and the monitor screen (laptop) uses cloud technology [18], allowing for the continuous exchange of information between the Raspberry Pi and the laptop.
Result and Discussion
Variation of Epochs (100, 300, and 500) for 16 Batches
The thin orange graphs of Figure 3 show mAP 0.5 (a), mAP 0.5:0.95 (b), precision (c), and recall (d) of 100 epochs for batch 16 of the dataset, which generated 14.8 MB of both the last and best weights in 696 seconds. These graphs were smoothed into the thick graphs of Figure 3 to approach the mean value on a bigger scale [38]. This smoothing process was also applied to both the blue (300 epochs) and the red graphs (500 epochs).
For 100 epochs, the mean average precision (mAP) value was 59.6% (orange graphs of Figure 3). mAP 0.5 shows 0.5 IoU (intersection over union) [11,39] of the mean average precision, where AP is a popular matrix for calculating the accuracy of object detection, by counting the mean of precision value between 0 and 1, while IoU calculates the overlap of prediction and ground truth (the real object boundary). Furthermore, mAP 0.5:0.95 for this number of epochs was 34%, where the IoU of the mean average precision increased 0.05 times from 0.5 to 0.95 [30].
This result corrects Bochkovskiy's statement that the mAP for the smallest YOLO model (YOLOv5 series) is between 26% and 36% [30]. This result is a new finding for object detection in a volcano environment, specifically Tangkuban Parahu, where there is no other object detection done by other robots or systems. Moreover, the mAPs to know the quality of the train for this number of epochs were near the value for the YOLOv5 series using the COCO dataset (which has lower dataset quality than the dataset in this research) in the related checkpoint table from Ulralytics, which were 55.4% and 36.7% for 0.5 mAP and 0.5:0.95 mAP respectively [40]. Meanwhile, the precision (Figure 3(c)) tended to rise (Figure 3(d)) for this number of epochs, as well as the recall.
300 epochs (blue graphs of Figure 3) and 500 epochs (red graphs of Figure 3) also had the same last and best weights as 100 epochs (14.8 MB) in 1,995 seconds and 5576 seconds of training time for 300 epochs and 500 epochs, respectively. They also corrected Bochkovsky's statement and Ultralitic's table of YOLOv5 series [40] with 62.9% of 0.5 mAP and 37% of 0.5:0.95 mAP for 300 epochs and 63.4% of 0.5 mAP and 40.4% of 0.5:0.95 mAP for 500 epochs. Furthermore, precision and recall also tend to rise for both numbers of epochs. This result shows that the picture quality of the dataset has an important influence on the training results as well as the precision of the bounding box and object detail.
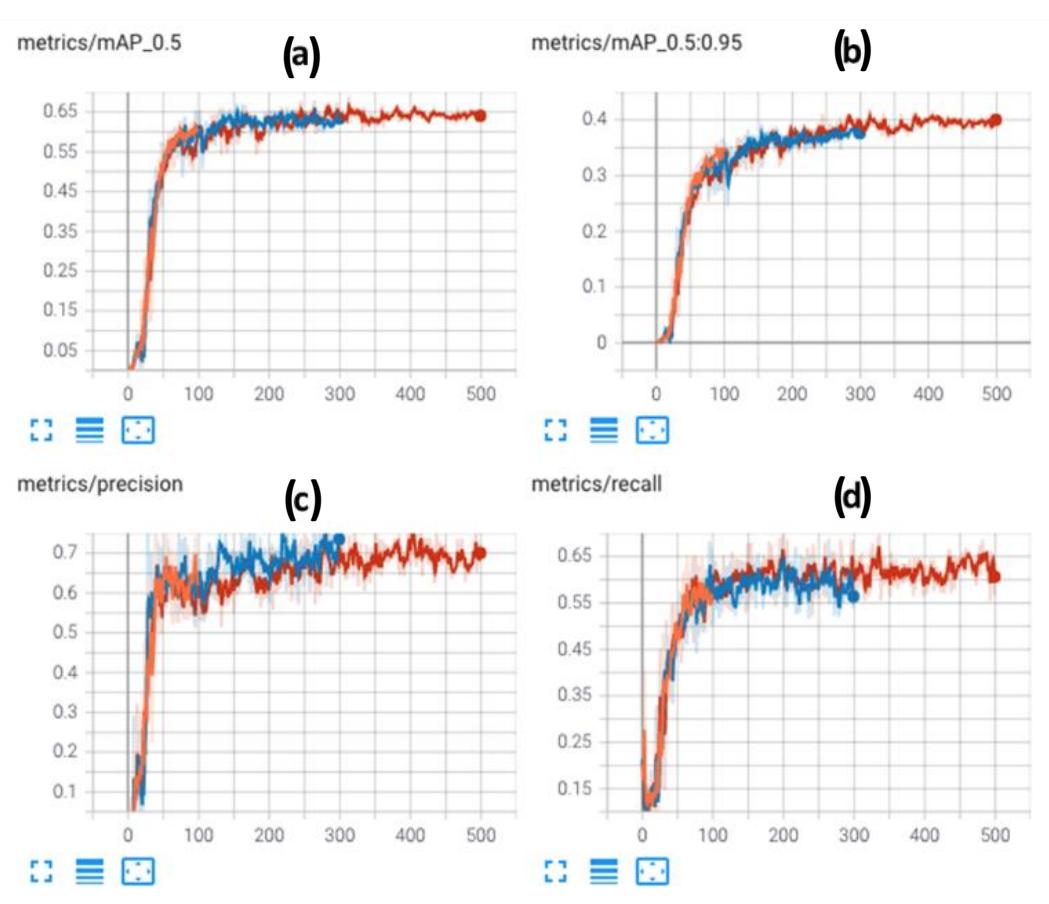
Result of accuracy matrices: mAP_.5 (a), mAP_.5:.95 (b), precision (c) and recall (d) for the 3 epoch variants of batch 16: 100 (orange graphs), 300 (blue graphs) and 500 (red graphs) epochs.
After this, the losses (bounding box, classification, and object) for all epochs (Figure 4) decreased to zero. The smaller the loss value, the closer the prediction to the truth. In this research, there were no suboptimal solutions produced by some local optima, because of the gradient descent method for reaching the global minimum by choosing the highest gradient from the iterative optimal parameter [31].
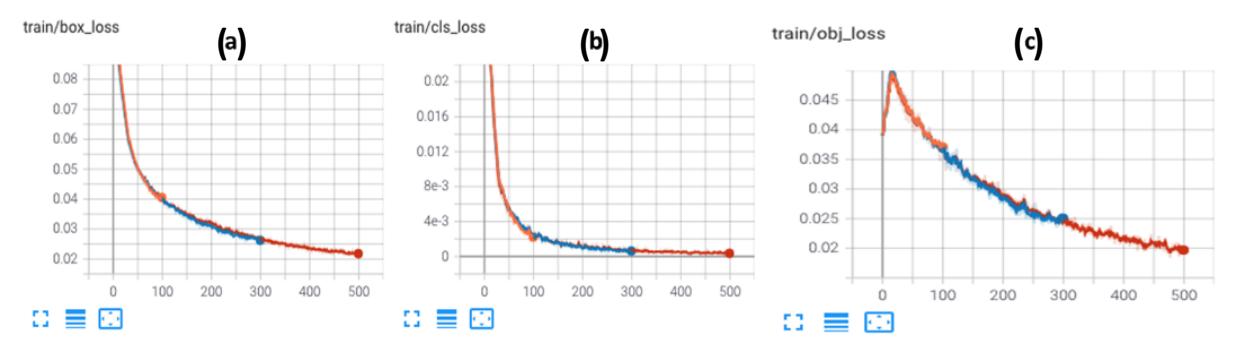
Result of loss for batch 16 with 3 epoch variants, 100 (orange graphs), 300 (blue graphs), and 500 (red graphs) epochs for bounding box loss (a), classification loss (b), and object loss (c) of the dataset.
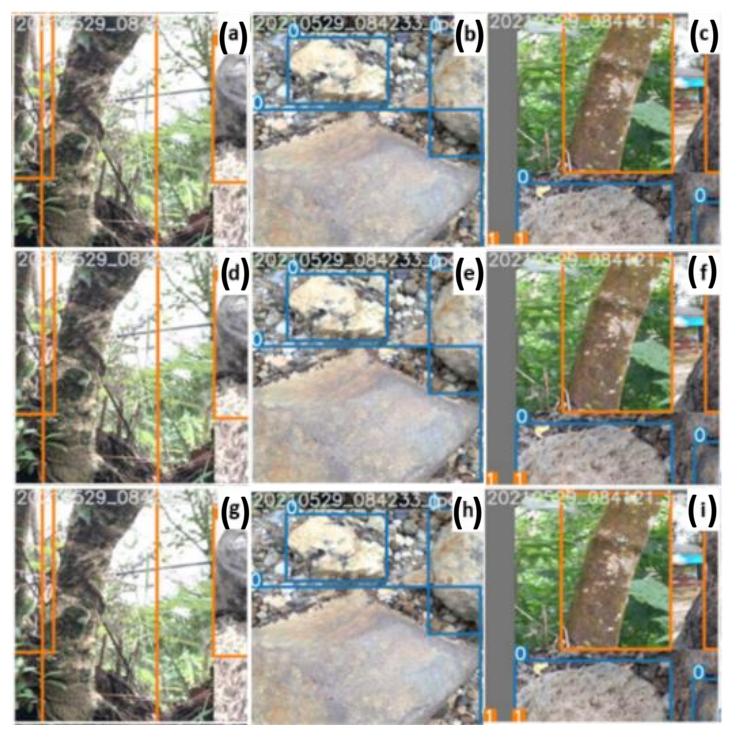
Ground truth (the real object boundary) was performed for the dataset (stones and trees) captured from a real volcano (Tangkuban Parahu). These objects could be successfully detected in this training: group of stones (Figures 5a (100 epochs), 5d (300 epochs), 5g (500 epochs)), stones and trees as two objects in one image (Figure 5b (100 epochs), 5e (100 epochs), 5h (500 epochs)), and trees (5c (100 epochs), 5f (100 epochs), 5i (500 epochs)).
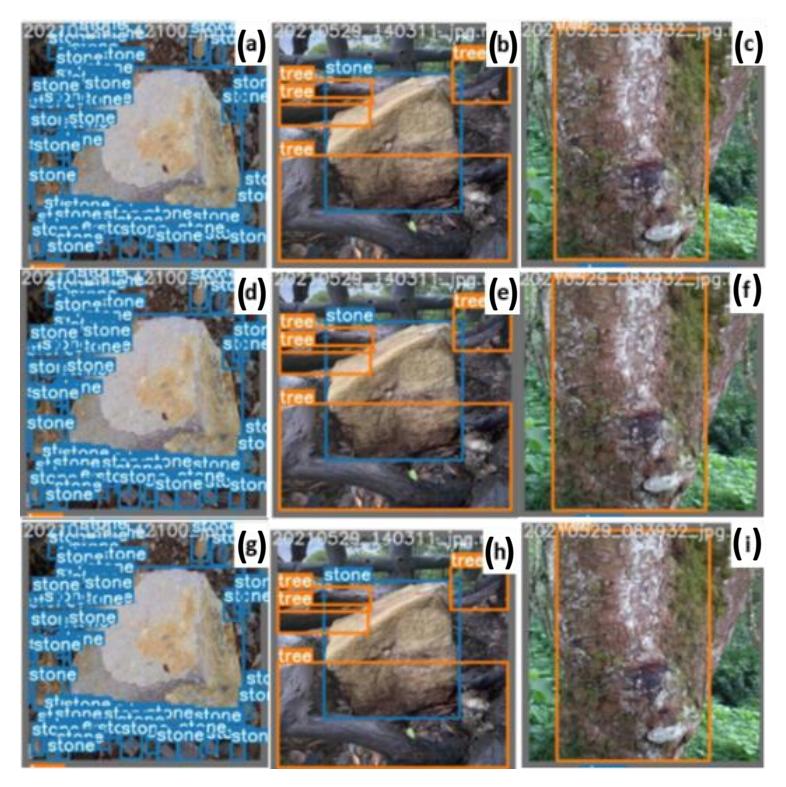
Samples of the result for 3 epoch variants: a group of stones (100 epochs (a), 300 epochs (d), 500 epochs (g)), stones and trees (300 epochs (b), 100 epochs (e), 500 epochs (h)), and trees (100 epochs (c), 300 epochs (f), 500 epochs (i)) successfully detected by the ground truth of the dataset.
Augmented datasets were trained for blurred and rotated datasets. In this condition, the objects could be successfully detected (for all epochs), indicated by the box bounding the objects labeled with 0 for trees and 1 for stones (Figure 6).
Samples of successful training for augmented (blurred and rotated) dataset of: trees (100 epochs (a), 300 epochs (d), 500 epochs (g)), stones (100 epochs (b), 300 epochs (e), 500 epochs (h)), and stones and trees (100 epochs (c), 300 epochs (f), 500 epochs (i)).
On the other hand, the display interface had a different result for the three different numbers of epochs. Both trees and a group of trees were successfully detected by the model with all epoch variants (Figure 7 a, b, e, f, i, j). However, the only model with 300 epochs could detect the group of stones (Figure 7 g), while one stone failed to be detected by the model with 500 epochs (Figure 7 k), and more stones with 100 epochs (Figure 7 c). Moreover, the three different models could detect the stones (Figure 7 d, h, l). However, the stone was bounded precisely only with 500 epochs (Figure 7 l).
Display interface of tested images for objects: trees (100 epochs (a), 300 epochs (e), 500 epochs (f)), group of trees (100 epochs (b), 300 epochs (f), 500 epochs (j)), group of stones (100 epochs (c), 300 epochs (g), 500 epochs (k)), and stones (100 epochs (d), 300 epoch (h), 500 epochs (l)).
Field Testing
The best model (batch = 16, epochs = 500) of the three epoch variants was implemented in Raspberry Pi and tested in a real volcano environment. The model successfully detected trees and stones on Tangkuban Parahu Volcano (Figure 8). The result of 13 minutes and 17-second live-streaming videos is presented in Table 2. The model could find 90.9% relevant cases from the real data with 79.9% prediction of the objects and about 80% weight. Moreover, the model had a 6 to 10% error probability to detect objects with a true positive rate of 93.3% and 88.5% for trees and stones, respectively.

Detection result of Raspberry Pi implementation at Ratu Crater of Tangkuban Parahu Volcano for trees and stones (a), trees (b), and stones (c).
Table 2 Matrices comparison of recall and precision for training and field testing.
| Matrices | Training | Field Testing |
|---|---|---|
| Recall | 0.567 | 0.909 |
| Precision | 0.724 | 0.799 |
These results were higher (Table 3) than the training's result for recall and precision (Figure 3). This was expected because of the live-streaming delay in Raspberry Pi. Therefore, the processor had more time to detect the object.
Furthermore, the relative position of the object in relation to the camera in the training dataset (about 1 meter distance) was different for in-field testing, which affected the confusion matrices calculation (Table 4).
| Matrices | Real Object | Real Non-Object | |
|---|---|---|---|
| Prediction of Trees | 97 | 15 | |
| Prediction of Non-Trees | 7 | 221 | |
| Prediction of Stones | 77 | 28 | |
| Prediction of Non-Stones | 10 | 244 | |
Table 3 Matrices of TP, TN, FP, and FN for trees and stones in in-field testing.
The detection error for this test was low, as shown by the number of FP (15 for trees and 28 for stones) and FN (7 for trees and 10 for stones), although more objects failed to be detected (TN = 221 for trees and 224 for stones). Therefore, the recall and precision were higher than the training for the same model. This result shows that the system could successfully be applied for object detection in a mobile robot for volcano monitoring applications in Tangkuban Parahu, where no other robots or systems have been reported to have been tested.
Conclusion
Automatic detection of trees and stones using YOLOv5s at Tangkuban Parahu Volcano was performed successfully. It started with training for batch = 16 with three epoch variants (100, 300 and 500 epochs). The last variant resulted in the best mAP_0.5 and mAP_0.5:0.95 (63.4% and 40.4% respectively) and almost zero loss. This model was tested at Ratu Crater of Tangkuban Parahu Volcano on a Raspberry Pi processor and showed higher recall and precision (90.9% and 79.9%) than during the training due to its live-streaming delay in the Raspberry Pi. Therefore, the processor had more time to detect the objects. However, the object of the training dataset should be detailed for surface, structure, colors, etc. for a more accurate model as well as the amount of data. Moreover, the live-streaming delay should also be solved by a data read accelerator such as Tensorflow lite or USB accelerator suitable for Raspberry Pi for real-time object detection applications.
Acknowledgment
We would like to thank Ristek-Dikti for the PTUPT research fund of this research and PVMBG for the permission to conduct our research on Tangkuban Parahu Volcano.
Compliance with ethics guidelines
The authors declare that they have no conflict of interest or financial conflicts to disclose.
This article does not contain any studies with human or animal subjects performed by any of the authors.