
Introduction
Carbon dioxide emissions have increased since the mid-18th century, as reported in Our World of Data. Carbon dioxide gases are generated mainly from fossil fuels and land usage activities [1]. Besides that, the rapid development of new technologies also contributes to carbon dioxide emissions [2]. The increased emissions of carbon dioxide and other greenhouse gases leads to climate change, affecting phenomena such as aquatic biodiversity and natural aquatic resources [3] as the average global temperature increases [4], called the global warming effect [5]. Other than that, phenomena related to human activities such as rainforest cutting, wildfires, and fumes directly influence carbon dioxide emissions. Potentially, global warming will have a multi-dimensional impact in various domains, such as energy consumption[6], mortality [7], ecology [8], aviation [9], etc. Besides that, the environmental impact may also limit economic growth across countries [10].
Our current modern lifestyle and the fast-paced economic development among many countries seem to accelerate this phenomenon and the carbon dioxide levels in the earth's atmosphere now outweigh human physical needs. Climate change has many consequences for human and animal health worldwide [11]. Carbon dioxide cannot only cause asphyxiation but can also act as a toxicant [12]. Following the guidelines stipulated by the American Society of Heating, Refrigerating, and Air-Conditioning Engineers (ASHRAE), it is recommended that the concentration level of carbon dioxide (CO2) should be maintained within a range of 350 to 800 parts per million (ppm) for outdoor environments and 1,000 ppm for indoor settings. Failure to adhere to these prescribed limits may result in adverse physiological effects such as the onset of headaches, the manifestation of sore throat symptoms, and nasal irritation among individuals occupying these spaces [13].
A mitigation plan must be implemented to avoid yearly carbon dioxide emission increase. Introducing a carbon tax and implementing carbon filters, in conjunction with adopting carbon capture and storage technologies, are recommended as efficacious measures for mitigating elevated carbon dioxide levels and addressing the constraints inherent in prevailing methodologies [15]. Other than that, monitoring carbon dioxide gas emitted from any activity is needed to avoid carbon dioxide levels that can contribute to excessive greenhouse gas formation. Therefore, a device capable of sensing carbon dioxide gas that provides immediate output is necessary, such as a gas sensor. Most carbon dioxide gas sensors are built based on chemical-based gas sensors because they can provide a fast response with high sensitivity. Many studies used chemical-based gas sensors to detect carbon dioxide gases, based on sensing materials such as SnO2 [15, 16], ZnO [17], MoO3 [18], CuO [19], and La2O3 [20]. Most of these sensors are based on metal-oxide semiconductors because of their sensitivity, selectivity, recovery time, and steady response over time [21].
TiO2 has been known to be an excellent material and is widely used in solar cells [22-24] and gas sensing applications [25-27]. In gas sensing, TiO2 has the capability to detect various gases such as hydrogen [26], carbon monoxide [27], methane [25], etc. While the existing body of literature indicates that TiO2 can effectively detect a range of gaseous species, a pressing need exists to advance the development of real-time applications to monitor carbon dioxide gas levels using TiO2. Thus, TiO2 was chosen as the sensing material in this study to sense carbon dioxide at room operating temperature. TiO2 is an n-type semiconductor with excellent advantages such as nontoxicity and chemical stability. In addition to that, TiO2 is also considered an affordable material, thus making it a practical material for gas sensors [28]. The TiO2 gas sensor was integrated with IoT ThingSpeak for real-time monitoring, while the recorded data can also be observed via a smartphone or computer. The ThingSpeak application acted as an IoT cloud platform to analyze and visualize the data. The developed ThingSpeak application was also used to display the voltage changes over time in the form of a graph while the fabricated gas sensor was exposed to carbon dioxide. Furthermore, it is worth noting that the potential of TiO2 as a carbon dioxide gas sensor remains largely unexplored to date.
This paper presents a low-cost, efficient, light, and portable carbon dioxide gas sensor that can be used to monitor various carbon dioxide concentrations at room temperature; therefore, many people can use it, including industrial and home users. The Internet of Things (IoT) concept was employed to enable the proposed system to be wireless and capable of network connection. The IoT platform provides a user interface that displays the increment or decrement of surrounding carbon dioxide levels at room temperature. The system also assists people in keeping track of the various carbon dioxide concentration levels and adopting an alert message to warn people. The results of the experiment revealed that the fabricated gas sensor was highly responsive to carbon dioxide gas within less than 20 seconds.
Methodology
Fabrication of TiO2 Thick Film Gas Sensor via Screen-printing Technology
Kapton film was used as the substrate of the gas sensor. It was cut to a size of 2 cm x 2 cm. First, a binder was prepared by mixing 5 wt% of ethyl cellulose with 95 wt% of terpineol using a magnetic stirrer for 24 hours at 40 ℃. The binder was then combined with the TiO2 powder to create a 2.6-gram paste, where the ratio of binder to TiO2 was 1:1. The mixture was stirred for 3 hours by a magnetic stirrer until a homogeneous and thick paste was achieved. Firstly, an interdigitated electrode was deposited onto the substrate using a screen-printing technique and annealed at 150 ℃ for 15 minutes in an oven. Next, the TiO2 paste was deposited onto the electrode to form a sensing layer using screenprinting and annealed at 200 ℃ for an hour in an oven. After that, a fine copper wire was attached to the leg of the interdigitated electrode to create an electrical connection. Lastly, the gas sensor was placed in an oven at 150 ℃ for 15 minutes to dry the silver paste on the copper wires. The flow of the gas sensor fabrication process is shown in Figure 1. The method of gas sensor fabrication in this study was adapted from the work in Ref. [29].
The gas sensor consisted of two layers, a sensing layer and an interdigitated electrode. The first layer was an interdigitated electrode (silver paste), while the second layer was a sensing layer (TiO2 paste). Three similar TiO2 gas sensors were fabricated and labelled G1, G2, and G3. The fabricated TiO2 gas sensors are displayed in Figure 2. The three similar TiO2 gas sensors were fabricated to investigate their repeatability towards carbon dioxide gas.
The flow of the TiO2 thick film gas sensor fabrication process.
The fabricated TiO2 gas sensors: (a) G1, (b) G2, and (c) G3.
Integration of TiO2 Gas Sensor with IoT ThingSpeak Application
Figure 3 shows the circuit used in the experiment, which consisted of an Arduino Uno R3 microcontroller board, which mainly functioned to control and manage the electronic components in the system by reading and processing the analog input signal from the fabricated gas sensor. The wires connected to the fabricated gas sensor's interdigitated electrode legs were connected to the A0 pin on the board and a 5V power supply. The system of electronic components consisted of a green LED, a red LED, a buzzer, and a 16 x 2 LCD display, which were both used to indicate the response of the output signal of the gas sensor being displayed. If the concentration level of carbon dioxide exceeded the threshold limit of 700 ppm in the ArduinoIDE code, the red LED would light up, and a buzzer would sound. Otherwise, the green LED would light up. The 16 x 2 LCD indicated the gas concentration level in ppm and sensor voltage.
Integration of TiO2 gas sensor with IoT ThingSpeak application.
Experimental Setup of Gas Sensor Measurement to Carbon Dioxide
Figure 4 shows the experimental setup for gas sensor measurement of carbon dioxide gas. The carbon dioxide gas was produced by burning a white A4 size sheet of paper. First, the voltage of the gas sensor was observed for 5 minutes for stabilization. Next, a piece of 70 gsm A4 size sheet of paper was burnt in glassware to create carbon dioxide gas, with the gas flowing towards the surface of the fabricated gas sensor. The paper took approximately 20 to 30 minutes to fully burn up, indicating that the gas sensor was exposed to the carbon dioxide for one cycle time. The voltage changes of the gas sensor in response to the carbon dioxide could be observed on a 16 cm x 2 cm LCD. The carbon dioxide levels were represented by voltage values, where a larger voltage value indicated a higher carbon dioxide concentration level and vice versa. All the data obtained from the serial monitor of the ArduinoIDE software were plotted using the Origin 2019b software.
Experimental setup of gas sensor measurement of carbon dioxide gas.
Results and Discussion
Current-Voltage (I-V) Measurement
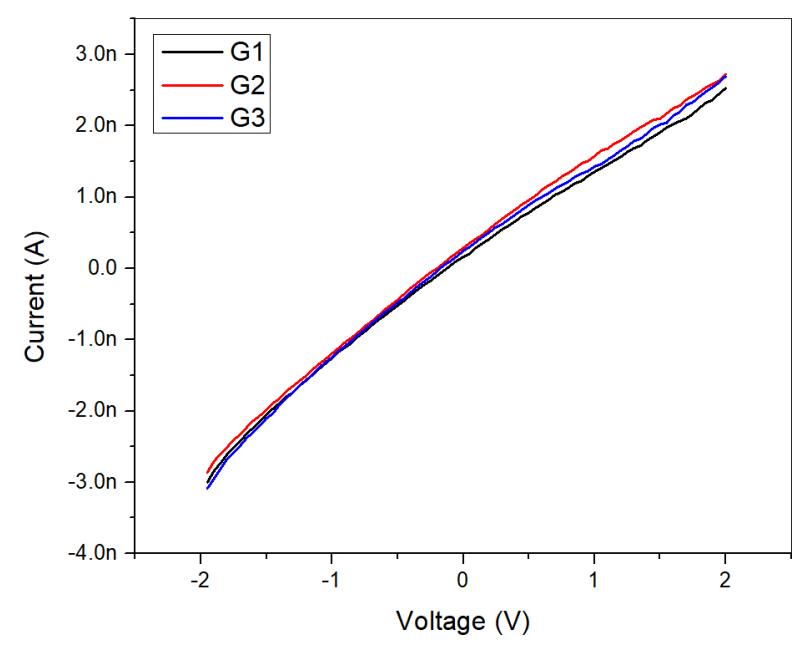
Figure 5 shows the I-V characteristics ranging from -2 V to 2 V for all three TiO2 fabricated gas sensors. The experimental result showed that as the voltage applied to the fabricated gas sensor was increased, the current flowing through the sensor also increased, indicating that the current flowing through the sensor was directly proportional to the voltage applied across it, following Ohm's law. The resistance of the gas sensor was calculated by using Eq. (1):
\[Resistance = \frac{1}{Slope \ of \ IV \ graph} \tag{1}\]
The stiffer the slope of the I-V line, the smaller the resistance value of the sample obtained. From the results, the resistance for the G1, G2, and G3 gas sensors was approximately 0.75 GΩ, 0.73 GΩ, and 0.72 GΩ. The lowest resistance was produced by G3, at 0.72 GΩ, while the highest resistance was produced by G1, at 0.75 GΩ. Since the TiO2 area on the three fabricated gas sensors was precisely the same, it was concluded that there was no significant difference in their performances, and the sensors were stable for gas detection towards the target gas. However, the resistance of the gas sensor may also be attributed to the amount of silver paste placed on the copper wires to the legs of the electrodes.
I-V characteristics for TiO2gas sensors.
Characterization of Sensing Layer using SEM, XRD, and Raman
Figure 6 displays the cross-section and the morphology of the sensing layer of the TiO2 gas sensor using SEM (model: Hitachi SU 5000). As can be seen in Figure 6(a), it was confirmed that the sensing materials on the gas sensor's surface were TiO2 nanoparticles, which can be observed from the spherical shape. Figure 6(a) shows a histogram that represents the particle's diameter distribution. The diameter of the particles was measured using the JImage software, after which the data were transferred to the Origin software. Then, a histogram was plotted using the Origin software. The highest particle size distribution of TiO2 particles was contributed by the 0.4 diameter value. In Figure 6(b), the thickness of the TiO2 sensing layer is nearly 8 , which means this thickness follows the stencil acceptable range of 10 ± 2.
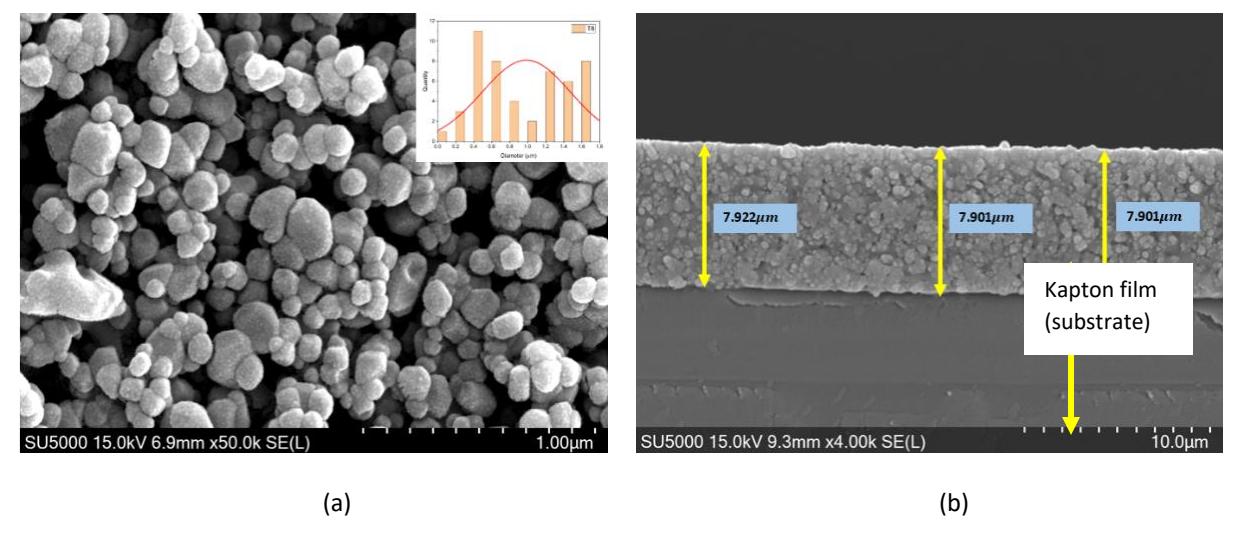
Sensing layer of the TiO2 gas sensor using SEM: (a) cross section, (b) morphology.
The element composition was verified using XRD (model: Panalytical) over a 2θ range between 20° and 80°. Raman spectroscopy (model: DU420_OE) was carried out using a laser excitation line at 550 nm for thick film. Figure 7 shows the XRD and the Raman spectra of the TiO2 gas sensor. In Figure 7, the diffraction peak pattern for the XRD and the Raman spectra correspond to anatase (A) and rutile (R) structures. The peaks indicated in the XRD and Raman spectra were similar to those reported in [30], which confirms that the surface of the gas sensor was still TiO2 after the annealing process.
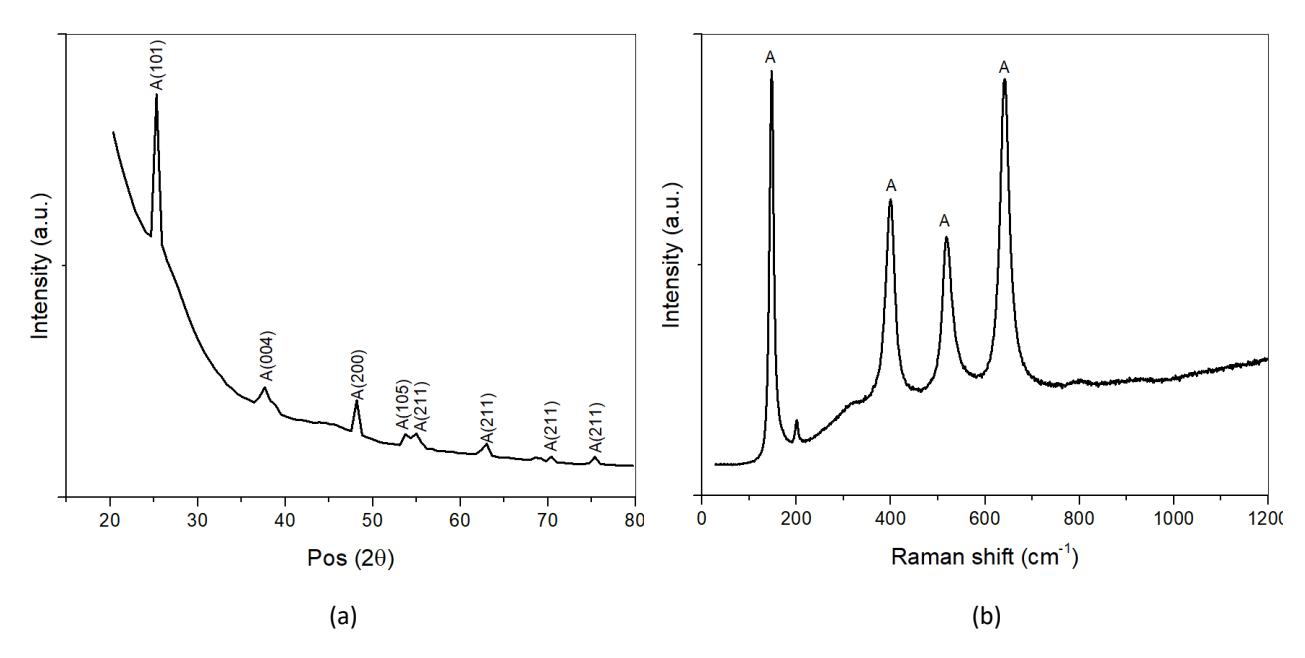
Sensing layer of TiO2 gas sensors: (a) XRD, (b) Raman.
Voltage Measurement
Figure 8 shows both the response and repeatability properties and the sensitivity of the three gas sensors when exposed to carbon dioxide. It was observed that G1, G2, and G3 all three responded to the carbon dioxide gas. The responses indicated that the voltage increased when exposed to the carbon dioxide and decreased when exposed to the surrounding air. This phenomenon revealed that TiO2 gas sensors are n-type gas sensors, whose resistance increases when exposed to the target gas and decreases when exposed to air. There are two types of gases, i.e., reducing gases and oxidizing gases. For n-type gas sensors, the resistance decreases when exposed to a reducing gas, whereas the resistance increases when exposed to an oxidizing gas. Carbon dioxide gas is categorized as an oxidizing gas, so the voltage will increase when exposed to the gas, and the voltage will decrease when exposed to air. The generated pattern of this gas sensor towards carbon dioxide was similar as that reported in Ref. [31].
Table 1 lists the response, sensitivity, response time, and recovery time of the gas sensors. The sensitivity of the gas sensors was determined through the slope of the sensitivity graph presented in Eq. (1). The sensitivity graphs for all gas sensors were almost the same, with the operating temperature in every experiment set at room temperature. The sensitivity values were calculated approximately by finding the slope value in the sensitivity graph. The response time was obtained by finding the difference between 90% of the after-exposed gas at saturated voltage and 10% of the most stable initial voltage. In contrast, the recovery time was determined by finding the difference in time between the 90% after-exposed gas voltage reading and 10% of the most stable final baseline voltage. The results showed that the fabricated gas sensors produced sensitivity values in a range of 0.243 to 0.245. G1 in Test 1 had the highest response and the highest sensitivity with values of approximately 2.120% and 0.245%, respectively. On the other hand, G2 in Test 2 had the shortest response time and recovery time compared to G1 and G3, approximately 108.216 s and 104.208 s, respectively. Next, the repeatability of the gas sensor was evaluated twice (Test 1 and Test 2) to determine the pattern behavior of the gas sensor towards carbon dioxide. Among all three gas sensors, G1 had the smallest repeatability error, at 2.12%, between the first and the second gas exposure.
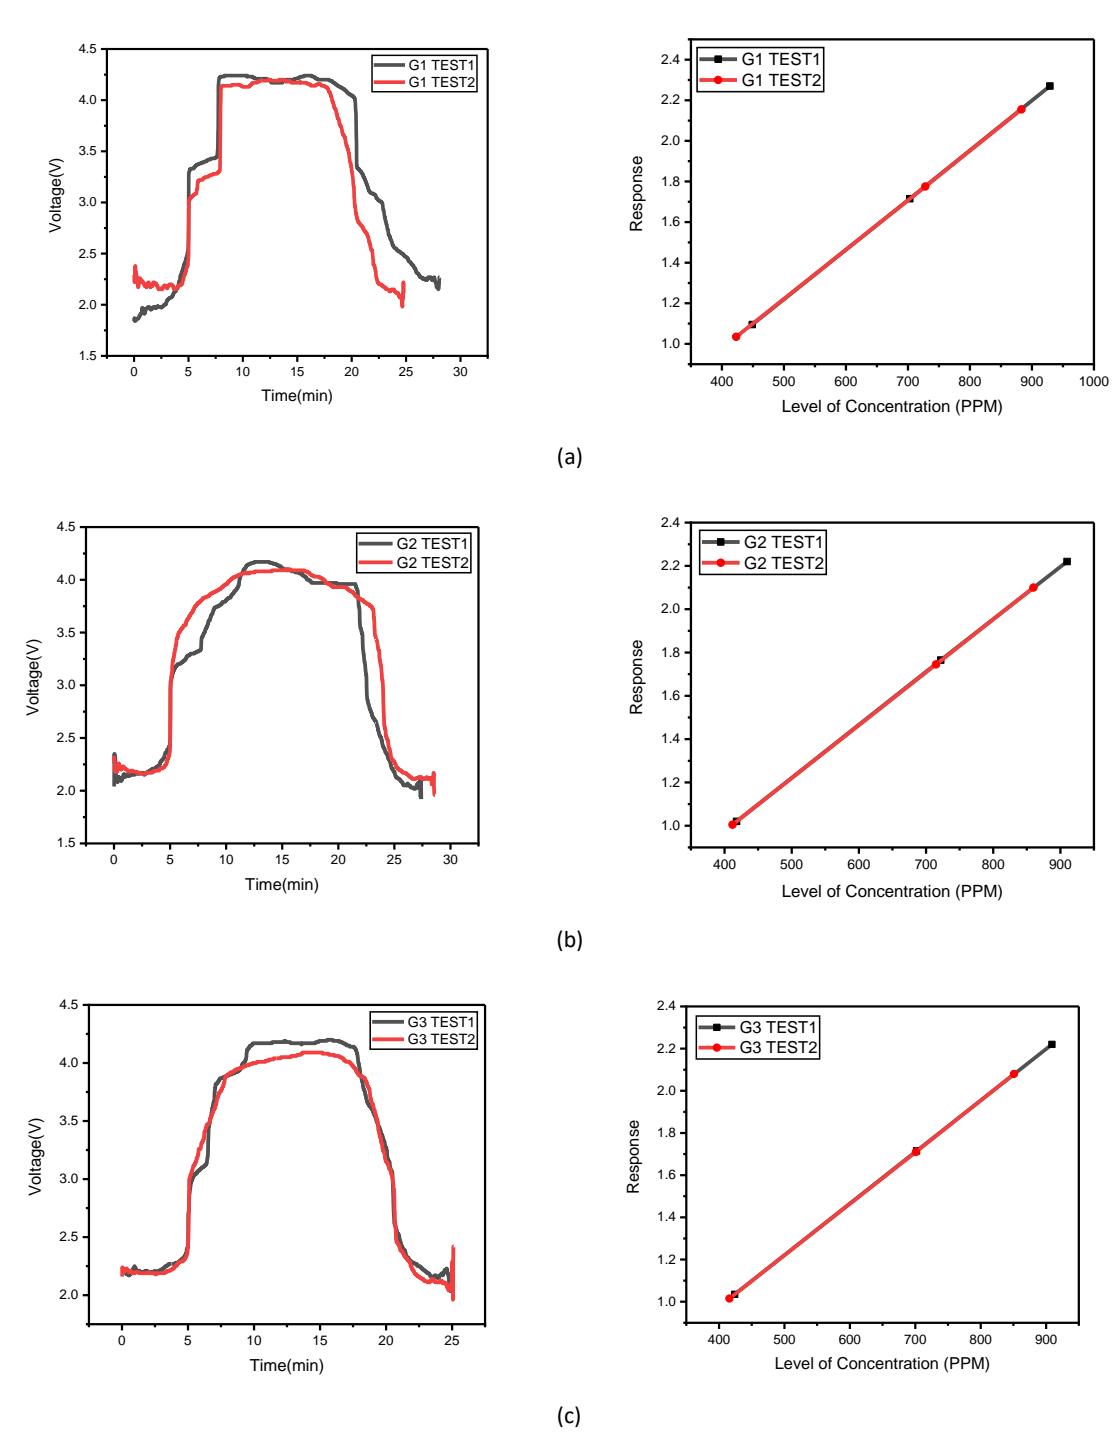
Figure 8 Response, repeatability, and sensitivity of samples (a) G1, (b) G2, and (c) G3.
\(\textbf{Table 1} \quad \text{Response, sensitivity, response time, and recovery time for the $TiO_2$ gas sensors.}\)
| Sample | Test | Response | Sensitivity | Response time (s) | Recovery time (s) |
|---|---|---|---|---|---|
| T6S1 | 1 | 2.120 | 0.245 | 221.442 | 283.566 |
| 2 | 2.075 | 0.243 | 178.356 | 226.452 | |
| T6S2 | 1 | 1.895 | 0.244 | 184.368 | 175.35 |
| 2 | 2.040 | 0.244 | 108.216 | 104.208 | |
| T6S3 | 1 | 2.085 | 0.244 | 121.242 | 206.412 |
| 2 | 2.005 | 0.245 | 122.244 | 170.34 |
IoT ThingSpeak Application
Figure 9 shows the carbon dioxide gas level graphs for TiO2 gas sensors G1, G2, and G3 via ThingSpeak, an IoT platform that can visualize data in real time. The experimental result showed that the sensor voltage level was stable and was located around 2V while the gas sensor was not exposed to carbon dioxide at this level. The voltage started rising after the gas sensor was exposed to a higher concentration of carbon dioxide in a few minutes. The voltage remained at around 4V while the gas sensor could still detect the increased carbon dioxide concentration levels. Eventually, the voltage value decreased to the baseline voltage after the paper was fully burnt up and the carbon dioxide in the area had decreased.
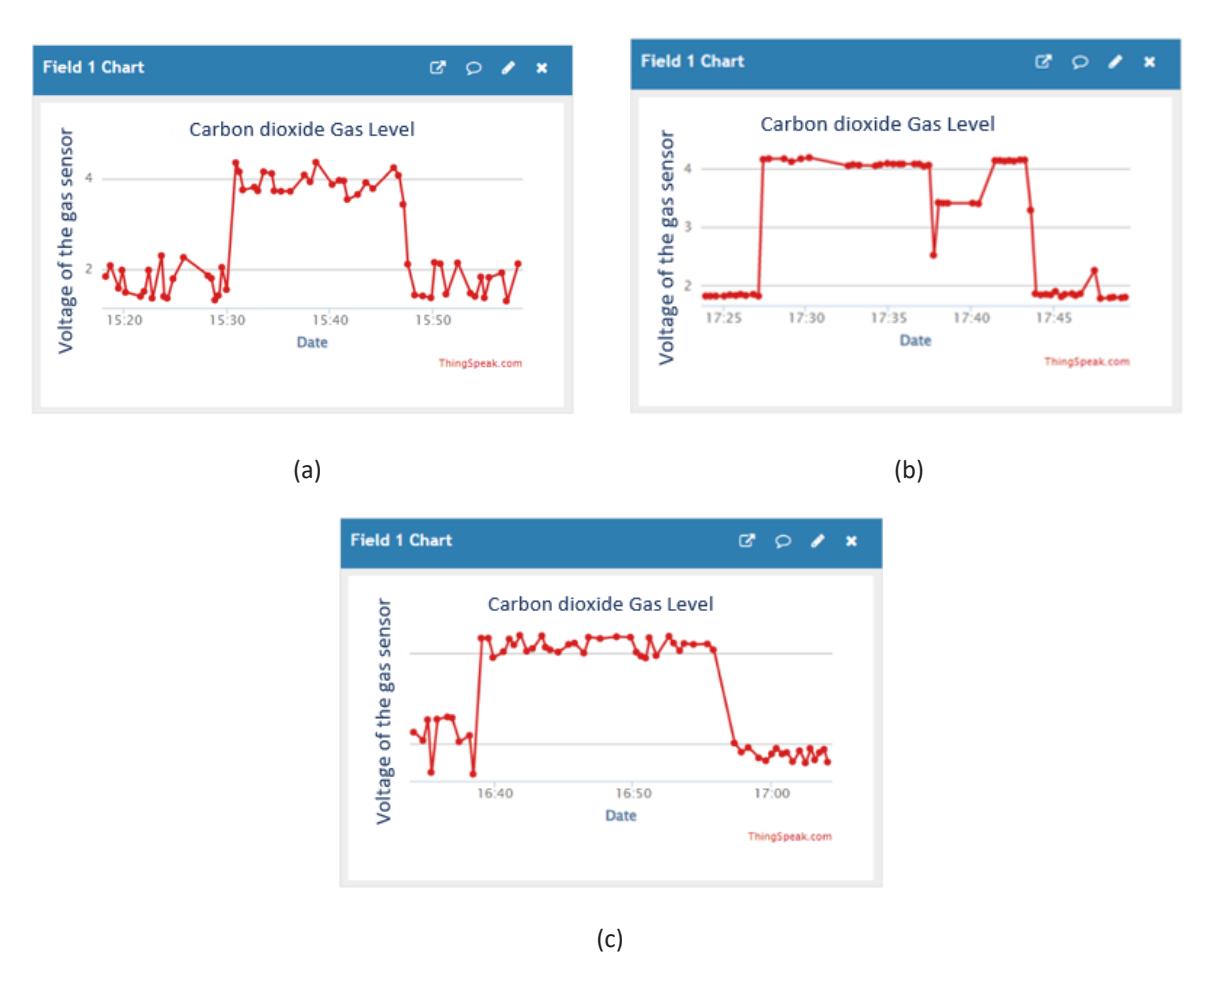
The gas response graph in the ThingSpeak application for (a) G1, (b) G2, and (c) G3.
Conclusion
Three similar TiO2 gas sensors, labelled G1, G2, and G3, were successfully fabricated using screen-printing technology on Kapton film. The sensors were exposed to carbon dioxide gas twice, at room operating temperature. The result revealed that G1 in Test 1 produced the highest response, with a highest sensitivity value of 0.245. On the other hand, G2 in Test 2 had the fastest response time and recovery time towards carbon dioxide, at 108.216 s and 104.208 s, respectively. The result also indicated that the fabricated TiO2 gas sensors had excellent repeatability properties by generating almost the same response and sensitivity values in Test 1 and Test 2. With a quick response and good sensitivity towards carbon dioxide gas at room operating temperature, this gas sensor can be used in various industries and can also be used by home users as a smoke detector.
Acknowledgment
The authors would like to thank the Universiti Teknikal Malaysia Melaka (UTeM) for sponsoring this project under shortterm grant with grant no: PJP/2021/FKEKK/S01821 and Faculty of Electronics and Computer Technology and Engineering, Universiti Teknikal Malaysia Melaka (UTeM) for the financial support of this project.
Compliance with ethics guidelines
The authors declare that they have no conflict of interest or financial conflicts to disclose.
This article does not contain any studies with human or animal subjects performed by any of the authors.