
Introduction
Mass concrete, a cornerstone of our infrastructure, forms the backbone of dams, bridges, and nuclear power plants. Despite its remarkable strength and resilience, it exhibits complex thermo-mechanical behavior due to its substantial size. It is imperative to comprehend and predict the internal conditions of vital structures to guarantee their structural integrity and maximize their operational life. Approximately 20% of mass concrete cracks are due to external loads, while the majority are caused by restrained deformation such as thermal deformation, shrinkage, and inhomogeneous deformation [1]. Determining the possibility of cracking in the early stages enables the implementation of measures to adjust the casting process or the makeup of the concrete mix before initiating construction activities. Finite element analysis (FEA) is a common method used to predict thermal cracks in mass concrete structures due to its feasibility and reliability [2] . The method of concreting, including the initial temperature, water-binder ratio, heat management, curing method, and use of admixtures, significantly influences the rate and extent of cement hydration, affecting the properties and performance of the concrete [3-5].
Many researchers have utilized FEA to evaluate the health condition of mass concrete. For instance, some researchers used thermal analysis to explore the impact of temperature variations due to cement hydration on crack formation in concrete structures to evaluate and optimize the development techniques for mass concrete production such as using additives [6, 7] or a cooling pipes system [8]. Several papers expanded their investigations to include the mechanical analysis of thermal stresses alongside temperature gradients to enhance the reliability of the results [6-11]. In other work [12-14], the researchers used a different approach by studying the effect of the placement temperature on the development of cracks within the concrete elements. All the previous researchers found that FE analysis is a reliable tool to evaluate the thermal cracking risk within concrete elements. It is worth mentioning that the samples considered in their studies were of mass concrete within large-scale constructions, while at the same time the majority of previous researchers did not investigate the construction of multi-layer structures carried out in multiple stages.
In this research, the multi-phase concrete placement of a mass concrete pier head was analyzed using FE software (ABAQUS) to predict weak areas within the concrete body in each phase. Temperature variations influence the hydration process and can result in thermal gradients across the concrete structure. Consequently, differential expansion and contraction may occur, inducing internal stresses that could exceed the concrete's tensile strength and lead to cracking. These sensitive areas within mass concrete members could be exposed to thermal stresses higher than its tensile strength. Thus, after determining these areas, recommendations can be provided to control and monitor the production process to minimize the chance of thermal cracks occurring.
The accuracy of our analysis was contingent upon various factors, including mesh size, material properties, and geometric intricacies. Additionally, certain inputs in ABAQUS are based on estimations and the complexity of calculating thermal loads originating from cement hydration poses challenges for precise determination. Furthermore, the study did not incorporate the cold joint effect, which would have introduced further complications due to its complexity. Instead, the research focused on analyzing the effects of cement hydration on thermal cracking risk within mass concrete pier heads, thus excluding the influence of dead weight-induced longitudinal strain from our model. Future studies could consider incorporating dead weight effects to provide a more comprehensive understanding of the thermomechanical behavior of such structures.
Methods
ABAQUS Input
ABAQUS software requires some important input to conduct the thermomechanical analysis of the concrete, where ABAQUS is based on the consistent units system shown in Table 1.
| Variable | UNIT | Value | Method | Source/Reference | |
|---|---|---|---|---|---|
| Inputs | |||||
| Thermal conductivity \((\lambda)\) | J/sm°C | 2.45 | [15] | ||
| Specific heat \((c)\) | J/kg°C | 967 | |||
| Thermal expansion | 1/°C | 8 e-05 | Estimation | [16] | |
| Body heat flux | J/sm³ | Varied | - | [17] | |
| Concrete damage | Varied | - | [18] | ||
| Plasticity | - | [10] | |||
| Density (ρ) | Kg/m³ | 2446 | ADHI KARYA LLC | ||
| Outputs | |||||
| Temperature | ° C | Varied | Thermal analysis | ABAQUS software | |
| Stress | Pa | Varied | Mechanical analysis | ||
| Tensile strength | Pa | Varied | Estimation | [19] | |
Table 1 Inputs and outputs of the FE analysis.
Thermal Conductivity & Specific Heat
The absence of precise data representing the thermal conductivity (\(\lambda\)) and specific heat capacity (c) of the concrete, led to those parameters being approximated according to the detailed information in the literature, provided by Bofang [15]. According to the weight percentage of each concrete component outlined in the mix design (Table (2)), the estimation of the thermal conductivity (\(\lambda\)) and specific heat capacity (c) was carried out following Eqs. (1) and (2).
Thermal Conductivity \[(\lambda) = \frac{\sum \lambda_i x \rho_i}{\rho}\] (1)
\[\lambda = ((1.28x330) + (2.9x995) + (3.1x791) + (0.6x155) + (0.7x170))/2441\]
= 2.45 \(J/m.s.\)°C
Specific Heat (c) = \[1.05 x \frac{\sum c_i x \rho_i}{\rho}\] (2)
\(c = 1.05 x ((536x330) + (4187 x155) + (708x995) + (745 x791) + (754 x170))/2441\)
\(= 967 J/kg.\)°C
| Material | Volume (m3 ) | Unit Weight (Kg/m3 ) | Thermal Conductivity (J/ms ̊C) | Specific Heat (J/kg ̊C) |
|---|---|---|---|---|
| Cement | 0.105 | 330 | 1.28 | 536 |
| Fine aggregate | 0.3724 | 995 | 2.9 | 708 |
| Coarse aggregate | 0.2926 | 791 | 3.1 | 745 |
| water | 0.155 | 155 | 0.6 | 4187 |
| Fly ash | 0.068 | 170 | 0.6-0.8 [20] | 754 [21] |
| Superplasticizer | 0.003 | 3.5 | - | - |
| Water reducer | 0.002 | 2 | - | - |
Table 2 Concrete mix design and thermal properties of pier head section.
Thermal Expansion
In the study conducted by Endang Tri Wahyuni [22], an examination of the chemical composition of Merapi aggregate (which was used in the pier head mix design) was undertaken with a focus on SiO2, CaO, Fe2O3, and other elements. Notably, the researchers observed that the major content closely aligns with basalt content. Referencing ACI PRC-207 [16], it is highlighted that basalt aggregate exhibits a thermal expansion range of 6 to 8 millionths/℃.
Description of the Pier Head Geometry
Modeling the geometry was done using the provided design layouts from Jasa Marga LLC (the organization implementing the project) as shown in Figure (1); the pier head beam has an upside-down irregular T-shape.
(a) The pier head beam in the field; (b) the geometry and placement phases in the FEM model.
Thermomechanical Sequentially-coupled Analysis
Sequentially coupled thermal stress analysis presents a computationally efficient approach to tackle issues where temperature significantly influences stress and displacement fields, with minimal impact in the reverse direction [23]. The application of sequentially coupled thermal-mechanical analysis proves beneficial for conducting economical thermal assessments of mass concrete structures, striking a balance between computational efficiency and precision. Nonetheless, a fully coupled thermal-mechanical analysis may incur high computational costs, especially in the context of large-scale projects. To overcome this challenge, sequentially coupled thermal-mechanical analysis is available as a cost-effective alternative, ensuring satisfactory accuracy. In mass concrete, the temperature field typically affects the stress field, but the temperature field can be found without knowledge of the stress response. In addition, the heat transfer analysis in mass concrete can often be conducted accurately without requiring continuous updates from the stress field, further supporting the sequential method.
Thermal Analysis
The thermal load is considered as an internal heat flux due to the hydration of the cement. Therefore, the determination of the body heat flux (BHF) can be done by following the study of [17]. In his study, the adiabatic temperature is reformed to a load represented by BHF as shown in Eq. (3).
\[\frac{dT}{dt} = \frac{q}{\rho c} = \frac{dH}{dt} \left( \frac{1}{\rho c} \right) \tag{3}\] where is the BHF and equal to ( )
Eq. (3) can be reformulated as IN Eq. (4):
\[q = \frac{dH}{dt} = \frac{dT}{dt}(\rho c) \tag{4}\]
The determination of q is done by using the steps mentioned in the research of Elias, [17] by using trial cube temperature data provided by Jasa Marga LLC, Figures 2 and 3.
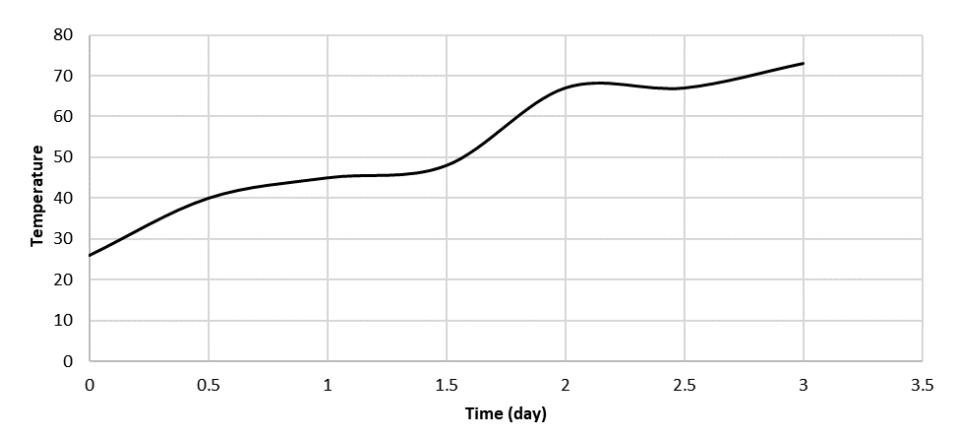
Temperature increase for the trial mix cube (1.5 m x 1.5 m x 1.5 m).
(a) The trial mix cube, (b) the locations of the thermocouples.
Moving on, to determine the BHF, the two successive periods of temperature increase (dT) are calculated within period time (dt), and then the heat of hydration (dH) can be determined using Eq. (4). The final step is to divide the heat of hydration to the time difference (dH/dt) to find the body heat flux. To simulate the real trend of the temperature increase, the Amplitude feature in ABAQUS is used and applied based on the temperature increase values, Figure 4.
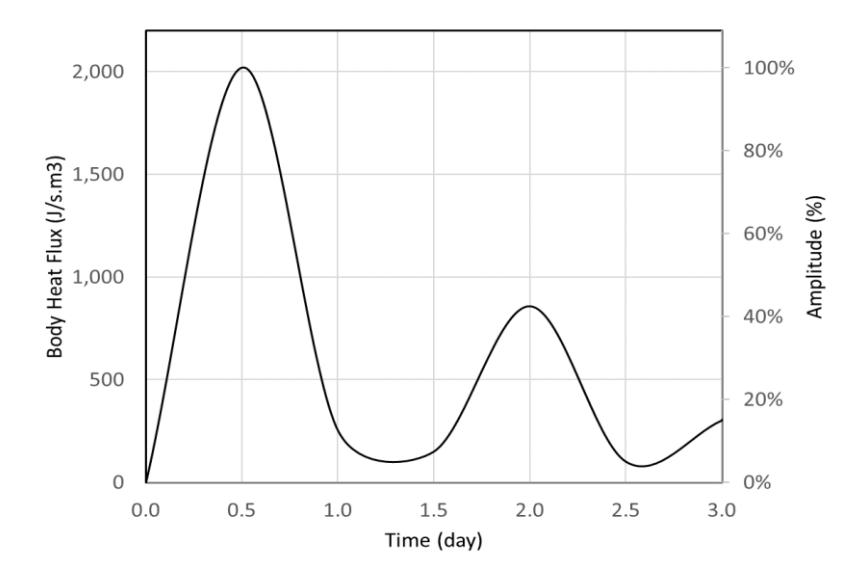
Body heat flux amplitude.
The boundary condition was taken as ambient temperature, which was obtained from the Iowa Environmental Mesonet [24] website and applied as amplitude in ABAQUS (Figure 5). While this data can serve as a valuable reference, it represents a generalized approximation rather than a site-specific measurement designed for the project site. Consequently, it falls short of accounting for the nuanced variations that may be present within the project site. We excluded the solar radiation and the wind speed effect boundary conditions due to lack of such data.
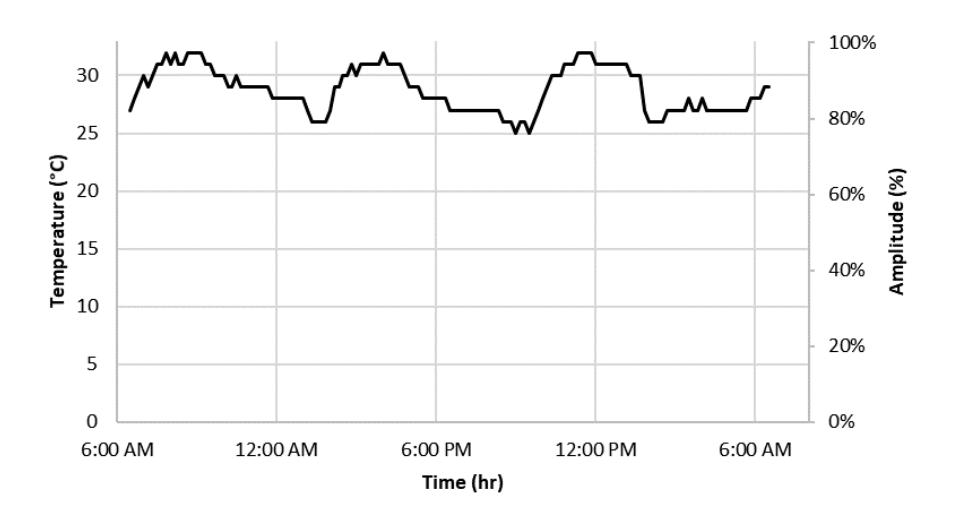
Ambient temperature inputted in ABAQUS.
In the ABAQUS program, it is feasible to segment and arrange the thermal or mechanical load over time using the Step command. Regarding the pier head section, in reality, as mentioned before, it was cast in three phases. Consequently, the thermal analysis was executed in the ABAQUS program by creating three steps for the thermal load, each step representing a phase. Regarding the meshing, DC3D20 was selected for the thermal analysis. The DC3D20 element is a 20-node quadratic (non-linear) brick element used for heat transfer analysis in ABAQUS. It offers several advantages over its linear counterpart, DC3D8, including higher accuracy and improved convergence for complex geometries and gradients. Each node of the DC3D20 element has three degrees of freedom, allowing it to capture more detailed temperature distributions within the model. Moving on, a convergence study was conducted with the aim of monitoring and selecting a proper mesh element size for the thermal analysis. Figures 6 and 7 show that the mesh element size of 0.5 m was the optimal one due to the near-zero difference between (0.25 m) and (0.5 m), unlike the other meshing sizes, for which difference may sometimes reach more than 13 ᵒC.
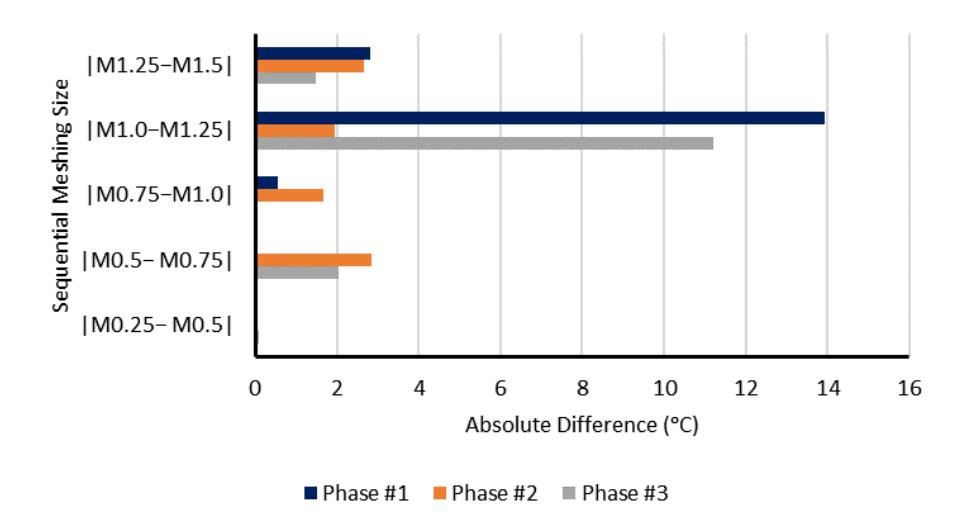
Temperature difference for each phase with variation of mesh element size.
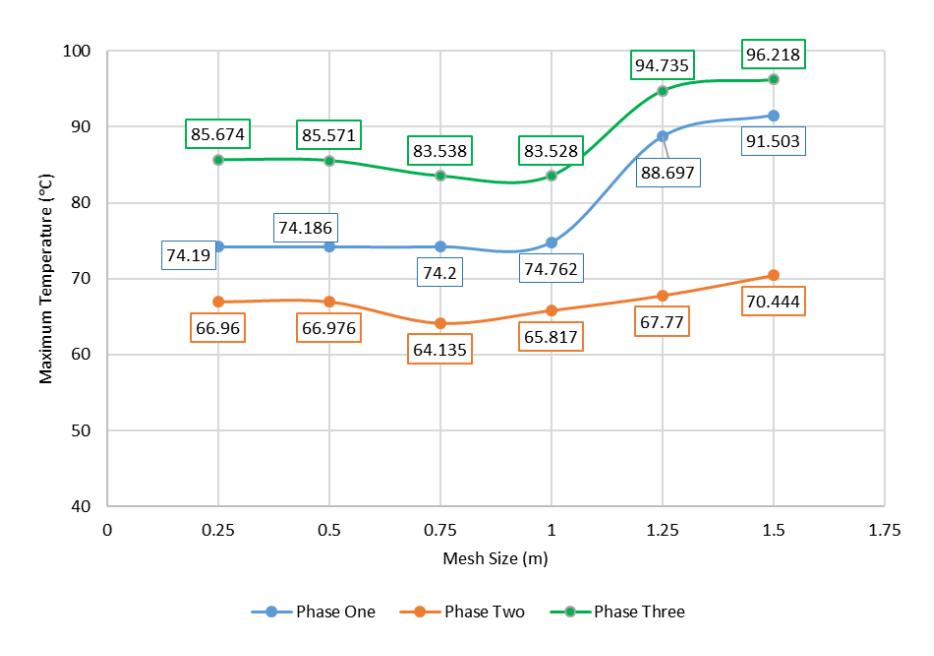
Maximum temperature for each phase with variation of mesh element size.
The initial placement temperature of the concrete mix was estimated based on initial temperature data of the concrete mix provided by Jasa Marga LLC (see Table (3)) and was applied as a predefined field in each phase.
Table 3 Initial temperature of the concrete mixture. ) Temperature of Component (℃)
| Material | Abs. Volume (m3 ) (A) | Temperature of Component (℃) (B) | (A) X (B) | |
|---|---|---|---|---|
| Water | 0.155 | 17.4 | 2.7 | |
| Cement | 0.105 | 33 | 3.5 | |
| Fine aggregate | 0.3724 | 22.7 | 8.5 | |
| Coarse aggregate | 0.2926 | 33.7 | 9.9 | |
| Fly ash | 0.068 | 32.3 | 2.2 | |
| Additives | 0.005 | - | - | |
| Voids | 0.002 | - | - | |
| Estimated placement temperature | ||||
Additionally, to ensure the accuracy of the temperature gradient transfer from one phase to another, the thermal load of the next phase included three applied loads. These loads consisted of the last thermal gradient outcome from the previous phase, designated as 'Predefined field', and the new load resulting from cement hydration, labeled as 'Load'. This load also takes into account the initial placement temperature. For example, in phase two, the load includes the initial temperature of phase two, the last results of the thermal analysis from phase one, and the thermal load in phase two.
Mechanical Analysis
A mechanical analysis was conducted using the thermal gradient results from the thermal analysis. The thermal gradient was applied as a predefined field to simulate the thermal load on the concrete pier head for each phase. Therefore, the mechanical analysis was performed as in the thermal analysis, by creating three steps. The choice of mesh element plays a crucial role in balancing computational efficiency and solution accuracy in the mechanical analysis. This study adopted a mixed approach, leveraging the strengths of both reduced integration and second-order elements to achieve optimal performance [25].
Reduced integration techniques, exemplified by element types C3D20R compared to C3D20, employ a lower-order quadrature rule for the element stiffness while maintaining full integration for the mass matrix and distributed loadings. This strategy delivers significant computational savings, particularly in three-dimensional models. In the case of C3D20R, element assembly boasts a nearly 3.5-fold advantage over its fully integrated counterpart, translating to faster model solution times. However, reduced integration comes at the potential cost of reduced accuracy. Second-order elements come into play in such situations. In ABAQUS/Standard, these elements excel in 'smooth' problems devoid of complex contact conditions, impact, or severe element distortions. Their enhanced ability to capture stress concentrations and model geometric features more effectively makes them well-suited for capturing complex details and ensuring the accuracy of the solution [23].
ABAQUS provides three constitutive models for simulating the non-linear behavior of concrete: concrete smeared cracking, concrete brittle cracking, and concrete damage plasticity. Regarding the first two models, both utilize the smeared crack approach. Concrete smeared cracking is applicable only to static analyses, while concrete brittle cracking is exclusive to dynamic analyses. The third constitutive model, concrete damaged plasticity, combines damage and plasticity theory and is suitable for both static and dynamic analyses [23].
Concrete Damage Plasticity (CDP)
Hjalmarsson & Pettersson [18] explained and reproduced the theory of the concrete damaged plasticity (CDP) model from (ABAQUS Analysis User's Guide) [23]. The CDP model was specifically developed for analyzing concrete subjected to cyclic loading involving alternating compression and tension. The CDP model characterizes the nonlinear behavior of concrete, assuming the primary fracture mechanisms to be tension rupture and compression crushing. Its application is designed for cyclic loading scenarios in reinforced concrete, allowing for stiffness recovery. The stress-strain relationships in the CDP model during uniaxial tension and compression are expressed as in Eqs. (5) and (6):
\[\sigma_t = (1 - d_t) E_0 \left( \varepsilon_t - \varepsilon_t^{pl} \right) \tag{5}\]
\[\sigma_c = (1 - d_c) E_0 \left( \varepsilon_c - \varepsilon_c^{pl} \right) \tag{6}\]
Where, ( , ) represent the tensile and compressive stresses measured in (MPa). The degradation factors associated with these stresses are denoted as ( , ), indicating the impact of tensile and compressive stress on material integrity. Additionally, 0 refers to the initial modulus of elasticity, expressed in (GPa). The equivalent tensile and compressive strains are represented by, ( , ) respectively, highlighting the material's response to applied loads during the deformation process.
Compressive and Tensile Strength
The compressive strength of concrete along the time of hydration can be predicted using Eq. (7a), as provided by Abd Elaty [26], where (fc`) is the compressive strength at age (t) days, (A, B) are constants that are estimated within acceptable coefficients of determination by Eqs. (7b) and (7c):
\[fc = A \ln(t) + B \tag{7a}\]
\[B = 0.005 (f_{c28})^{2.2}\], with \(r^2 = 0.91\), \(f_{c28}\): Compressive strength after 28 days (7b)
\[A = 1.4035 \ln(B) + 2.9956 \text{ with } r^2 = 0.98\] (7c)
Next, tensile strength () can be determined using Eq. (8) [27]:
\[f_t = 0.62\sqrt{fc} \tag{8}\]
In order to study the temperature's influence on the tensile strength along the hydration of cement, Eq. (9) was used [28]:
\[f_{t(T)} = \lambda f_t \tag{9}\] where, = (1.51410 −5 ) 2 − (6.7610 −3 ) + 1.18 , ≤ 400 ℃, 2 = 0.88
Note: The temperature data used in the -equation were the same as the temperature increases in the trial mix cube.
Results
Temperature Gradients
After applying the adiabatic temperature increase load to the pier head, the thermal gradient within the concrete section was obtained, as shown in Figure 8. Two paths were selected: Path-A, which includes test points labeled A-i (located centrally), and Path-B, which includes test points labeled B-i (located closer to the edges) Figure 9. Here, 'i' represents the number assigned to each test point within the respective path. The vertical levels of the test points were selected based on the principle of studying the difference in temperature between each two points and to test the contact area between the different phases (i.e., between the relatively old concrete and the new concrete).
Thermal gradient within the Pier head.
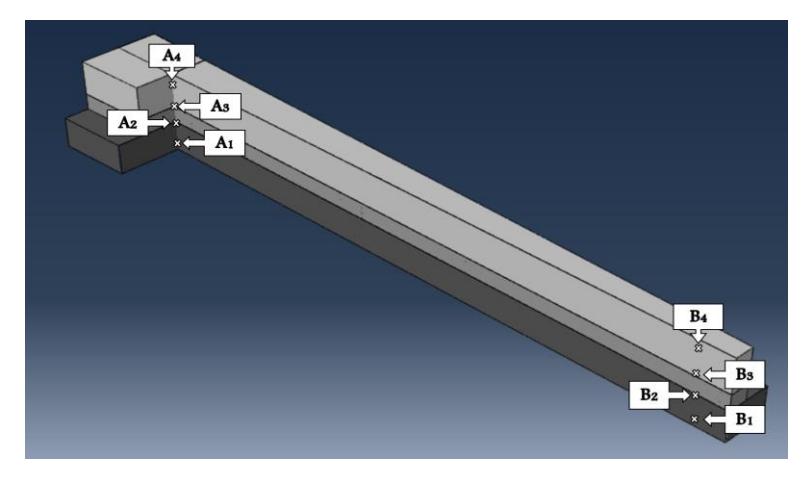
Test point locations within the three phases.
In the first phase of placement, the maximum temperature differentials observed between points (A1, A2) and (B1, B2) were 20.9 ℃ and 17.9 ℃, respectively. Moving into the second phase, the most notable temperature difference emerged between points (A2) and (A3) was recorded at approximately 22 °C during the initial hours of placement. This considerable variation is primarily attributed to the continuity of temperature from phase one for (A2), while (A3) is considered as a new placement. Consequently, the temperature increase commenced from the initial placement temperature of 26.7 ℃. As the placement progressed into the third phase, the differences in temperature between points (A3,A4), (B3, B4) became more pronounced, peaking at 25.4 °C and 26.9 °C, respectively. These findings underscore the dynamic nature of temperature differentials across various phases of concrete placement, reflecting the complex interplay of environmental factors and placement conditions on thermal behavior. Two primary critical thresholds were established to maintain a low risk of thermal cracking: firstly, a maximum temperature difference of 20 ℃, as depicted in Figure (8), and secondly, the recommended maximum temperature limit of 70 ℃, as per the guidelines in ACI 301-16 [29].
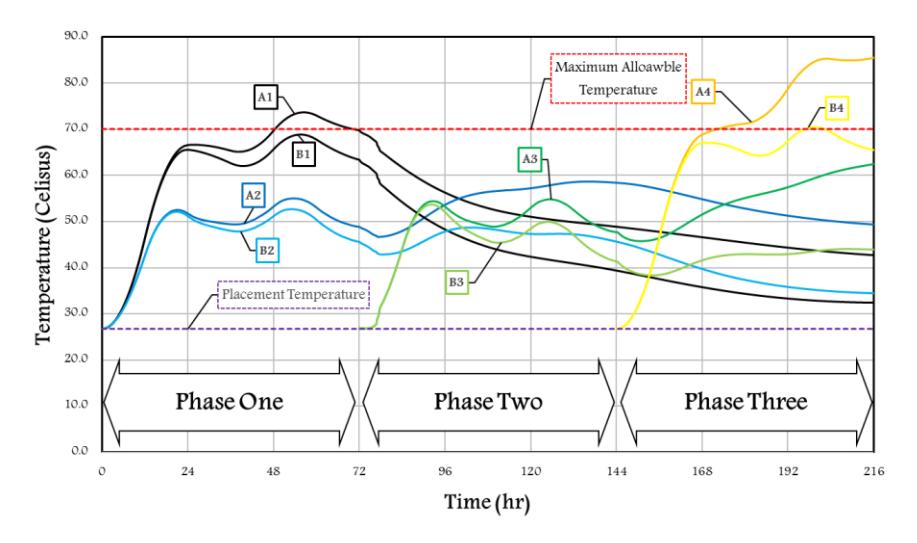
To obtain a more reliable stress field, besides the convergence study of the mesh element size (Figures (5-6)), a comparison was made between the FEM model temperature results and the field results, which were obtained from the thermocouple sensors, as shown in Figures 10 and 11.
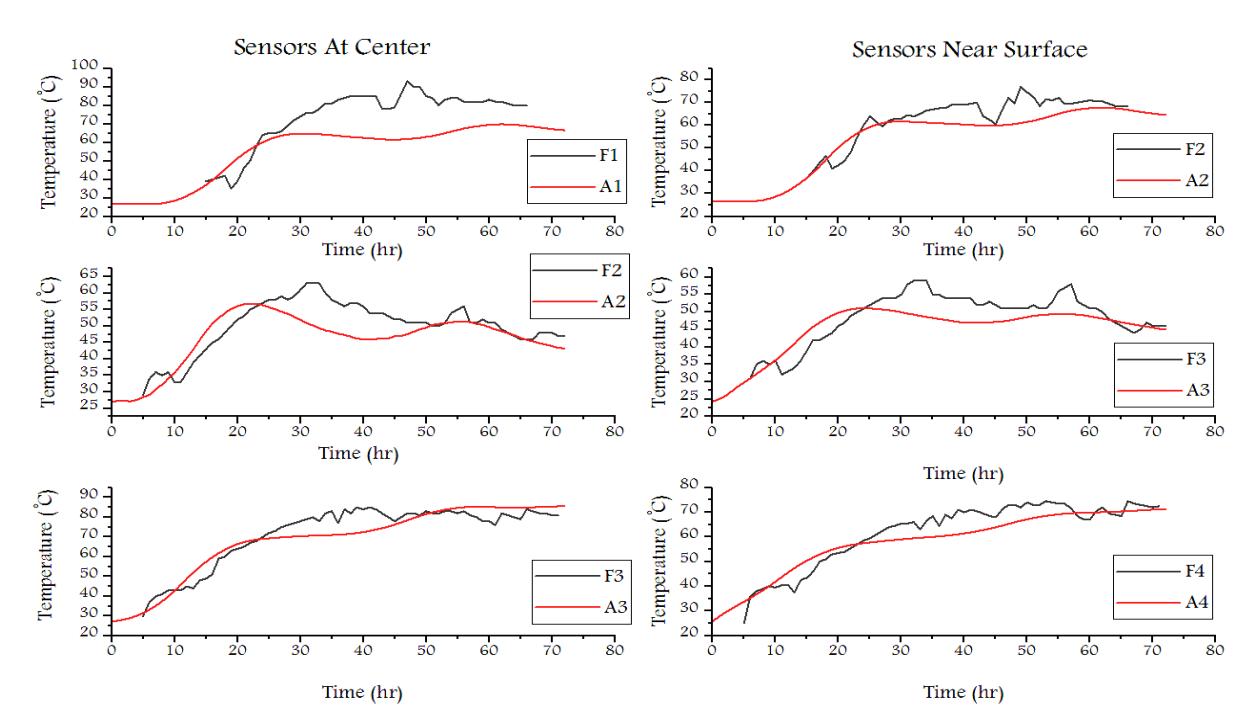
Thermal data from the field and the FEM model for the three phases.
Simulation of the thermocouple locations
Stress Fields
The results of the thermal analysis were utilized for a mechanical analysis as well. Upon completion of the mechanical analysis, similar to the thermal analysis, test points were selected adjacent to those of the thermal analysis but not precisely at the same coordinates. This approach aimed to investigate regions more susceptible to potential cracking, characterized by high tensile stresses. Figure 12 depicts the progression of thermal stresses over a 72-hour period at the designated test points A-i and B-i. The tensile strength of the concrete was estimated and plotted to predict the potential cracking time within the test points. The positive values of the stresses represent the tensile stresses, while the negative values represent the compressive stresses.
In phase one, significant increases in stresses were observed at near-surface test point locations A2 and B2, indicating heightened tensile stresses in these regions. Conversely, the center test points, A1 and B1, exhibited comparatively lower tensile stresses. Moving into the second phase, a gradual reduction in thermal stresses was noted at points A2 and B2 after the placement of the second layer of concrete. After that, the temperature increased again, which led to a reduction in the temperature difference and thus the tensile stresses declined.
In the third phase, similar trends were observed for A3 and B3, with a decrease in thermal stresses over time. However, a distinct scenario happened regarding A4 and B4. The closeness of B4 to the side edge facilitated a rapid loss in temperature and achieved a balance between internal and external temperatures, resulting in lower tensile stresses.
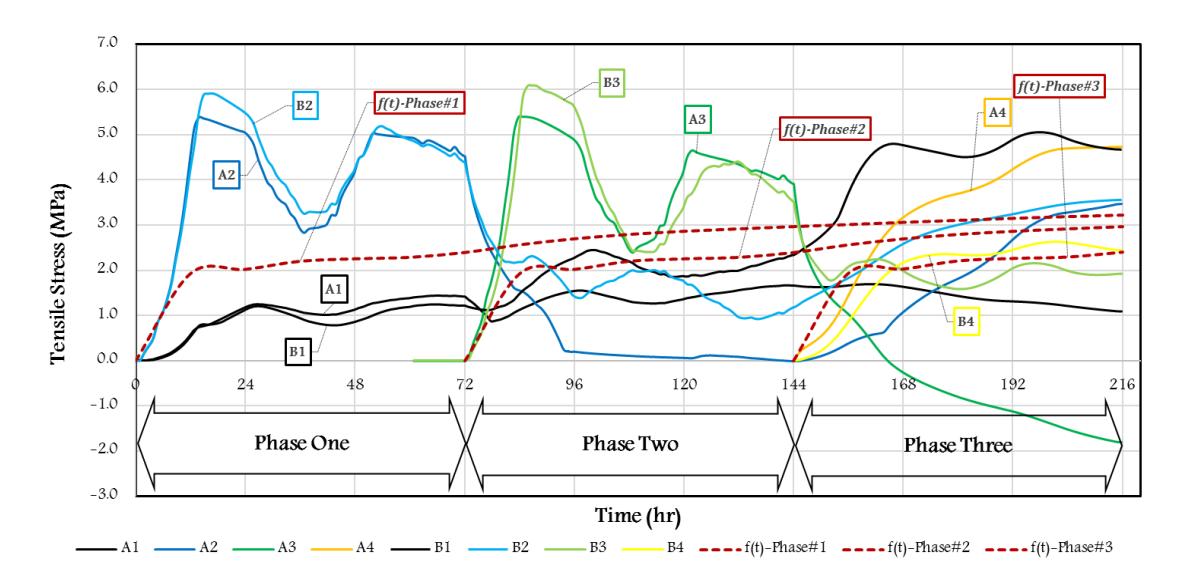
Stress field within the pier head and the test point locations during the three phases.
Discussion
Thermal Gradient
The influence of temperature increase rates on test point locations is a critical consideration in understanding the thermal behavior of concrete elements. Generally, the thickness of the member plays a critical role in the formation of primary cracks [30]. However, the dissipation of temperature is influenced by the distance of the test point to the surface or center of the section. Test points located near the surface typically experience faster temperature dissipation, while those positioned in the center require more time for temperature equilibrium to be reached [12-14]. In phase one, it was evident that at point A1, the temperature exceeded 70 ℃, surpassing the critical limit for delayed ettringite formation (DEF) and indicating potential cracking in that area. Conversely, points A2, B1, and B2, located closer to the surface, exhibited lower temperature rises. In phase two, although the maximum temperature in this phase stayed below the limit, the maximum temperature difference along Path-A exceeded it, indicating a moderately potential risk of thermal cracking. This implies that while the overall temperature remains acceptable, there are localized areas of concern that need attention. Moving to phase three, the maximum temperature exceeded the limit at point A4, and the maximum difference in temperature exceeded it along Path-A and Path B, indicating a highly potential thermal risk.
Moreover, a notable consistency in temperatures was observed at A3 and B3, suggesting a balance between temperature dissipation and hydration heat generation within the second placement layer. In contrast, A4 and B4 exhibited fluctuations, primarily driven by cement hydration and secondary factors such as temperature transfer from the second layer and ambient temperature effects. Notably, phase three represents the final layer with no new placement, emphasizing the dynamic interplay between temperature dissipation and hydration processes in multilayered concrete structures. This highlights the significance of considering placement strategies and test point locations in optimizing temperature management and ensuring structural integrity in concrete construction projects.
Stress Fields
In the development of tensile stresses within concrete, numerous variables contribute, with element thickness and temperature differentials being primary factors. The interaction between these variables is pivotal, where increased temperature differences coupled with greater thickness or distance of the concrete section result in high tensile stresses [31-33]. In phase one of placement, the rapid dissipation of temperature at points A2 and B2, led to a significant increase in tensile stresses, attributed to their nearness to the surface. Conversely, points A1 and B1, experiencing slower temperature dissipation due to low thermal conductivity of concrete and their deeper location within the section, exhibited lower tensile stresses. Moving to phase two, a similar behavior was observed at points A3 and B3. Furthermore, the application of a second layer in phase two resulted in decreased temperature differentials at points A2 and B2, consequently reducing tensile stresses. Phase three presented notable changes, where A3, subjected to a new placement in the third layer, exhibited compressive stresses due to its location. Conversely, B3 did not transition to compressive stresses, likely due to its shorter distance to the side. Both A4 and B4 experienced relatively high tensile stresses, attributed to elevated temperatures, as discussed in the thermal gradient analysis of phase three, and their closeness to the top surface. These findings underscore the intricate relationship between temperature gradients, placement depth, and resulting tensile stresses within multi-layered concrete structures, highlighting the importance of considering these factors in optimizing structural performance and durability.
While some previous researchers [8, 9, 11, 30] discussed and tested samples within a cube size that can be controlled environmentally, most of the literature did not discuss the influence of a multi-layer system in construction on inducing thermal cracks. The results of the present study shed light on critical factors influencing the potential for cracking in large-scale concrete elements subjected to thermal tensile stresses. It was shown that areas near the surface, in the mass concrete element, are particularly susceptible to cracking. To address this issue effectively, the recommendation is to increase the number of layers during concrete placement, aiming to mitigate the risk of thermal cracking. This recommendation wassupported by the construction of two models: one with three layers and the other with four layers of concrete placement for the same pier head beam (Figure 13). It was observed that increasing the number of layers resulted in a significant reduction in maximum temperature by almost 16 °C. Therefore, the implementation of a layered system for concrete placement demonstrated the potential to reduce this risk by allowing more time for reaching temperature balance between consecutive phases.
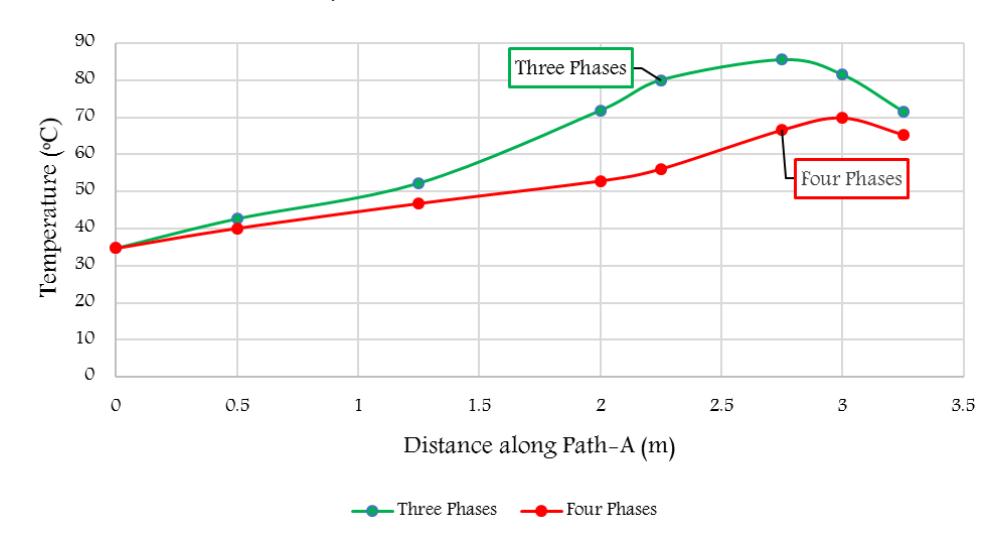
Thermal gradient of three-layered and four-layered pier head beam along (Path-A).
Furthermore, following the identification of the vulnerable regions to thermal risk, implementing specialized treatments and strengthening techniques can greatly improve the structure's resilience. Methods such as the utilization of thermal blankets during the curing process to achieve a more uniform temperature distribution [34] , the installation of cooling systems [8, 35], the incorporation of steel fiber reinforced concrete (SFRC) [36], or the utilization of engineered cementitious composite materials [6, 37] can enhance ductility and crack resistance in these critical zones. These findings underline the importance of understanding the thermal and mechanical behavior of construction elements within multi-layered systems to effectively manage and mitigate the risk of cracking in concrete structures.
Conclusions
To sum up, this research gives valuable insight into the vulnerability of large-scale construction elements to cracking risks associated with thermal tensile stresses. The results offer guidance for identifying critical periods and locations prone to potential cracking within the first three following concrete placements. The thermal analysis revealed critical temperature thresholds. At point A1, temperatures surpassing 70 ℃ indicated imminent cracking risk, while phase two maintained acceptable temperatures. However, localized areas along Path-A showed moderately elevated temperature differences, warranting targeted attention to prevent thermal-related issues. Phase three revealed heightened thermal risks, with temperatures exceeding limits at point A4 and notable temperature differences along both Path-A and Path-B. Regarding the mechanical analysis, the most surprising finding was that the tensile stresses of point A1 peak in phase three reached more than the tensile strength 150 hours after placing, which means that the possibility of developing internal cracks in that area was significantly high.
Stakeholders such as researchers, construction companies, and contractors stand to benefit from this analysis guidance by implementing predictive methodologies to highlight high-risk areas and apply targeted techniques for temperature variation reduction such as cooling pipe systems. However, this study acknowledges limitations such as variations in key parameters like thermal conductivity, specific heat, and mechanical properties, which significantly influence the model analysis outcomes, the heterogeneous material properties, including Young's modulus, Poisson's ratio, and coefficient of thermal expansion, which add complexity to predicting structural responses to thermal loading, and the complexity of calculating thermal loads from cement hydration. Our study overlooked the cold joint effect due to its intricate nature. Additionally, we did not consider the effect of dead weight, focusing solely on the cement hydration effect in inducing thermal cracks, the findings helping to show the way for future research endeavors aimed at enhancing the thermomechanical interactions in large-scale concrete structures. Besides that, identifying the areas, which are most vulnerable to cracking allows for additional adjustments to the implementation process, such as the strategic application of cooling systems to those areas most susceptible to cracking risk. Recommendations for future research include investigating the influence of reinforcement steel, incorporating additional boundary conditions such as solar radiation and wind speed, including the dead weight and the cold joint effect on the tensile stresses to have more comprehensive analyses in a real construction environment. Ultimately, the insight gained from this study may contribute to the optimization of structural integrity, saving both time and resources in large-scale construction projects.
Acknowledgements
We would like to express our gratitude to Jasa Marga LLC and ADHI KARYA LLC and we would particularly like to mention Mr. Iqbal for his assistance in providing the required data and related consultations.
Compliance with ethics guidelines
The authors declare that they have no conflict of interest or financial conflicts to disclose.
This article does not contain any studies with human or animal subjects performed by any of the authors.