
Introduction
Carbon emissions have become an ever-growing problem for the current and future generations. In 2022, carbon dioxide (CO2) emissions worldwide reached a staggering 36.8 Gt, while the transportation sector alone contributed 7.89 Gt [1]. Although a growing coalition of countries is pledging to reach net-zero emissions, they still fall short of what is required [2]. Hence, electric and fuel cell vehicles have received significantly more attention recently. Electric-powered vehicles utilize electricity and do not directly produce carbon emissions, however, said electricity is still being generated by fossil fuel power plants. Furthermore, the manufacturing of lithium batteries for electric vehicles involves the extraction of rare earth elements and minerals from mines or underground reservoirs, a process that consumes energy and inevitably leads to more CO2 emissions.
Hydrogen [3], biofuel [4-5], and ammonia [6] are sustainable fuels that have been studied as alternative energy sources that have low to zero net carbon and can therefore be used to achieve zero carbon emissions. Among them, hydrogen appears to be the most promising one due to having only water as its combustion product. Unfortunately, its popularity is limited because hydrogen is extremely difficult to transport and store. Conversely, ammonia serves as another carbonfree fuel option for long-term storage, transportation, and power generation. Not only does liquid ammonia have a higher energy density than liquid hydrogen, 12.7 MJ/L and 8.5 MJ/L respectively, at ambient room temperature, but ammonia can also be liquified at a mere 1 MPa of pressure, whereas hydrogen maintains its gaseous form even under
3Mechanical Engineering Department, Petra Christian University, Jalan Siwalankerto 121-131, Surabaya 60236, Indonesia 4Centre for Sustainable Energy Studies, Petra Christian University, Jalan Siwalankerto 121-131, Surabaya 60236, Indonesia
pressures as high as 20 MPa [7]. One of the main drawbacks of ammonia is that the Haber-Bosch process, the foremost broadly adopted production method for ammonia, is heavily dependent on fossil fuels, produces high greenhouse gas emissions, and has high energy requirements. However, many studies have been conducted to mitigate this problem by using solar panels and wind turbines as renewable energy sources [8], hence the emissions from ammonia production and the energy requirement of ammonia production will be reduced in the future. Aside from the production method, ammonia still has many other shortcomings, such as a high autoignition temperature, slow burning velocity, and low heating value as shown in Table 1.
Natural Gas Properties Ammonia Hydrogen Gasoline Diesel Compressed Compressed Compressed Phase Liquid liquid liquid liquid liquid Energy density 11333 8539 31074 36403 7132 [MJ/m<sup>3</sup>]Autoignition 924 844 573 503 723 temperature [K] Lower heating 18.8 120 44.5 42 9 50 value [MJ/kg] Flammability 1.4 - 7.6 0.6 - 7.5 5 - 15 16 - 25 4 - 75 limit [Vol. %] Octane rating 130 >130 90 - 98 107 [RON] Laminar flame 7 43 38 velocity @20 °C 351 1 atm [cm/s]
Table 1 Comparative properties of fuels [9].
There are many different strategies to enhance the burning characteristics of ammonia. These strategies can generally be divided into three main categories, i.e., co-firing with a more reactive fuel, oxygen enrichment, and turbulence enhancement [10]. Studies on co-firing ammonia with more combustible fuels have been reported by Han et al. [11] through blending ammonia, where the increase in hydrogen mole fraction results in faster laminar burning velocity. Guo et al. [12] observed the combustion characteristics of a fuel mixture composed of ammonia and gasoline in an internal combustion engine, where it was found that increasing the amount of ammonia in the mixture would decrease the overall in-cylinder pressure. As for the oxidizer strategy, it mainly revolves around enriching the oxygen concentration, be it by replacing the air with an oxygen-enriched mixture or by completely substituting the air with pure oxygen. Takeishi et al. [13] studied the effect of oxygen enrichment, which showed that an increase in oxygen concentration enhances the stability of combustion. Lastly, the turbulence enhancement approach is based on the wrinkling and stretching of the flame due to turbulence. Ohta et al. [14] observed the effect of wall turbulence on hydrogen/air combustion and found that the turbulence had an impact on the flame's propagation speed, making it 2.04 times faster than the speed of the laminar flame.
Other than the aforementioned method to enhance ammonia combustion, the effects of the combustion conditions on the burning characteristics of ammonia have also been studied. The application of a sub-chamber in a natural gas lean-burn engine was studied in [15]. It was demonstrated that the addition of a sub-chamber could enhance combustion characteristics, e.g., maximum in-cylinder pressure and heat release rate. Our previous study [16] observed the effect of various equivalence ratios on ammonia/oxygen combustion using a constant volume combustor that also utilized a sub-chamber. We found that the highest in-cylinder pressure and the highest combustion efficiency were measured at a 0.8 equivalence ratio [17]. To replicate the combustion processes in a way that mirrors real-world conditions and overcomes the low flammability of ammonia, a follow up study utilized a constant volume combustor. Our previous study [18] investigated the effect of changes in the sub-chamber nozzle diameter in constant volume combustion and found that a larger nozzle diameter decreased the jet velocity. According to Rahman et al. [19], different nozzle geometries are able to affect the turbulence in fluids, which in turn, according to Xia et al. [20], can result in faster ammonia ignition. However, the effects of the sub-chamber nozzle geometries have not been studied widely, especially for ammonia combustion. Thus, the present study continued the previous research by observing the effects of different
nozzle shape geometries at lean and stoichiometric equivalence ratios on the combustion performance of ammonia. Future works will consider NOx emissions and mitigation methods to allow the practical use of ammonia-fueled engines.
Experimental Apparatus and Procedure
Experimental Setup
The experimental setup wasrefitted from the previous experiment in [18]. Figure 1 shows the constant volume chamber in the form of a cross-sectional schematic diagram that was used in this experiment. The constant volume method was used to investigate the combustion of pure ammonia, since it reflects the practical engine operation, where ignition and the subsequent flame propagation occur under a short duration of 1 to 10 ms, resulting in an engine volume that is close to constant. The setup consisted of two chambers; the first chamber was a 19-cc main chamber and the second chamber was a 23.5-cc sub-chamber. A glow plug (NGK-SRM) and a spark plug (NGK-CR8E) were installed in the subchamber. A new cylinder head of a YANMAR TF120V diesel engine was placed at the top of the constant volume chamber, while a regular 92-mm piston was placed at the bottom of the constant volume chamber, which was mounted on a base plate. The initial temperature was set by using an IH heater (AS ONE HI-1000).
Figure 2 shows an overall schematic of the experimental setup. A mixture of ammonia and oxygen was used as the reactive mixture, while argon was used as an inert flushing gas to remove residual gas after combustion. The pressure change caused by the combustion of the mixture was measured by a pressure sensor (Kistler 6054 BR-3-1) placed in the main chamber to measure the pressure change caused by the combustion. The recorded data from the sensor was saved by a data logger (RIGOL DS1104Z). A pressure gauge (NAGANO GC04) was placed on the connecting pipe that connected the constant volume combustor and the cylinders. This sensor was used to monitor the pressure within the pipe, reflecting the pressure inside the constant volume chamber. A band heater (AS ONE JK-1) was used to remove liquid water produced from the combustion in the pipeline. A catalyst, cooling pipe, vacuum pump, and gas washing bottle were used to purify the exhaust gases produced by the combustion.
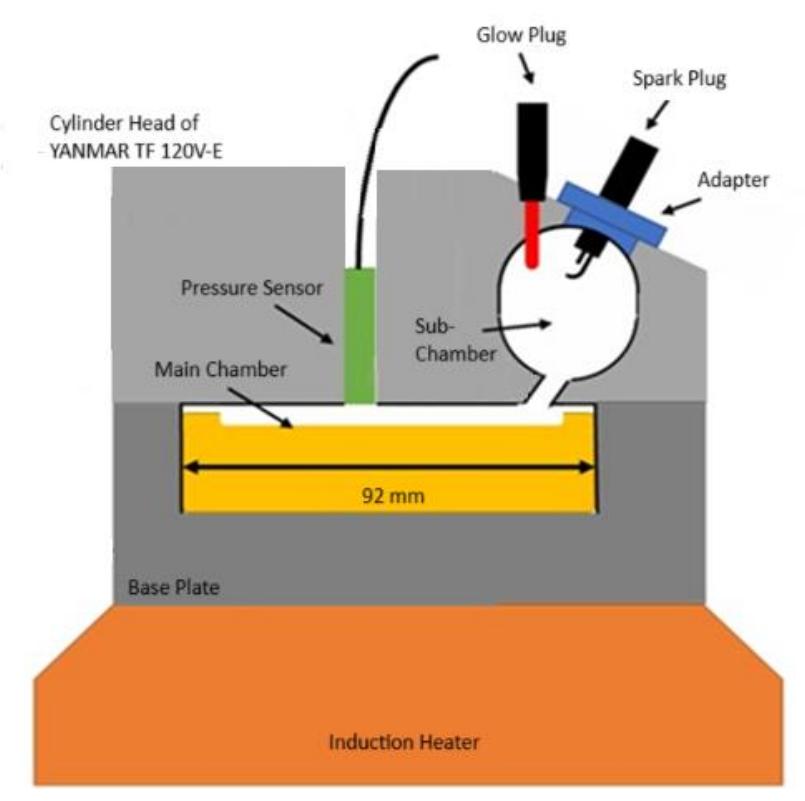
Schematic of the constant volume combustion chamber.
Schematic diagram of the experimental apparatus.
Operational Process and Conditions
In this experiment, the effect of ammonia/oxygen combustion using different sub-chamber nozzle shapes of a constant volume chamber was investigated. The combustion process was started by preheating the oxidation catalyst to its operational temperature. Next, the pipeline was purged with argon to remove any residual air or exhaust gas from previous combustion cycles. A vacuum pump was used to establish a vacuum within the combustor. Once the environment had been prepared, the required amounts of ammonia and oxygen were introduced into the combustor. Combustion was initiated by igniting the spark plug in the sub-chamber, in which all experiment conditions had the same spark ignition energy. The pressure data inside the cylinder was monitored and recorded throughout the process. The resulting gas from combustion was then dispersed through the catalyst for oxidation to ensure complete decomposition of any remaining reactants. Finally, the treated combustion gas was released to the outside air. In this experiment, each condition was repeated five times.
Table 2 shows the experimental conditions for this experiment. The equivalence ratios were varied at 0.6, 0.8, and 1.0. The focus on lean and stoichiometry mixtures in this study is in line with our previous work, where a 0.8 equivalence ratio resulted in the highest in-cylinder pressure and combustion efficiency [17]. In addition, this study also investigated two different nozzle shapes with the same cross-sectional area. Figure 3(a) shows the nozzle with a round shape and a diameter of 10.03 mm. Meanwhile, Figure 3(b) shows the nozzle with a special shape, consisting of two circles of 9.2 mm and 4.0 mm diameter. This special nozzle shape was chosen to investigate the effects of a less rounded geometry, as it may lead to more turbulence, which would promote ignition. The starting pressure, starting temperature, and mixing time were set to 0.2 MPa, 423 K, and 10 min respectively. The partial pressures of ammonia and oxygen were adjusted by the overall reaction equation, as formulated in Eq. (1):
\[4NH_3 + 3O_2 \rightarrow 2N_2 + 6H_2O \tag{1}\]
Table 3 shows the respective partial pressures of ammonia, oxygen, and argon along with their ratio of equivalence. Argon was employed before each test series to purge the exhaust gas after every repetition. The vacuum operations were carried out at every repetition. However, due to the limitation of the vacuum pressure, it was not possible to reach an absolute pressure of 0 MPa using the vacuum method. The vacuum pressure typically reached about 0.032 MPa, which slightly varied between repetitions. As a result, before introducing the ammonia and oxygen, it was expected that a small amount of argon with a partial pressure of approximately 0.032 MPa would remain inside the chamber. Although it was impossible to reach 0 MPa due to the limitation of the vacuum pump, we employed argon as flushing gas to remove the exhaust gases after every repetition as to minimize the effect of the residual gas on the subsequent
combustion. Through flushing with argon, the combustion products of ammonia and oxygen were pushed into the exhaust manifold. After a thorough flushing via the argon gas, the vacuum pump was then activated to clear out as much argon as possible. The partial pressures of oxygen and ammonia in the process of filling were determined using Eqs. (2) and (3) respectively:
\[P_{O2} = \frac{P_{initial} - P_{Ar}}{\frac{4}{3}\phi + 1} \tag{2}\]
\[P_{NH3} = P_{initial} - P_{Ar} - P_{O2} \tag{3}\] where PO2 is the partial pressure of oxygen [MPa], Pinitial is the mixture's initial pressure [MPa], PAr is the partial pressure of argon [MPa], Φ is the equivalence ratio [-], and PNH3 is the partial pressure of ammonia [MPa].
Table 2 Experimental conditions.
| Equivalence ratio [-] | 0.6, 0.8, 1.0 | |
|---|---|---|
| Nozzle area [mm2 ] | 79.01 | |
| Nozzle shape [-] | Round, special | |
| Initial pressure [MPa] | 0.2 | |
| Initial temperature [K] | 423 | |
| Mixing time [min] | 10 | |
| Mixture composition | NH3-O2-Ar | |
Table 3 Filling pressure of ammonia and oxygen.
| Equivalence Ratio [-] | Ammonia Pressure [MPa] | Oxygen Pressure [MPa] | Argon Pressure [MPa] |
|---|---|---|---|
| 0.6 | 0.0749 | 0.0936 | 0.0315 |
| 0.8 | 0.0869 | 0.0815 | 0.0316 |
| 1 | 0.0959 | 0.0719 | 0.0322 |
Photographs of nozzle between sub-chamber and main chamber: (a) round shaped nozzle and (b) special shaped nozzle.
Analytical Methods
The rate of release of heat generated was calculated from the recorded in-cylinder pressure using Eq. (4):
\[\frac{dQ}{dt} = \frac{1}{\kappa - 1} \cdot V \frac{dP}{dt} \tag{4}\] where dQ/dt is heat release rate [J/s], V is the combustion chamber volume [m3 ], P is the combustion pressure [Pa], κ is the specific heat ratio [-], and t is time [s].
The average combustion velocity \(\overline{v_f}\) was calculated by dividing the piston diameter by the combustion time, as shown in Eq. (5):
\[\overline{v_f} = \frac{D}{t_c} \tag{5}\] where D is the piston diameter (0.092 m) and \(t_c\) is the combustion time [s]. The combustion time is defined as the time from ignition until maximum cylinder pressure is achieved.
Mass fraction burned \((r_m)\) represents the ratio of the mass of burned ammonia to the total mass of burned ammonia at any given time and was calculated using Eq. (6):
\[r_m = \frac{M_a}{M} = \frac{P - P_{initial}}{P_{max} - P_{initial}} \tag{6}\] where \(M_a\) is the mass of burned ammonia at any given time [kg], M is the total mass of burned ammonia [kg], and \(P_{max}\) is the maximum cylinder pressure [MPa]. Also, according to the ideal gas equation of state, the mass fraction burned shown in Eq. (7) is equal to the volume ratio of the air-fuel mixture if temperature and pressure do not change by combustion, which is defined as before the combustion state:
\[\frac{M_a}{M} = \frac{V_{a0} \frac{P_{initial}}{RT_{initial}}}{V_{nation}^{P_{initial}}} = \frac{V_{a0}}{V}\] \[(7)\] where \(V_{a0}\) is the instantaneous volume of air-fuel mixture before combustion [m<sup>3</sup>], R is the gas constant [J/(K·mol)], and \(T_{initial}\) is the initial temperature [K]. On the other hand, the volume fraction burned \(r_{V}\) (Eq. 8) is defined as the volume of the combustion gas divided by the volume of the combustion chamber. The unburned gas is assumed to be in compressed adiabatic condition:
\[r_v = \frac{v_a}{V} = 1 - \frac{1 - r_m}{\left[1 + r_m \left(\frac{P_{max}}{P_{initial}} - 1\right)\right]^{1/\kappa}}\](8)
where \(V_a\) is the volume of combustion of the air-fuel mixture [m<sup>3</sup>].
The instantaneous jet speed was calculated by dividing the difference between the volume change of unburned gas and the burned gas with the orifice area. The average jet speed was calculated by dividing this value by the ignition time. Therefore, the volumetric flow rate \(\dot{V}\) [m<sup>3</sup>/s] of gas passing through the orifice was calculated from Eq. (9):
\[\dot{V} = V_m \left(\frac{dr_v}{dt} - \frac{dr_m}{dt}\right) \tag{9}\] where \(V_m\) is the main chamber volume (19 × 10<sup>-6</sup> m<sup>3</sup>). Afterwards, the average jet speed \(\bar{v}_{orifice}\) [m/s] was calculated using Eq. (10).
\[\bar{v}_{orifice} = \frac{\int_0^{t_j} \frac{\hat{v}}{A_{orifice}} dt}{t_j} \tag{10}\] where \(t_i\) is the injection period [s], and \(A_{orifice}\) is the cross-sectional area of the orifice [m<sup>2</sup>].
The combustion duration in this study was defined as the total combustion time in the sub-chamber and the main chamber from the start of ignition until the mass fraction burned reached 100%.
Results and Discussion
In this experiment, each condition was repeated five times. The data set which was closest to the average of all five was chosen to represent the experiment. The pressure inside the cylinders for various nozzle shapes varying equivalence ratios of (a) 0.6, (b) 0.8, and (c) 1.0 is shown in Figure 4. The dotted lines in the graphs represent the upper and lower limits of the uncertainties that were calculated using the standard deviation from the data sets. The experiments were conducted at an initial pressure of 0.2 MPa and initial mixture temperature of 423 K. In each scenario, the rise in pressure can be broken down into two categories: slow rise and rapid rise. The slow rise phase is a result of flame propagation
within the combustion chamber, while the rapid rise phase is triggered by self-ignition or multi-ignition. The presence of the sub-chamber gives rise to the moving of unburned gases from the sub-chamber caused by the expansion of burning gases, which leads to compression and turbulence in the main combustion chamber, ultimately promoting selfignition. The difference in nozzle shape resulted in different peak pressure and start of self-ignition. The round nozzle shape showed higher peak pressure, while the special nozzle shape showed faster start of self-ignition. This can be attributed to the round nozzle shape having a more uniform structure, which enables a more consistent pressure distribution. The general trend shows that increasing the equivalence ratio would result in slower start of self-ignition, reduced overall in-cylinder pressure, and a more notable difference between the two nozzle shapes. This is in line with most ignition delay time measurements of ammonia, where lean mixtures usually lead to shorter ignition delay times [21-22].
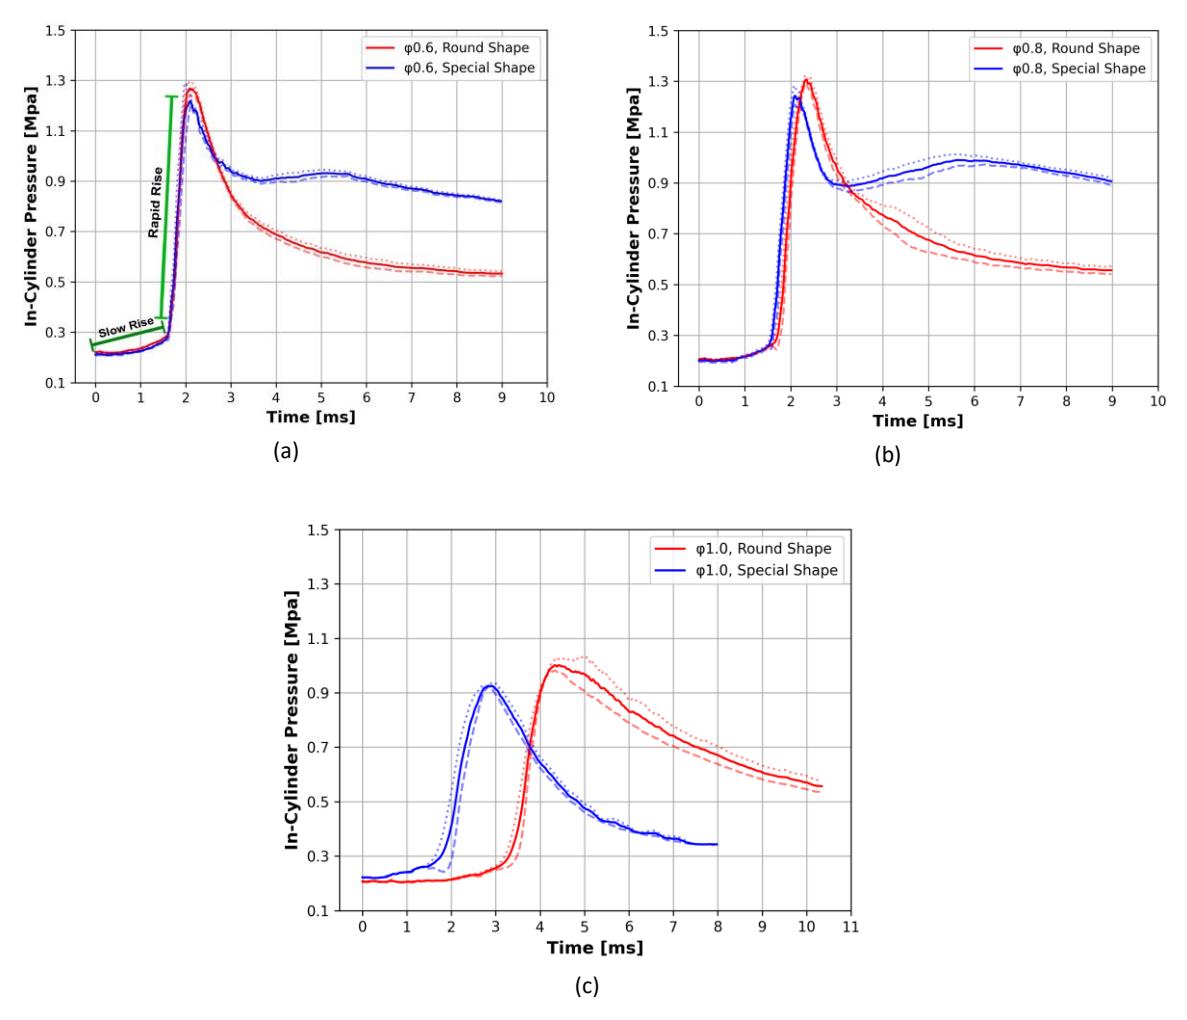
In-cylinder pressure to time with different nozzle shapes at equivalence ratio of (a) 0.6, (b) 0.8, and (c) 1.0.
The maximum pressure inside the cylinders with various nozzle shapes and different equivalence ratios is shown in Figure 5. Under all conditions, the graph showed that the maximum in-cylinder pressure initially increased from equivalence ratio ɸ0.6 to ɸ0.8 and then decreased afterwards. The reason for this initial increase is due to the lower fuel content at ɸ0.6, resulting in lower fuel energy that contributes to pressure increase. Meanwhile, the reason for the low pressure of the stoichiometric mixture (ɸ1.0) is likely due to the ammonia not having enough oxygen to burn properly, which leads to less complete combustion [23]. This implies that among the equivalence ratios studied, 0.8 resulted in the highest peak pressure. Figure 5 also shows that the round shaped nozzle performed better compared to the special shaped nozzle in terms of peak cylinder pressure.
Maximum in-cylinder pressure to equivalence ratio for different nozzle shapes.
The heat release rate was calculated using Eq. (4), as shown in Figure 6 for equivalence ratios of (a) 0.6, (b) 0.8, and (c) 1.0. The heat release rate slowly increased after the ignition of the spark plug inside the sub-chamber, while the surge of heat release rate was due to compressed unburned gases that were moved to the main chamber, leading to selfignition. When most of the fuel mixture had already undergone combustion, the heat release rate started to decrease. For the lean mixture (ɸ0.6 and ɸ0.8), the bulk of the combustion happened even before 2 ms. Meanwhile, the stoichiometric mixture (ɸ1.0) showed a drastically slower combustion and a much lower heat release rate. This implies that the lean mixture is preferable to promote ammonia ignition. It should be noted that the special nozzle shape always started and finished the heat release before the round nozzle. This is attributed to the special nozzle shape, which enhances turbulence in the flow, subsequently allowing for more contact between the mixtures, leading to faster combustion. This is in line with the study done by Xia et al. [20], which showed the promoting effect of turbulence in ammonia ignition. Hence, turbulence enhancement through modification of the nozzle shape influences the thermal dynamics of ammonia.
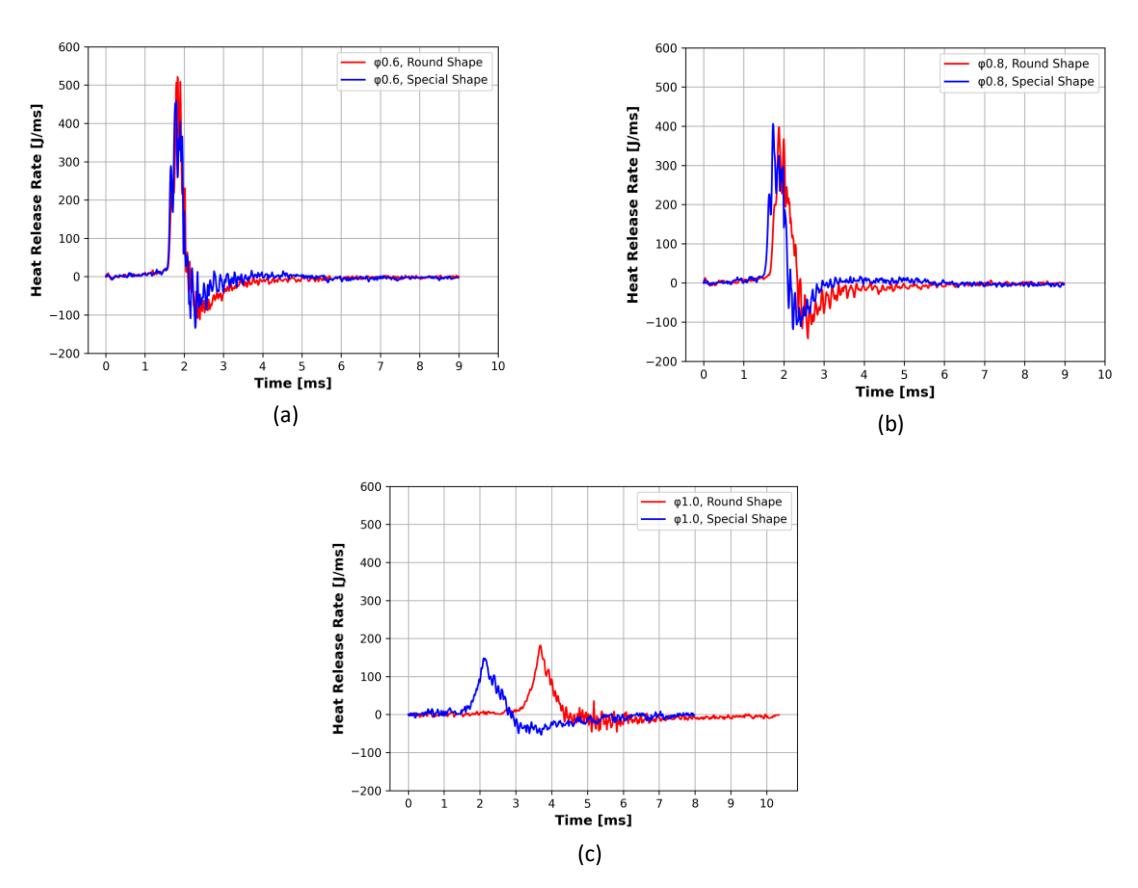
Heat release rate to time with different nozzle shapes at an equivalence ratio of (a) 0.6, (b) 0.8, and (c) 1.0.
Figure 7 shows the correlation among the burned mass fraction with the burned volume fraction with the various nozzle shapes and varying equivalence ratios of (a) 0.6, (b) 0.8, and (c) 1.0. Since the ratio of the sub-chamber to the total volume was around 55.3%, this point in the volume fraction burned can be seen as the main separation between the two combustions. The first 55.3% volume fraction burned represents combustion within the sub-chamber, while the rest of the combustion occurred within the main chamber [17]. This is due to the combustion starting from the high temperature generated by the spark plug propagating radially outwards from the point of ignition to the surrounding fuel and oxidizer mixture [6,24-25]. By the time the flames reach the main chamber, they have effectively burned through all the fuel and oxidizer mixture in the sub-chamber, which ensures that there are no more unburned gases left in the sub-chamber. Furthermore, it can be seen from the mass fraction burned that the majority of the mass was burned within the main combustion chamber. However, as shown in Figure 8, which depicts the combustion duration at different equivalence ratios for the two nozzle shapes, the combustion that took place within the sub-chamber required significantly more time. This is mainly due to the compression and turbulence added to the main chamber by the unburned gases that were moved from the sub-chamber to the main chamber as the burned gases expanded from the sub-chamber. Compressing the fuel mass within the main chamber increases its temperature and pressure, making it more reactive and prone to self-ignition, which accelerates the combustion process.
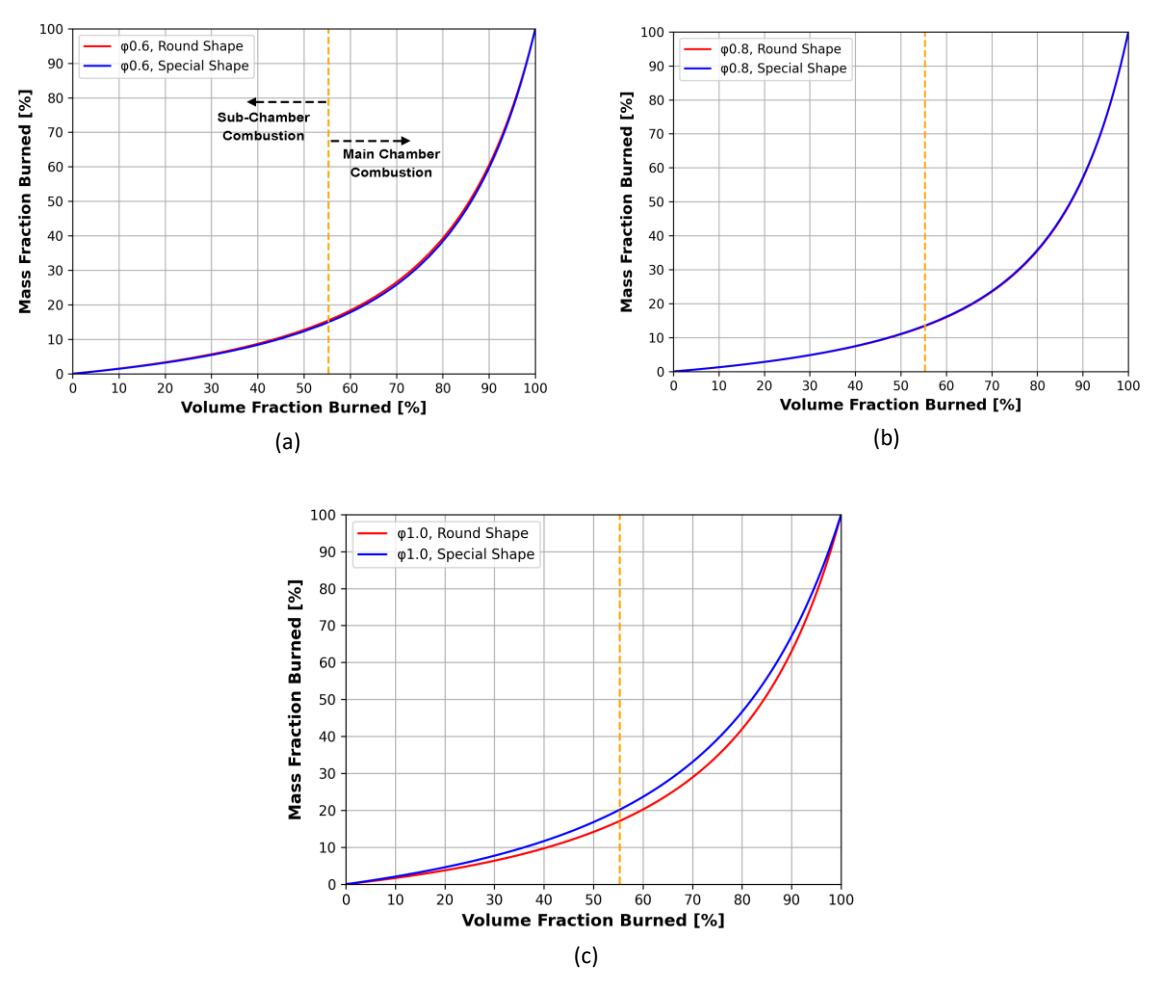
Mass fraction burned to volume fraction burned with different nozzle shapes at (a) 0.6, (b) 0.8, and (c) 1.0.
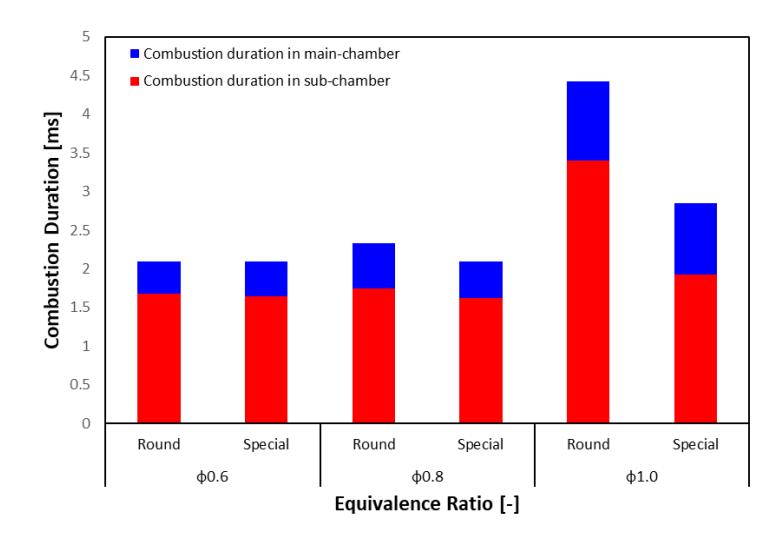
Combustion duration to equivalence ratio with different nozzle shapes.
The faster mass fraction burned, depicted in Figure 7, and the earlier start of self-ignition, shown in Figures 4 and 6, can be attributed to the faster combustion duration. The special nozzle shape consistently showed faster combustion compared to the round nozzle shape for all equivalence ratio conditions. This is most likely due to the special shape of the nozzle, which promotes turbulence, which in turn enhances flame propagation in ammonia [26]. The general trend for the graphs is that the combustion duration becomes longer with an increase of the equivalence ratio. This is because increasing the equivalence ratio correlates directly to decreasing the oxygen content. The effects of the varying equivalence ratios are more substantial in the combustion duration within the sub-chamber than the main chamber and highlights the stronger impact of the equivalence ratio on laminar combustion in the sub-chamber.
The average jet speed with various nozzle shapes and varying equivalence ratios is shown in Figure 9. The graph shows that the special nozzle shape consistently generated a higher average jet speed. This is likely due to the special nozzle shape, which promotes more turbulent flow. This turbulent flow helps mix the fuel and air more effectively while also facilitating flame spread, which in turn increases the average jet speed. This also correlates with the shorter combustion duration of the special nozzle shape shown in Figure 8, which was likely due to the higher average jet speed shortening the combustion duration.
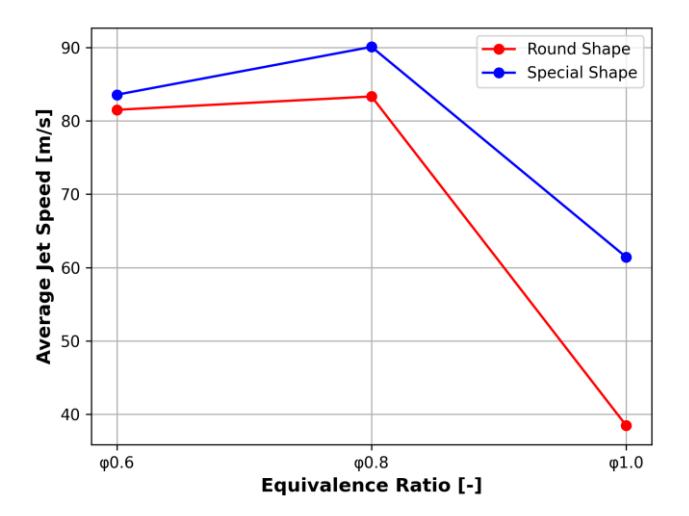
Average jet speed to equivalence ratio for different nozzle shapes.
Conclusion
With the purpose of investigating the effects of sub-chamber nozzle shape and equivalence ratio, the experiment in this study was conducted using a mixture of oxygen, argon, and ammonia with the utilization of a constant volume combustor equipped with a sub-chamber. The results suggest that there are trade-offs between the two nozzle shapes studied in the experiment, i.e., the round nozzle could generate higher pressure, while the special shaped nozzle could boost the jet speed. The benefits from the round nozzle came from its more uniform structure compared to the special shaped nozzle. This allowed the round shape nozzle to have a more even distribution of pressure, while the special shaped nozzle was likely able to create more pressure zones. On the other hand, the special shape created a more turbulent flow, which increased the jet speed.
With regards to the equivalence ratio, ɸ0.8 showed the best performance for most of the combustion characteristics studied. Even though ɸ0.6 has access to more oxygen, which promotes combustion, this comes at the cost of a reduction in the total fuel amount, which inevitably leads to more downsides. Overall, the lean mixtures still performed better than their stoichiometric counterparts, as can be seen in the heat release rate, where both ɸ0.6 and ɸ0.8 were able to finish the majority of the combustion within a timeframe of 2 ms.
Analysis of the mass fraction burned suggests that the majority of the fuel mass was burned within the main chamber, even though it had a slightly smaller volume compared to the sub-chamber. This was due to the initial expansion caused by the burned fuels from the sub-chamber, which pushed the unburned fuels towards the main chamber, leading to a more compressed/pressurized combustion within the main chamber. This also led to the period of combustion happening inside the main chamber to be significantly shorter compared to the sub-chamber.
Acknowledgements
This research was supported by the Japan Society for the Promotion of Science, Grants-in-Aid for Scientific Research (No. 19K04244), Sophia University, and Petra Christian University (Project code: 097/PSTM/ST/2023) in an international collaborative project. The authors are grateful to these institutions for their support.
Compliance with ethics guidelines
The authors declare that they have no conflict of interest or financial conflicts to disclose.
This article does not contain any studies with human or animal subjects performed by any of the authors.