
Introduction
Tunnel boring machine construction often encounters fault fracture zones and other adverse geological phenomena, which can very easily cause tunnel construction collapse accidents [1-3]. In the absence of early warning, the impact of the collapse disaster in TBM construction will be far greater than with the traditional drilling and blasting method. Therefore, it is important to carry out prediction of collapse risk during TBM tunnel construction to ensure that the TBM can be successfully and safely drilled in the tunnel.
TBM construction collapse risk evaluation involves various uncertainties, such as evaluation indicators that are not easy to quantify, data measurement errors, the influence of expert subjectivity, and other characteristics, all of which lead to unavoidable ambiguity and randomness in the evaluation of TBM construction collapse risk. From this it can be seen that the risk assessment of existing tunnels is essentially an uncertainty problem with both randomness and ambiguity [4-7]. Currently, most methods for dealing with uncertainty issues are based on probability theory and fuzzy mathematics. In terms of probability theory, the total probability formula, probabilistic decision-making, and reliability estimation have been used to study risks at arbitrary locations in tunnels, subway construction safety, tunnel excavation, and slope engineering. Probability theory is more suitable for engineering problems where a large amount of quantitative data can be obtained. However, when predicting the risk of TBM tunnel construction collapse, only a small amount of quantitative data can be obtained. FAHP is a systematic analysis method that helps to solve assessment
1China Railway Construction Bridge Engineering Bureau CO., LTD., Tianjin 300300, China
School of Civil Engineering, Xi'an University of Architecture and Technology, Xi'an 710055, China
3 Shaanxi Key Laboratory of Geotechnical and Underground Space Engineering, 4The Irtysh River basin Development Engineering Construction Administration Bureau, Urumqi 830000, China 5The 3RD Engineering Co., LTD. of China Railway Construction Bridge Engineering Bureau Group, Shenyang 110043, China
problem where decision information is characterized by uncertainty. Many researchers have applied FAHP to their risk assessments of underground engineering and got good results [8-10]. From previous studies, we can find that FAHP is an effective tool for addressing uncertainties in underground engineering risk assessment. This method can express the fuzziness of the evaluation system with its membership function to a certain extent. However, it does not take into account the randomness possessed by the membership function itself, which makes the evaluation system lose its randomness. TBM construction collapse risk evaluation is both fuzzy and random. Either one being ignored may cause the judgment result to deviate from the real situation. Two main problems can be summarized related to the application of FAHP in risk evaluation of tunnel construction: 1) the membership degree of an indicator is mostly calculated by the empirical formula of the membership function, which makes it difficult to express the randomness between the risk evaluation indexes and the risk level; 2) in the comprehensive evaluation of the membership degree and weight, FAHP mostly uses the linear average weighting calculation method, which weakens the influence of the indicator with a larger weight on the evaluation results. Both of these problems will lead to the evaluation results not being consistent with the engineering reality.
The cloud model is introduced to the risk assessment considering both fuzziness and randomness. The cloud model, proposed by Li [11], is a research method that can take into account both the randomness and fuzziness of uncertainty problems, which provides a new research idea for solving uncertain problems such as engineering risk assessment. After more than twenty years of exploration, the cloud model has been applied in many fields, such as data mining and risk assessment, and has achieved many outstanding results [12-14].
In view of the abovementioned problems, considering that the risk pregnancy environment of collapse accidents in TBM construction is different from that of drilling and blasting construction, the influence of TBM drilling parameters on collapse is taken into account in the evaluation system. Five parameters, i.e., rock hardness and underground water related to engineering geological conditions and two key TBM drilling parameters, i.e., thrust and penetration, were selected as the evaluation indicators. An evaluation index system of TBM construction collapse risk was established. The three numerical characteristics of the cloud model are used to represent the membership degree of the different risk levels corresponding to each evaluation indicator. A nonlinear operator is introduced into the comprehensive calculation of the weight vector and membership degree matrix to determine the final collapse risk level. A new model based on cloud modeling-nonlinear FAHP method for TBM construction collapse risk evaluation is constructed, which can be applied to the TBM construction collapse risk evaluation of a hydraulic transmission system.
Risk Evaluation Index System of the TBM Construction Collapse
Determine the Risk Evaluation Indicators
When encountering adverse geological conditions such as fault fracture zones, the scope of the loosening circle of the surrounding rock expands after encountering underground water, which is easy to cause tunnel collapse accidents. In addition, the continuous vibration of the TBM will also aggravate the damage to the surrounding rock. Therefore, the risk evaluation of collapse in TBM construction should not only consider geological factors such as joint characteristics and underground water but also the parameters of TBM drilling. Considering these two aspects of the risk pregnancy environment of collapse accidents in TBM construction, the risk factors affecting TBM tunnel construction collapse are categorized into engineering geological conditions and TBM drilling parameters.
Engineering Geological Conditions (X1)
Engineering geological conditions are the factors that have the greatest impact on tunnel collapse. Among them, the basic quality of the rock and the underground water condition are the most important parameters reflecting the engineering geological conditions. By summarizing and analyzing the relevant references and combining the principles of representativeness [15-19], feasibility and easy quantification of indicators, hardness of rock mass (X11), degree of rock integrity (X12), degree of joints development (X13), angle between direction of the structural plane and the tunnel axis (X14), and underground water (X15) were selected as the evaluation indicators of the engineering geological conditions.
TBM Drilling Parameters (X2)
In the process of tunneling, the TBM cutter plate has an obvious extrusion effect on the palm face of the surrounding rock, causing deformation of the surrounding rock, and the cutting effect and vibration of the cutter plate also affect the stability of the surrounding rock. Furthermore, the cutting action and vibration of the cutter will also affect the stability of the surrounding rock. The TBM tunneling parameters of cutterhead thrust (\(X_{21}\)) and length of penetration (\(X_{22}\)) can optimally reflect the state of the TBM tunneling [20, 21]. In this paper, \(X_{21}\) and \(X_{22}\) were selected as the indicators for collapse risk evaluation of TBM tunnel construction.
Based on the analysis results of 1.1.1 and 1.1.2, a three-layer collapse risk evaluation indicator system for TBM tunnel construction was established, as shown in Figure 1.
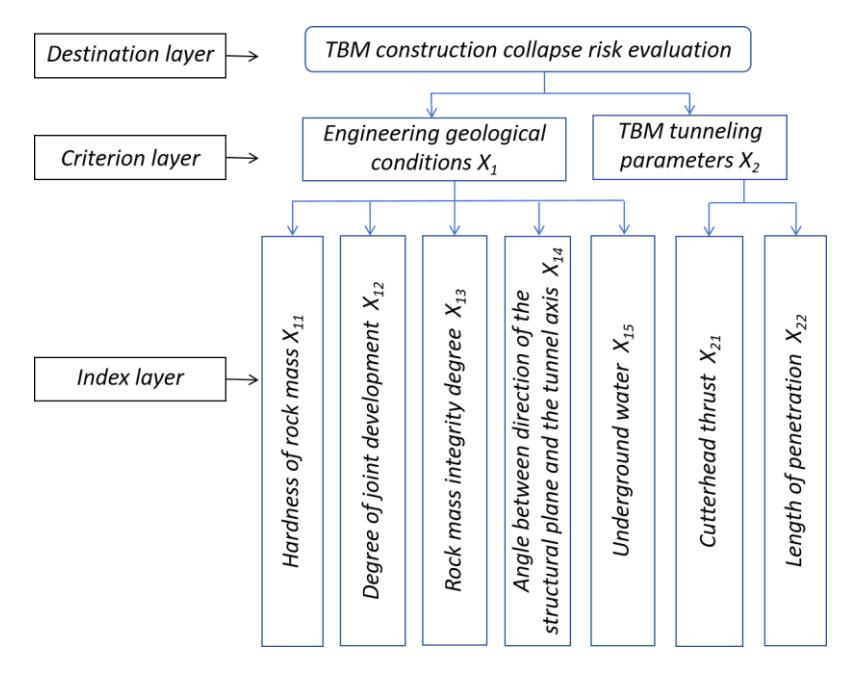
Figure 1 Risk evaluation index system for collapse in TBM tunnel construction.
Division of Risk Level of Evaluation Indicators
According to relevant standards [22], the risk level of TBM tunnel construction collapse is divided into five levels, and the corresponding risk status is risk-free (I), low risk (I), medium risk (I), high risk (IV), and extremely high risk (IV), respectively. The risk level thresholds corresponding to the seven evaluation indicators were divided according to the relevant research results. The results of the division are shown in Table 1.
| Influencing factor | Engine | TBM drilling pa | TBM drilling parameter X₂ | ||||
|---|---|---|---|---|---|---|---|
| Risk level | X11 | X12 | X13 | X14 | X15 | X21 | X22 |
| I | Extremely hard | Complete | Not development | 0~10° | Anhydrous | >18,000 kN | <5mm/min |
| П | Hard | More complete | Minor development | 10~30° | Seepage | 13,000~18,500 kN | 5~9mm/min |
| III | Medium | Broken | Comparative development | 30~50° | Drip | 8,000~13,500 kN | 9~15mm/min |
| IV | Soft | Tattered | Developmental | 50~70° | Filamentous flow | 4,000~8,500 kN | 10~25mm/min |
| V | Very soft | Extremely broken | Extremely development | 70~80° | Water burst | <4,500 kN | >50mm/min |
Table 1 Risk level classification of the evaluation indicators.
Prediction of Collapse Scale
Incorporating the qualitative classification of engineering rock mass stability from reference [15] and the criteria for tunnel collapse scale and rock mass classification from reference [23], this study synthesized the data feedback from the construction site personnel of the case study. After summarizing, organizing, and adjusting the information, the predicted scale of collapse range in TBM tunnel construction and the corresponding risk levels are presented in Table 2.
| Risk level | Collapse Scale | Corresponding consequences and treatment measures |
|---|---|---|
| I | No collapse phenomenon | No impact on construction |
| \(I I\) | Collapse height <1 m, or collapse volume <10 m3 | Minor engineering losses |
| Ш | Collapse height 1-3 m, or collapse volume 10-30 m3 | Impact on construction |
| IV | Collapse height 3-6 m, or collapse volume 30-60 m3 | Grave consequence |
| V | Collapse height \(\geq\)6 m, or collapse volume \(\geq\)60 m3 | Catastrophic consequences, immediate shutdown and reorganization |
Table 2 The scale of collapse corresponding to different risk levels.
TBM Construction Collapse Risk Evaluation Model
In this paper, the FAHP method was improved by cloud model and nonlinear operator, respectively. Based on the constructed risk evaluation indicator, a new model for risk evaluation of tunnel collapse in TBM construction by improved FAHP method with cloud model and nonlinear operator was established. The specific model building process was as follows.
Establishment of the Factors Sets and the Evaluation Set
Based on the three-tier risk evaluation index system established in the first section, the factor sets were constructed as \(U_1 = \{X_{11}, X_{12}, X_{13}, X_{14}, X_{15}\}\) and \(U_2 = \{X_{21}, X_{22}\}\) respectively. \(U_1\) is the set of risk factors, while \(U_2\) is the set of risk evaluation indicators.
The evaluation set of this study is a set of five risk levels, \(S = \{I \coprod I I V \}\).
Membership Degree Calculation
The risk level judgment of the i-th factor in U yields a single-factor judgment vector Ri, which indicates the membership degree of the i-th risk factor to different risk levels in S. The \(R_i\) of the same factor set is called the single-factor judgment matrix \(\mathbf{R} = [R_1 \quad R_2 \quad \cdots \quad R_i]\), where R represents a kind of fuzzy relationship between the evaluation index and the risk of collapse level.
Cloud Model Overview
The cloud model is an algorithmic model that can convert qualitative concepts into quantitative values, as proposed by Li [11]. Based on probability theory and fuzzy set theory, the cloud model expresses the mapping relationship between the evaluation language and quantitative values in a one-to-many manner by calculating the three numerical characteristics (\(E_x E_n H_e\)), i.e., expectation, entropy, and hyperentropy. The accuracy of the evaluation results can be increased by taking into account the randomness and fuzziness of the evaluation of tunnel collapse risk.
Suppose that U is a quantitative domain expressed in exact numerical terms and T is a qualitative concept of the space of U. If the membership degree \(\mu_T\) (x)\(\in\)[0,1] of an element x(x\(\in\)X) of T is a random number with a stabilizing tendency, as shown in Equation (1), then the distribution of the mapping of concept T from domain U to interval [0,1] in the space of number fields is called a cloud.
\[\mu_T(x): U \rightarrow [0,1], \forall x \in X(X \subseteq U), x \rightarrow \mu_T(x)\] (1)
\((x,\mu_T(x))\) represents the cloud drop, where each cloud drop is a quantitative realization of the qualitative concept. The minimum unit of the cloud model is the basic cloud model, and the normal cloud model is one of the commonly used basic cloud models with universal applicability. In this study, the cloud model was based on the cloud model to calculate the membership degree. The cloud expectation equation, in the form of normal distribution, can be expressed as follows:
\[\mu_T(x) = exp\left(\frac{-(x - E_x)^2}{2E_n^2}\right) \tag{2}\]
In Eq. (2), \(E_x\) is the expected value that best represents the qualitative concept. \(E_n\) is the entropy, which represents the uncertainty in the judgment of the qualitative concept. \(H_e\) is the hyperentropy, which represents the uncertainty in the entropy. ∼ (, 2 ), where Enn satisfies ∼ (, 2 ). The use of these three numerical characteristics to represent a qualitative concept is more in line with the nature of risk evaluation [11].
Numerical Characteristics Calculation of the Cloud Model
The first step of using the cloud model to calculate the membership degree is to convert the threshold division results in Table 1 into cloud numerical characteristics that can be used in the cloud model calculation. The calculation equation is shown in Eq. (3):
\[E_{x} = (C_{min} + C_{max})/2 E_{n} = (C_{min} - C_{max})/6 H_{e} = kE_{n}\] (3)
where Cmin and Cmax represent the minimum and maximum values of each risk level threshold corresponding to the evaluation index, respectively; k is constant, determined according to the fuzzy degree of the evaluation index; a value of 0.1 was taken in this study.
As can be seen from Table 1, the evaluation indicators contain both quantitative and qualitative indicators. Among them, the qualitative indicators are quantified using a scoring method from 0 to 100, with higher scores indicating higher risks. The quantitative values corresponding to different risk levels are as follows, Ⅰ: 0-20, Ⅱ: 20-40, Ⅲ: 40-60, Ⅳ: 60- 80, V: 80-100. The cloud numerical characteristic of each evaluation indicator are shown in Table 3.
| Evaluation indicator | Engineering geologic requirement X1 | TBM drilling parameter X2 | |||||
|---|---|---|---|---|---|---|---|
| Risk Level | X11 | X12 | X13 | X14 | X15 | X21 | X22 |
| Ⅰ | [10,3.33,0.33] | [10,3.33,0.33] | [10,3.33,0.33] | [5,1.67,0.17] | [10,3.33,0.33] | [20781,927,92.7] | [3.0,1.00,0.10] |
| Ⅱ | [30,3.33,0.33] | [30,3.33,0.33] | [30,3.33,0.33] | [20,3.33,0.33] | [30,3.33,0.33] | [15750,967,96.7] | [7.0,0.67,0.07] |
| Ⅲ | [50,3.33,0.33] | [50,3.33,0.33] | [50,3.33,0.33] | [40,3.33,0.33] | [50,3.33,0.33] | [10750,967,96.7] | [11.5,1.17,0.11] |
| Ⅳ | [70,3.33,0.33] | [70,3.33,0.33] | [70,3.33,0.33] | [60,3.33,0.33] | [70,3.33,0.33] | [6250,750,75.0] | [17.5,2.50,0.25] |
| Ⅴ | [90,3.33,0.33] | [90,3.33,0.33] | [90,3.33,0.33] | [80,3.33,0.33] | [90,3.33,0.33] | [2250,750,75.0] | [30.0,5.00,0.50] |
Table 3 Cloud digital characteristics of the different risk levels corresponding to evaluation indicators.
Cloud Model Diagram of Evaluation Indicators
The cloud model properties are demonstrated as an example of a cloud model diagram for the length of penetration, X22, as shown in Figure 2. Taking the numerical characteristics of the cloud model corresponding to level IV risk (17.5, 2.5, 0.25) as an example, the qualitative concepts expressed are: when the value of penetration is 17.5 mm/min, the maximum value of entropy is 2.5, and the maximum value of superentropy is 0.25. The possibility of collapse risk level IV is the greatest. When using entropy (En) to express the fuzziness and randomness of judgment, its value has uncertainty. Therefore, superentropy (He) is used to judge the vagueness and randomness of entropy. The larger He, the more discrete the cloud droplets behave, which represents the greater randomness of the value of the membership degree. This method is more in line with the essence of evaluation in practical engineering compared to the traditional membership degree equation, which can calculate a definite value.
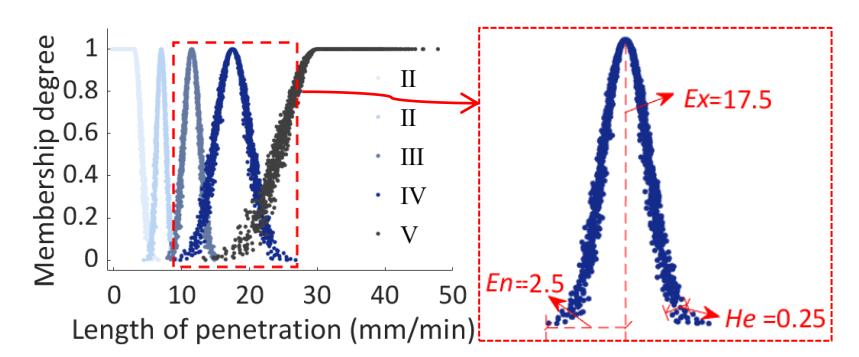
Cloud model diagram of the length of penetration.
Establish the Weight Set
The weights of the indicators should be determined to get accurate evaluation results. In this study, the hierarchical analysis method was used to calculate the weights of the evaluation indicators for the collapse risk in TBM tunnel construction. First of all, according to the 1-9 scale method, experts were invited to compare the importance of the elements of each layer in the established evaluation system. The comparison results were used as the judgment matrix for constructing evaluation indicators, as shown in Eq. (4):
\[A = \left(a_{ij}\right)_{n \times n} = \begin{bmatrix} 1 & \cdots & a_{1n} \\ \vdots & \ddots & \vdots \\ 1/a_{1n} & \cdots & 1 \end{bmatrix} \tag{4}\] where n is the number of evaluation indicators; \(a_{ij}\) represents the importance of the i-th evaluation indicator relative to the j-th evaluation indicator. The weight values were then calculated using the Matlab programming software based on the principle of the maximum eigenvalue method.
Because professional subjective judgment is often inconsistent, it was necessary to test the consistency of the judgment matrix. The judgment method was expressed as in Eq. (5):
\[CR = \left( (\lambda_{max} - n)/(n-1) \right) / RI \tag{5}\] where RI is the average random consistency index and the value rules are shown in Table 4.
Table 4 The random consistency index [7].
| n | 1 | 2 | 3 | 4 | 5 | 6 | 7 | 8 | 9 |
|---|---|---|---|---|---|---|---|---|---|
| RI | 0 | 0 | 0.52 | 0.89 | 1.12 | 1.26 | 1.26 | 1.41 | 1.46 |
If CR < 0.1, the matrix meets the consistency requirement. If \(CR \ge 0.1\), it means that the matrix does not meet the consistency requirement, so the judgment matrix must be reconstructed to calculate the weight until the matrix meets the consistency requirement.
The calculated weights of all the evaluation indicators are used to form the weight vector used for the risk synthesis calculation w as shown in Eq. (6)
\[\mathbf{w} = \begin{bmatrix} w_1 & w_2 & \cdots & w_i \end{bmatrix} \tag{6}\] where \(w_i\) represents the weight of the i-th evaluation indicator.
Fuzzy Comprehensive Assessment
According to the established three-layer index system, the fuzzy comprehensive calculation is carried out successively from the bottom layer (index layer) to the highest layer (target layer). First, the evaluation factor weight and the membership degree of the index layer are calculated. The results are calculated as a single factor evaluation matrix of the criterion layer, which is calculated with the evaluation factor weights of the target layer. Finally, the comprehensive evaluation vector of the target layer is obtained, i.e., the result of landslide risk grading B. Eq. (7) is the calculation method for B:
\[B = W \circ R \tag{7}\] where \('\circ'\) is called an operator and represents the operational relation of \(\boldsymbol{W}\) and \(\boldsymbol{R}\).
When an evaluation factor has a large impact on the collapse risk in TBM tunnel construction and other risk factors have a small impact, although the factor is given a large weight, its impact on the degree of collapse will be weakened after the linear weighted average calculation. This is prone to cause the evaluation results to be inconsistent with the actual engineering situation. In this study, the nonlinear fuzzy synthetic operator is used instead of the linearity in the FAHP method for comprehensive evaluation.
The nonlinear fuzzy synthetic operator form can be expressed as follows:
\[\begin{cases} f(w_1, \dots w_n, r_{11}, \dots r_{1n}, \Lambda) = (w_1 r_{11}^{\lambda_1} + \dots + w_n r_{1n}^{\lambda_n})^{\frac{1}{\lambda}} \\ \lambda_i \ge 1, i = 1, 2, \dots, n \end{cases}\] (8)
where Λ is the prominent influence degree coefficient of the evaluation indicator, denoted as = (1 2 ⋯ ), = (1 2 ⋯ ). The greater the prominent influence degree of the index on the evaluation target, the greater the value of i . The method of taking the value of Λ can be determined by referring to the idea of a hierarchy analysis method on a scale of 1 to 9. The specific value of Λ is shown in Table 5.
| Scale | Meaning |
|---|---|
| 1.5 | The index factor has almost no influence |
| 2.5 | The index factor has a slightly more prominent influence |
| 3.5 | The index factors have an obvious and prominent influence |
| 4.5 | The index factors have a strong prominent influence |
| 5.5 | The index factors have an extremely prominent influence |
| Adjacent scale median value, indicating two adjacent values | |
| 2.9, 3.0, 4.0, 5.0 | The scale of this time between the scales |
Table 5 Criteria for determining the prominent influence coefficient.
Novel Model for Risk Evaluation of TBM Construction Collapse
The tunnel collapse risk evaluation system for TBM construction could then be constructed. On this basis, the cloud model and nonlinear operator are introduced into the traditional FAHP method to improve it. A novel model for evaluating the collapse risk of TBM construction based on cloud model-nonlinear FAHP is established. The specific evaluation process is shown in Figure 3.
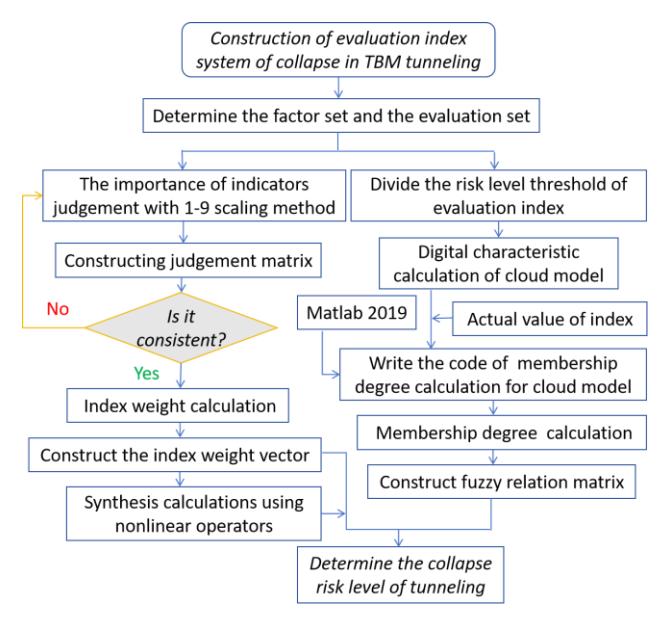
Risk assessment process of TBM tunnel construction.
Engineering Example Analysis
Project Overview
The excavation diameter of a TBM construction hydraulic tunnel project is given as 7.83 m. Geological conditions in the TBM construction section are complicated and several faults fracture zones exist. The width of a fracture zone is generally 0.5~2.5m, and it is composed of loose and broken materials such as fractured rock, celestite, and fault (mud) gravel, etc. The surrounding rock is prone to fracture due to the development of joints and fissures. Peripheral rock joints and fissures have developed and the rock body is easily broken. The tunnel wall is often accompanied by linear water flow during the construction in fault fracture zones. Water seepage and dripping are dominant in the non-fault fractured section. Under such geological conditions, TBM tunneling construction is very prone to collapse, water surge, and other geological disasters.
Calculation of Index Weight
According to the established collapse risk evaluation index system, relevant experts are invited to compare the importance of risk evaluation indexes for the specific situation of TBM construction of a water transfer tunnel. The criterion layer judgment matrix \(\mathbf{A}\) and the indicator layer judgment matrixes \(\mathbf{A}_1\) and \(\mathbf{A}_2\) are obtained, and the maximum eigenvalue method is used to calculate the criterion layer weight value vector \(\mathbf{w}\) and indicator layer weight vectors \(\mathbf{w}_1\) and \(\mathbf{w}_2\). The specific results are shown in Table 6.
| Judgment matrix | Is it consistent? | Weight vector |
|---|---|---|
| \[A = \begin{bmatrix} 1 & 2 \\ 1/2 & 1 \end{bmatrix}\] | yes | w = (0.667,0.333) |
| \[A_1 = \begin{bmatrix} 1 & 2 & 4 & 3 & 1/2 \\ 1/2 & 1 & 3 & 2 & 1/3 \\ 1/4 & 1/3 & 1 & 1/2 & 1/5 \\ 1/3 & 1/2 & 2 & 1 & 1/4 \\ 2 & 3 & 5 & 4 & 1 \end{bmatrix}\] | yes | \(w_1\) = (0.245, 0.122,0.061,0.082,0.490) |
| \[A_2 = \begin{bmatrix} 1 & 3 \\ 1/3 & 1 \end{bmatrix}\] | yes | \(w_2\) = (0.750, 0.250) |
Table 6 Weight vector of the evaluation index.
According on the calculation results of the weight vector, the seven evaluation indicators for the target layer were calculated as \((X_{11}, X_{12}, X_{13}, X_{14}, X_{15}, X_{21}, X_{22}) = (0.166, 0.082, 0.041, 0.054, 0.326, 0.222, 0.111)\). It can be seen that the order of importance of the evaluation indexes of the collapse risk of hydraulic tunnel TBM construction was as follows: \(X_{15} > X_{21} > X_{11} > X_{22} > X_{12} > X_{14} > X_{13}\). It can be seen that, for this project, the groundwater, total thrust, rock hardness, and the length of penetration play important roles in the collapse risk of TBM tunnel construction. It is necessary to focus on the changes of these parameters during the construction process.
Membership Calculation
The first 2,210 m construction section of a particular hydraulic tunnel was divided into 21 subsections according to the geological characteristics, such as lithology and faults. Take the evaluation process of the \(K5 + 080^{\sim}K5 + 092\) construction section as an example. By analyzing and studying the engineering geological conditions of the construction site and the real-time digging parameters of the TBM, the quantitative value of each evaluation indicator in this construction section was obtained, as shown in Table 7.
Table 7 Field values of the evaluation indicators.
| Evaluation indicator | X12 | X13 | X14 | X15 | X21 | X22 |
|---|---|---|---|---|---|---|
| Quantification value | 30 | 8 | 17 | 13 | 6520 | 6.2 |
Based on the actual values of the evaluation metrics, the membership degree matrix \(R_1\) for \(X_{11}\)-\(X_{15}\) and \(R_2\) for \(X_{21}\) and \(X_{22}\) was obtained using the cloud model calculation process.
\[\boldsymbol{R}_1 = [r_{11} \quad r_{12} \quad r_{13} \quad r_{14} \quad r_{15}]^T = \begin{bmatrix} 1 & 0 & 0 & 0 & 0 \\ 0 & 1 & 0 & 0 & 0 \\ 0.8315 & 0 & 0 & 0 & 0 \\ 0.1146 & 0.0009 & 0 & 0 & 0 \\ 0.6596 & 0 & 0 & 0 & 0 \end{bmatrix} \boldsymbol{R}_2 = [r_{21} \quad r_{22}]^T = \begin{bmatrix} 0 & 0 & 0.0002 & 0.9352 & 0 \\ 0.0081 & 0.4876 & 0.0001 & 0 & 0 \end{bmatrix}\]
Nonlinear Fuzzy Comprehensive Evaluation
Determine the Prominent Influence Coefficient of Risk Indicators
From Table 6, the prominent influence coefficient of two risk factors and seven evaluation indicators was determined by combined with the actual construction situation of the project. The prominent influence coefficient of risk factors in the index system is shown in Table 8.
Table 8 Prominent influence coefficient of the first-level risk factors.
| Evaluating indicator | X1 | X2 | X11 | X12 | X13 | X14 | X15 | X21 | X22 |
|---|---|---|---|---|---|---|---|---|---|
| λ | 2.5 | 1.5 | 2.5 | 1.5 | 1.5 | 1.5 | 4.5 | 2.5 | 3.5 |
Comprehensive Evaluation of First-Level Nonlinear Fuzzy Comprehensive Evaluation
The nonlinear fuzzy comprehensive judgment is started from the index layer. The process of calculating the judgment result vector \(\mathbf{B}_1\) of \(X_1\) is taken as an example. As can be seen from Table 8, \(\Lambda_1\)= (2.5 1.5 1.5 1.5 4.5), \(\lambda = max(\Lambda_1) = 4.5\), then
\[B_1 = f(w_1 \quad R_1 \quad \Lambda_1) = (0.245, 0.122, 0.061, 0.082, 0.490) \circ \begin{bmatrix} 1^{2.5} & 0 & 0 & 0 & 0 \\ 0 & 1^{1.5} & 0 & 0 & 0 \\ 0.8315^{1.5} & 0 & 0 & 0 & 0 \\ 0.1146^{1.5} & 0.0009^{1.5} & 0 & 0 & 0 \\ 0.6596^{4.5} & 0 & 0 & 0 & 0 \end{bmatrix}\]
\[= \begin{pmatrix} \left(0.2449 \times 1^{2.5} + 0.0612 \times 0.8315^{1.5} \\ +0.0816 \times 0.1146^{1.5} + 0.4898 \times 0.6596^{4.5} \right)^{\frac{1}{4.5}}, \\ \left(0.1224 \times 1^{1.5} + 0.0816 \times 0.0009^{1.5}\right)^{\frac{1}{4.5}}, 0,0,0 \end{pmatrix} = (0.8016, 0.6270, 0, 0, 0)\]
Normalization of \(B_1\) is obtained:
\[B_1 = (0.561, 0.439, 0, 0, 0)\]
The same steps as above can be calculated as:
\[B_2 = (0.005, 0.294, 0.003, 0.700, 0)\]
Comprehensive Evaluation of Secondary Nonlinear Fuzzy Analysis
A new one-factor evaluation matrix \(\mathbf{R} = (\mathbf{B}_1 \mathbf{B}_2)^T\) was obtained from \(\mathbf{B}_1\) and \(\mathbf{B}_2\). The same calculation process as above was used to obtain the final comprehensive evaluation vector \(\mathbf{B}\), with the weight vector \(\mathbf{w}\) for nonlinear fuzzy comprehensive judgement:
\[B = (0.351, 0.315, 0.001, 0.325, 0)\]
Determine the Collapse Risk Level
From the principle of maximum membership degree, it can be seen that maximum \(\mathbf{B}_{max} = 0.351 = \mathbf{B}_I\). Therefore, it can be concluded that the risk level of construction collapse in the K5 + 080\(^{\sim}\)K5 + 092 excavation section is I. According to the record of actual construction situation on site, it can be seen that the TBM excavation of the K5 + 080\(^{\sim}\)K5 + 092 excavation section is smooth. No collapse phenomenon occurs during construction. This is consistent with the risk assessment results.
Risk Assessment Result of TBM Construction Section of a Hydraulic Tunnel
The other twenty construction sections were evaluated for collapse risk according to the evaluation process of \(K5 + 080^{\circ}K5 + 092\). The evaluation results are shown in Table 9.
| Tunnel mileage | X1 | X2 | X3 | X4 | X5 | X6 | X7 | Forecast risk level | Actual collapse scale | Comparison of results |
|---|---|---|---|---|---|---|---|---|---|---|
| K5+080~K5+092 | 27 | 30 | 8 | 17 | 13 | 6520 | 6.2 | I | No collapse phenomenon | Consistent |
| K5+092~K5+298 | 53 | 33 | 14 | 15 | 25 | 12090 | 5.1 | I | No collapse phenomenon | Consistent |
| K5+298~K5+346 | 52 | 34 | 24 | 15 | 55 | 7000 | 5.8 | П | There are small local drops | Consistent |
| K5+346~K5+600 | 57 | 38 | 17 | 16 | 34 | 13500 | 4.6 | П | There are small local drops | Consistent |
| K5+600~K5+764 | 45 | 27 | 65 | 14 | 36 | 10200 | 4.9 | Ш | The height of the collapse chamber is 0.4 m, and the collapse volume is 0.32 m3 | Consistent |
| K5+764~K5+812 | 28 | 30 | 34 | 15 | 28 | 11400 | 6.5 | П | 5+793 is 2.5 m long, 0.8~1 m wide, high 0.2~0.7 m cavity appeared | Consistent |
Table 9 Evaluation results of 21 construction sections of a tunnel.
| Tunnel mileage | X1 | X2 | Х3 | X4 | X5 | X6 | X7 | Forecast risk level | Actual collapse scale | Comparison of results |
|---|---|---|---|---|---|---|---|---|---|---|
| K5+812~K5+953 | 46 | 28 | 15 | 18 | 53 | 13100 | 7.8 | Ш | Cave roof, hole wall local small drop block, high 0.05~0.1 m | Consistent |
| K5+953~K6+125 | 50 | 67 | 58 | 12 | 35 | 6450 | 14 | IV | Multiple collapse cavity, the largest collapse cavity appears at 6+103, the collapse yolume is about 32 m3 | Consistent |
| K6+125~K6+313 | 48 | 51 | 53 | 13 | 34 | 7200 | 5.8 | IV | There is a collapsed cavity in the left wall between 6+250 and 6+275, with a maximum height of about 3 m | Consistent |
| K6+313~K6+337 | 31 | 49 | 51 | 12 | 42 | 8210 | 5.5 | Ш | There is visible collapse in some parts of the cave chamber | Deviation |
| K6+337~K6+472 | 32 | 32 | 54 | 11 | 84 | 11930 | 6.8 | Ш | There is visible collapse in some parts of the cave chamber | Consistent |
| K6+472~K6+484 | 31 | 48 | 14 | 82 | - | - | Data missing | |||
| K6+484~K6+611 | 33 | 31 | 50 | 15 | 75 | - | - | Data missing | ||
| K6+611~K6+626 | 30 | 53 | 52 | 14 | 86 | 7464 | 6.4 | Л | Multiple collapse cavity in the cave, the collapse height of about 0.4~1 m | Consistent |
| K6+626~K6+830 | 38 | 67 | 57 | 12 | 85 | 11600 | 7.6 | Ш | At 6+650, there is a collapse cavity at the right waistline, about 4 m and about 3 m long and about 2 m thick | Consistent |
| K6+830~K6+895 | 36 | 39 | 59 | 10 | 5 | 10400 | 6.6 | I | A large collapse cavity of about 13 m high appeared in the cave chamber | Deviation |
| K6+895~K7+000 | 32 | 28 | 48 | 12 | 43 | - | - | Data missing | ||
| K7+000~K7+191 | 48 | 37 | 53 | 13 | 84 | 15460 | 9.2 | Л | A collapsed cavity appears at 7+040 with a maximum height of about 0.7 m | Consistent |
| K7+191~K7+214 | 35 | 35 | 56 | 12 | 78 | 7240 | 7.7 | Л | A collapse cavity appears at 7+194, with a collapse height of about 0.3~1 m | Consistent |
| K7+214~K7+230 | 31 | 32 | 23 | 18 | 6 | 9000 | 6.7 | П | No collapse phenomenon | Deviation |
| K7+230~K7+295 | 28 | 33 | 22 | 17 | 5 | 8580 | 11.7 | Ш | Local structural surface, there are falling blocks | Deviation |
Table 9 Continued. Evaluation results of 21 construction sections of a tunnel.
Discussion
As can be seen from Table 8, three construction sections could not be rated because of insufficient information. The ratings of the remaining eighteen sections showed that fourteen sections were in line with the actual situation on site, while four sections had deviations from the actual construction situation on site. The possible reason for the deviation is the deviation between the preliminary survey data and the actual situation. Specifically, the preliminary geological survey work was not a continuous survey of the tunnel excavation area, which led to a discrepancy between the preliminary geological survey and the actual geological conditions. This problem is difficult to avoid in the construction process. Therefore, it can be concluded from the evaluation results that this method has a certain degree of reliability.
In this project, the four evaluation indicators of underground water, cutter-head thrust, rock hardness, and length of penetration played an important role in potential construction collapse. As there are many faults and broken zones in the construction section, the surrounding rock is very prone to collapse if it encounters groundwater. In addition, TBM operators should focus on observing the numerical changes of cutter-head thrust and length of penetration. When traversing through the broken ground, measures should be taken to reduce the thrust of the TBM cutter and pass through at a constant speed as much as possible without stopping. Once the values of cutter-head thrust and penetration change substantially, stop the machine immediately to check the surrounding rock condition in front of the palm face. According to the actual situation, do the necessary support measures to avoid sudden large-scale collapse or even TBM jamming disaster.
The traditional FAHP risk evaluation method mostly calculates the evaluation index membership degree by constructing the membership function. Although it reduces the influence of subjectivity compared with direct scoring by experts, it needs to take into account all relevant evaluation indicators. This is not only inefficient, but also prone to human error, which affects the accuracy and reliability of the calculation results. Moreover, the affiliation degree between the evaluation indicators and the risk level obtained by the traditional method is a one-to-one correspondence. In actual engineering, the value of a specific evaluation index does not have a one-to-one correspondence with a certain risk level and there is fuzziness and randomness. In addition, the traditional FAHP mostly uses linear average arithmetic in the comprehensive judgment of the membership degree and weight, which will weaken the influence of the indicators with larger weights on the evaluation results. The proposed model constructed according to the FAHP can well improve the randomness and nonlinearity problems in the evaluation of TBM construction collapse risk. Compared with the traditional FAHP, the proposed model can well consider the randomness between evaluation indicators and risk level in TBM construction collapse risk evaluation. It reduces the effect that using linear operator synthesis will weaken the weights of important indicators.
Conclusions
This study, targeting the unique characteristics of TBM construction, innovatively developed a risk assessment indicator system for TBM construction collapse that incorporates drilling parameters. By introducing the cloud model and nonlinear operators, significant improvements were made to the traditional FAHP. The following are the conclusions based on this innovative study of TBM construction collapse risk.
The breakthrough of this research lies in the fact that, compared to traditional drill-and-blast tunneling collapse risk studies, we are the first to integrate cutting head thrust and drilling length, two critical TBM drilling parameters, into the assessment system. These parameters offer a novel perspective for understanding the surrounding rock conditions. Compared to assessment systems based solely on geological conditions, our system is more comprehensive and accurately depicts the full spectrum of TBM construction collapse risk.
This study applies the cloud model to the membership degree calculation in the traditional FAHP method, utilizing the three numerical characteristics of the cloud model (Ex, En, He) to replace the precise functional formulas, thereby considering the randomness of indicator values and calculations. Moreover, by substituting nonlinear operators for linear operators in the calculation of comprehensive risk levels, we can more accurately capture the significant impact of high-risk factors on assessment outcomes. These improvements substantially enhance the effectiveness of the traditional FAHP method in engineering applications, resulting in more objective and reasonable TBM construction collapse risk assessment results.
This study employed the cloud model-nonlinear FAHP method to conduct a collapse risk assessment of 21 TBM construction sections in a hydraulic tunnel project. The assessment results confirmed the efficiency of the proposed model, with the assessment outcomes for eighteen sections highly consistent with actual on-site conditions, while only three sections could not be rated due to insufficient information. This application example highlights the exceptional operability and accuracy of the new model in practical TBM construction collapse risk analysis, bringing significant theoretical innovation and practical guidance to the field of tunnel construction risk assessment.
Compliance with ethics guidelines
The authors declare that they have no conflict of interest or financial conflicts to disclose.
This article does not contain any studies with human or animal subjects performed by any of the authors