
Introduction
As a result of the increase in the number of vehicles worldwide, the possibility of car accidents and fatalities are themselves accordingly increased (Haghi Kashani et al., 2013). 1.35 million people die annually, and between 20 and 50 million more people suffer injuries due to road traffic crashes. The purpose of using thin-walled tubes as an energy absorber in crashworthiness is due to their excellent energy absorption ability and the fact that they are lightweight. They are widely used in automotive applications. The characteristic of lightweightedness encourages designs and manufacturing that decreases fuel consumption and carbon emissions. Steel structures have been used in automotive applications due to their high ductility, low cost, and higher energy absorption capability (Vinayagar & Senthil Kumar, 2017). The thin-walled tubes' role in particular is to absorb the structures' kinetic energy during an axial or lateral crash through plastic deformation to protect the people within the car interior (S. F. Abdulqadir et al., 2021, 2024; S. F. Abdulqadir & Tarlochan, 2021; Samer et al., 2021; Samer Fakhri Abdulqadir, 2022; Vinayagar et al., 2019).
Crashworthiness concentrates on occupant integrity to decrease the number of casualties that occur each year. Masoud Haghi Kashani et al. considered the performance of a thin-walled square absorber subjected to axial compression in a study included single and bitubular square tubes. Their results showed that the energy absorption
by the bitubular tube constructions is greater than the sum of the individual energies absorbed by inner and outer tubes due to the interaction between the wall structures (Haghi Kashani et al., 2013). Muhammad Kamran et al. proposed a new bitubular configuration consisting of inner tubes and outer tubes with different cross-sectional geometries subjected to impact loading. Their proposed geometries varied from simplistic to a complicated polygonal section. Their study determined energy absorption, mean crushing force, specific energy absorption, peak force, and deformation modes. The Complex Proportional Assessment (COPRAS) was carried out to specify the best configuration, from which it was found that a configuration of inner and outer hexagonal tubes was optimal (Kamran et al., 2017).
Behnam Jafarian et al. investigated the energy absorption of empty and polyurethane foam-filled circular bitubular tubes subjected to quasi-static loading. The study compared the energy absorption of bitubular and the equivalent mono-tubular tubes. They concluded that the energy absorbed by the bitubular profile was greater than that by the mono-tubular profile (Jafarian & Rezvani, 2017). Abbas Rahi examined the influence of aluminum tube geometry and combined tubes (bitubular) on energy absorption both numerically and experimentally. They used circular and square tube cross-sections subjected to static loading in their study, the outcomes of which showed good agreement between experimental and numerical results. They concluded that the energy absorption of bitubular tubes was higher than that of mono-tubal square or circular, and also higher than the sum of their individual absorbed energies (Rahi, 2018). S. Sharifi et al. studied aluminum bitubular circular tubes with different diameters experimentally, as subjected to quasi-static loads. Their study included the effects of the tube wall thickness and the interaction between the inner and outer tubes on the crashworthiness parameters and each tube's diameter. They concluded that the energy absorbed and the maximum load are nearly equal to each tube's individual contribution. Compared to the mono-tubal absorber, the bitubular absorber with the same mono-tubal mass shows a reduced absorbed energy, crushing load, and smoother fluctuation waves (Sharifi et al., 2015). Quirino Estrada. et al. studied numerically the effects of bitubular clearance based on polygonal and circular cross-sections under quasi-static loading. The study used a variety of clearances between the tubes, concluding that this plays a significant role in the crashworthiness performance of the structures (Estrada et al., 2019). K. Vinayagar and A. Senthil Kumar, and K. Vinayagar et al. studied the behavior of bitubular tubes made from stainless steel subjected to quasi-static compression. The structures consisted of an inner tube that was one of the polygons whilst the outer tube was circular. Their results showed that the bitubular profiles have higher energy absorption and average crush force than the single tubes (Vinayagar et al., 2019; Vinayagar & Senthil Kumar, 2017). M. Seitzberger et al. investigated the crushing performance of thin-walled mono-tubular and bitubular structures subjected to axial loading. Their study concluded that the bitubular structure was superior to mono-tubal specimens due to the presence of the inner tube (Seitzberger et al., 2000). Sajad Azarakhsh et al. studied the energy absorption of a foam-filled and empty bitubular circular made from brass and subjected to quasi-static axial loading both experimentally and numerically. Their results emphasized the benefits of utilizing bitubular tubes as energy absorbers (Azarakhsh et al., 2015). Yong Zhang. et al. studied the crashworthiness performance of thinwalled foam-filled squared bitubular tubes subjected to dynamic loading, showing that their crashworthiness was significantly improved in comparison to a foam-filled mono-tubal tube (Zhang et al., 2012)
Mohammadbagher et al. considered the performance of a bitubular structure subjected to direct axial loading. Their structure consisted of conical inner and circular outer tubes. Their numerically predicted results have been validated via theoretical and experimental solutions. Furthermore, the bitubular results obtained were compared with the single empty and foam-filled normal structures in terms of crushing force. The results obtained led to the conclusion that a bitubular structure could decrease the initial peak force during impact. As a result, it should enhance crushing load under oblique loading (Azimi & Asgari, 2016)
Manmohan Dass Goel numerically studied the crashworthiness of single, double, and multi-wall square and circular tube structures with and without foam cores, as subjected to axial loading. It was found that the bitubular and tritubular structures showed considerably improved energy absorption compared to a single structure, and further that circular tubes had higher energy absorption compared to square tubes for the same configuration (Goel, 2015). Samer et al. examined double hexagonal tubes under dynamic loading. Their study used different inner tubes whilst maintaining an outer tube of fixed size. The study used 14 specimens to evaluate the energy absorption, crushing force efficiency, and maximum peak force, concluding that an outer tube 60 mm in size with an inner hexagonal side of 45 mm was the optimal choice since the chosen specimen had a 33% greater crushing force efficiency and a 63% lower peak force than the conventional (monotube) design (S. Abdulqadir et al., 2021).
Description of the bitubular circular profile
The typical thin-walled circular energy absorber is a single tube known as a monotube, with specified dimensions such as diameter, thickness, and length. In this study, the reference circular tube (monotube) has dimensions of 2 mm thickness, 350 mm length, and a perimeter of 300 mm. This monotube structure will serve as a baseline for comparison with the proposed designs. The primary objective of the current study is to propose a design that effectively reduces the initial peak force generated during dynamic loading in the course of a collision. This reduction in peak force is of utmost importance as it can significantly contribute to minimizing the number of casualties and saving lives within the car interior during an accident.
The proposed design involves a bitubular (double tube) structure, comprising inner and outer circular tubes. This bitubular configuration is intended to enhance the energy absorption capacity and improve crashworthiness performance compared to the monotube design. By utilizing a bitubular structure, this study aims to achieve a more efficient and safer energy absorber that can better protect vehicle occupants during collisions. In the initial study, the lengths of both the outer and inner tubes were maintained at 350 mm, which is equal to the length of the reference monotube. Additionally, the thicknesses of both the inner and outer tubes were set at 1 mm, resulting in a total thickness of 2 mm, which is equivalent to the monotube's thickness.
The primary focus of the initial study was to vary the perimeters of both the inner and outer tubes while ensuring that the total mass of the bitubular structure remained the same as that of the monotube. This mass preservation was achieved by ensuring that the average of their perimeters was equal to the perimeter of the monotube. As a result, despite the changes in perimeters, the total mass of the bitubular structure remained unchanged, allowing for a more even-handed comparison between the proposed bitubular design and the reference monotube.
In the subsequent stages of the study, the perimeters of both the outer and inner tubes were varied to create six different bitubular configurations: (350-250), (340-260), (330-270), (320-280), (310-290), and (305-295) mm. These configurations were established by simultaneously reducing the outer perimeter by 10 mm and increasing the inner perimeter by an identical amount. The last configuration was obtained by further reducing the outer perimeter by 5 mm and similarly increasing the inner perimeter. Next, the study investigated the effect of shortening the inner tube's length while keeping the outer tube's length constant at 350 mm. Six different lengths for the inner tube were examined: 350, 340, 330, 320, 310, and 300 mm, where each configuration was obtained by reducing the length by 10 mm. In total, the study evaluated 36 different configurations resulting from the combination of the six different perimeters and six different inner tube lengths. From these configurations, six specimens were selected based on the lowest peak force and the highest Crush Force Efficiency (CFE). Finally, the best-performing configuration was chosen using the Complex Proportional Assessment (COPRAS) technique, considering both the reference monotube configuration and the six selected specimens. COPRAS helps to identify the most effective design that achieves the primary objective of reducing the initial peak force and enhancing crash force efficiency.A subsequent trial for further enhancement was conducted on the chosen configuration by changing the thicknesses of both the inner and outer tubes. During this trial, the inner tube length was preserved, while the outer tube's length was varied.
The study investigated different combinations of thicknesses for the inner and outer tubes while keeping the overall thickness of the structure constant. By varying the thicknesses, the study aimed to optimize the energy absorption performance and crash force efficiency of the chosen bitubular configuration. This trial allowed for a comprehensive evaluation of how different combinations of thicknesses for the inner and outer tubes impacted the overall crashworthiness of the structure. It provided valuable insights into the most effective thickness configuration to achieve the desired reduction in peak force and enhancement in energy absorption capabilities. The results from this trial contributed to refining the design of the bitubular structure to further enhance its safety performance and occupant protection in the event of a collision.
Evaluation of crashworthiness criteria
Energy absorber
The purpose of the energy absorber member in the structure is twofold: first, to absorb and dissipate the kinetic energy resulting from collisions through plastic deformation, and second, to reduce the initial force and consequently the deceleration, which can pose a high risk to the occupants in the car cabin.
The energy absorption (EA) of the structure can be quantified and determined from a load-displacement curve, denoted as the integral of the force-displacement relationship. It represents the amount of energy absorbed by the energy absorber during the deformation process, and plays a critical role in enhancing occupant safety by reducing the impact forces experienced during collisions. The higher the energy absorption capacity of the structure, the better it can protect the occupants by effectively absorbing and dissipating the energy generated during an impact and can be denoted as (Azimi & Asgari, 2016; Goel, 2015).
\[EA = \int_0^d P. \, d\delta \tag{1}\]
Crushing Force Efficiency (CFE)
The crushing force can be calculated by dividing the mean (average) crushing force () by the peak crushing force (), denoted as:
\[CFE = \frac{P_m}{P_{max}} \tag{2}\]
CFE is an essential parameter used to evaluate the energy-absorbing structures' performances (Isaac & Oluwole, 2015) (Isaac CW & Oluwole O, 2015). The higher the CFE, the better the vehicle's crashworthiness. If the CFE approaches unity, this means it is closer to the peak force, and hence the change in the deceleration is minimal, as desired (Figure. 1); by contrast, if the ratio is lower, sudden deceleration will occur, and the occupants consequently placed in a more serious situation.
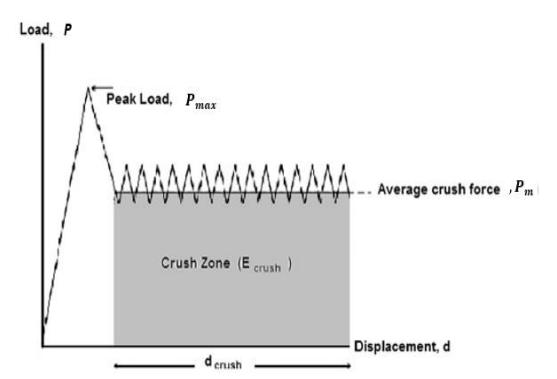
Ideal force-displacement diagram (Tarlochan et al., 2013)
Maximum crushing load ()
When a vehicle is involved in a collision, the impact leads to the generation of the so-called peak force, which is the highest force experienced during the collision. At this stage, the first fold forms rapidly, and this moment is considered the point of maximum peak force, posing the most danger to the vehicle occupants. As the first fold develops, the force starts to decrease. The deformation process continues as subsequent folds are formed, resulting in a subsequent increase in force. This pattern of force fluctuation continues with the formation of multiple folds until the force eventually dissipates. The number of force fluctuations correlates with the number of folds generated during the deformation process. The peak force represents the force required to initiate the structure's deformation, signifying the initial impact intensity, whilst the mean force indicates the structure's energy absorption capacity as it collapses. In other words, the mean force characterizes the average force exerted on the vehicle structure during the entire deformation process, reflecting the structure's ability to absorb energy during the collision. (Isaac CW & Oluwole O, 2015; Tarlochan, n.d.).The structure's peak force should be reduced to as great an extent as possible, whilst the difference between the peak force and the mean crushing force should be minimized to avoid high deceleration during a collision (Lankarani, 2006).
Materials and tube configuration
The use of steel alloys in car structures is widespread due to the various advantageous properties they offer. Firstly, steel alloys provide excellent formability, allowing for complex shapes and designs to be easily achieved. Additionally, they exhibit high strength and stiffness, contributing to the overall structural integrity of the vehicle. A favourable massto-cost ratio makes it a cost-effective choice for automotive applications. Moreover, steel alloys display remarkable corrosion resistance, ensuring the longevity and durability of car structures. The low production cost of steel further
adds to its attractiveness for manufacturers. Another critical attribute is steel's high energy absorption capacity, which is vital in ensuring occupant safety during accidents. This capability to absorb impact energy during collisions is one of the primary reasons for using steel in vehicle structures. Steel alloys also demonstrate good fatigue properties, making them reliable and durable under repeated loading conditions. Their ability to work hard and age appropriately allows car structures to maintain their mechanical properties over time. Additionally, steel's excellent paintability enables car manufacturers to achieve appealing aesthetics and corrosion protection.
In conclusion, the combination of these essential properties makes steel the preferred choice for vehicle structure designers and manufacturers. The steel properties used in the study are listed in Table 1, highlighting the specific characteristics that contribute to its widespread use in the automotive industry.
| Parameter Value | Description | |||
|---|---|---|---|---|
| Α | 146.7 MPa | Material parameter | ||
| В | 896.9 MPa | Material parameter | ||
| N | N0.320 | Strain power coefficient | ||
| С | 0.033 | Material parameter | ||
| M | 0.323 | Temperature power coefficient | ||
| \(\varepsilon_{\dot{0}}\) | \(1.0 s^{-1}\) | Reference strain rate | ||
| ρ | 7850 kg/\(m^3\) | Density | ||
| Tm | 1773 K | Melting temperature | ||
| Ср | 486 J/kg-\(K^0\) | Specific heat | ||
Table 1 Summary of parameters for A36 steel (Ahmad & Thambiratnam, 2009).
Finite element modelling
The structure model in this research is a thin-walled bitubular circular tube (Figure 2). The non-linear finite element code ABAQUS-Explicit was used to predict the behavior of the structure when loaded dynamically. The entire structure consists of an inner circular tube, outer circular tube, bottom (base) rigid plate, and striker rigid plate. Both the inner and outer tubes were modelled by using quad element shape with 4node shell elements (S4R) explicit, enhanced hourglass and element deletion. The element size was chosen to be 5 mm. The contact used to simulate the interaction between all components was general contact, and the coefficient of friction for all the contact surfaces was set to 0.2 (S. F. Abdulqadir, 2018; Ahmad & Thambiratnam, 2009; Lankarani, 2006; Tarlochan et al., 2013; Zhang et al., 2012). The bottom plate was modelled as a rigid body and the degree of freedom was fixed in both the transitional and rotational directions, while the striker plate was modelled as a rigid body for which transitional displacement was permitted in the direction of the impact load.
The striker mass was chosen to be 25% of a compact car (1100 kg) and it was thus set as 275 kg. The striker's velocity was chosen from the New Car Assessment Program (NCAP) by the National Traffic Safety Administration (NHTSA) and was modelled as 56 km/h. The energy absorber structure was assumed to absorb a kinetic energy equivalent to 275 kg, while in reality the maximum energy absorbed by both tubes was much less than 50% (Davies et al., n.d.; Tarlochan, n.d.)
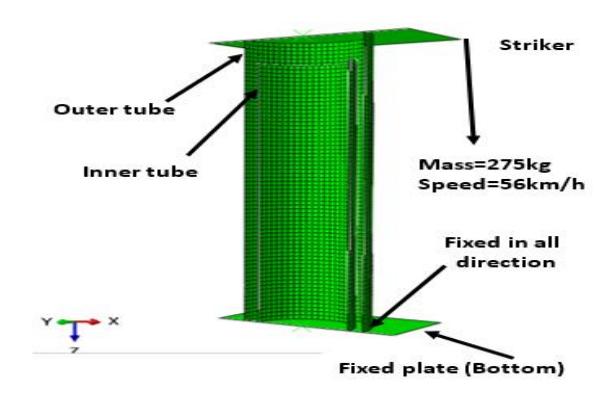
Figure 2 Finite element analysis setup for the bitubular structure
Results and Discussions
Bitubular tubes
The utilization of bitubular tubes in this study serves two main purposes: first, to reduce the initial peak force associated with dynamic impacts during accidents, and second, to evaluate their performance as energy absorbers. Six different bitubular tubes with varying perimeters were investigated, with the reference being the monotube profile having a perimeter of 300 mm, a thickness of 2 mm, and a tube length of 350 mm. For each bitubular configuration at each perimeter, six different inner tube lengths were studied, resulting in a total of 36 specimens.
The numerical results have consistently demonstrated a significant decrease in the initial peak force for all the bitubular tubes, regardless of changes in perimeters. This reduction is attributed to the specific deformation mode and the decrease in tube rigidity achieved through the bitubular design. It is important to note that these results hold even after shortening the inner tube for all the specimens. Figure 3, which illustrates the specimens with preserved mass (before shortening the inner tube), further emphasizes the significant reduction in the initial peak force observed in the bitubular tubes when compared to the monotube profile. Additionally, Figure 3 shows a slight increase in the initial peak force for the bitubular tubes with decreased clearance between the inner and outer tubes. This increase can be attributed to the increased interaction between the tubes in those configurations. Overall, the bitubular design proves to be effective in reducing the initial peak force and the crushing force efficiency. The force-displacement curves of both the mono-tubal and bitubular tubes are illustrated in Figure 4. Notably, all the bitubular tubes showed a lower initial force than the monotube for the same mass. Furthermore, apart from reducing the initial peak force, the fluctuations (waves) observed in the bitubular tubes are smoother and lower compared to those in the mono-tubal tube. This can be attributed to the change in the deformation mode, as depicted in Figure 5. The altered deformation mode in the bitubular configuration contributes to the improved performance and enhanced crashworthiness of the structure, as evidenced by the lower initial force and smoother force-displacement curves.
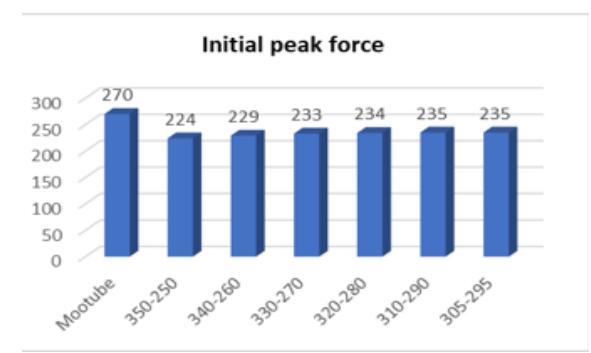
Initial peak force for monotube and bi-tubular for the same mass.
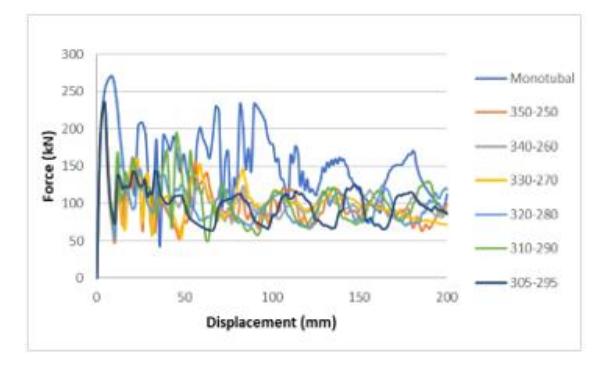
Force–displacement for mono tube and bitubular for the same mass.
The deformation mode of the monotubal specimen collapses with a mixed mode and Euler mode, resulting in higher amplitude and, consequently, a significant difference between the maximum and average loads. In contrast, the bitubular configuration exhibits a more uniform collapse with a mixed mode deformation, leading to smoother amplitude, lower peak force, a smaller difference between the maximum and average loads, and consequently higher Crush Force Efficiency (CFE), as shown in Figure 5. This highlights the advantage of the bitubular design in achieving better energy absorption and overall crashworthiness performance compared to the monotubal structure.
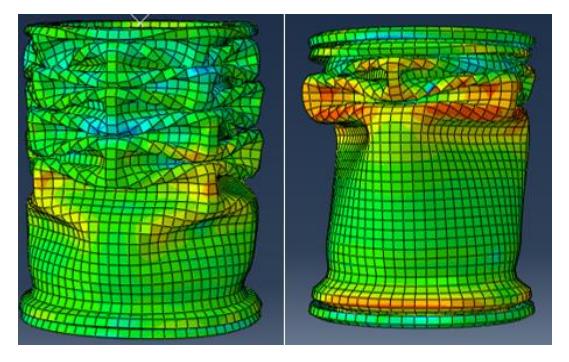
Deformation mode bitubular (left) and monotubal (right).
Bitubular tubes with different inner tube lengths
The results presented in Table 2 indicate that shortening the inner tube in all specimens leads to improved performance in terms of reducing the initial peak force. This is because the striker initially hits the longer tube (outer) alone, causing the first fold to begin its formation. While this formation is still in progress and the peak force is decreasing, the striker reaches the shorter (inner) tube, resulting in a spike in force. This combination of forces generates the maximum force during the collision. Consequently, the initial peak force does not represent the maximum force during the collision when the inner tube is shortened.
Therefore, using the bitubular tube with different inner tube lengths achieves a significant reduction in the initial force compared to both the monotube and the bitubular tube with non-shortened inner tube. Additionally, the maximum force begins later in the course of the collision, and is lower. Figures (6-11) illustrate the different bitubular forcedisplacement curves for various bitubular configurations, considering changes in both outer and inner perimeters.
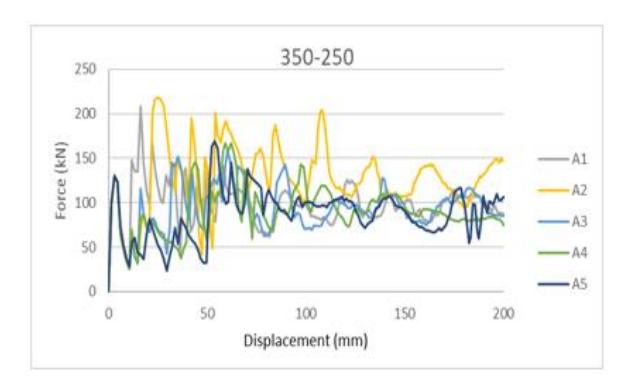
Force–displacement for bi-tubular configuration A (350-250)
Force-displacement for bi-tubular configuration B (340-260)
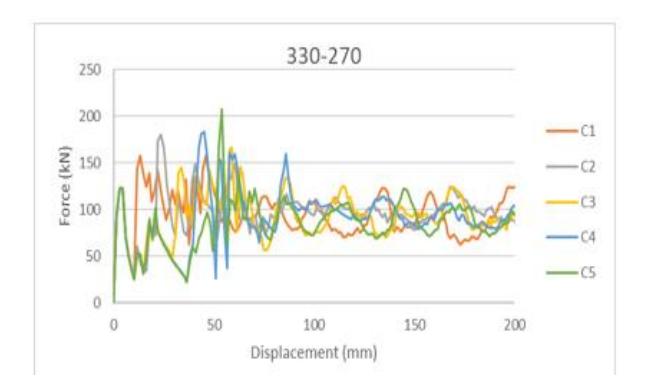
Force-displacement for bi-tubular configuration C (330-270).
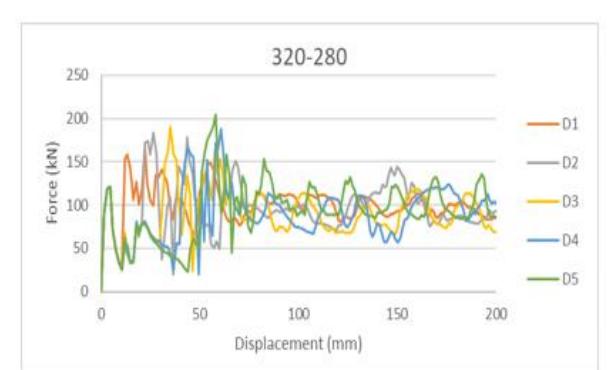
Force-displacement for bi-tubular configuration D (320-280).
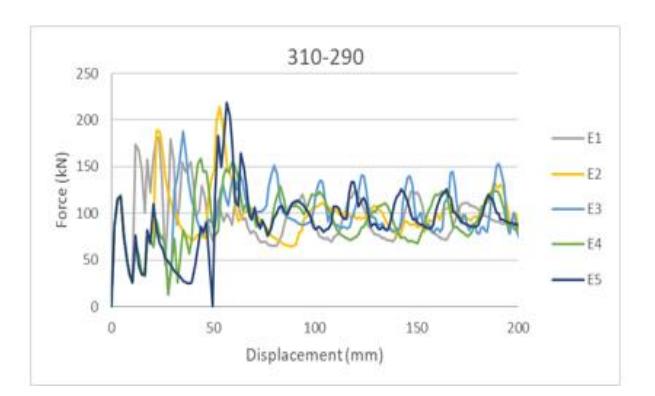
Force-displacement for bi-tubular configuration E (310-290).
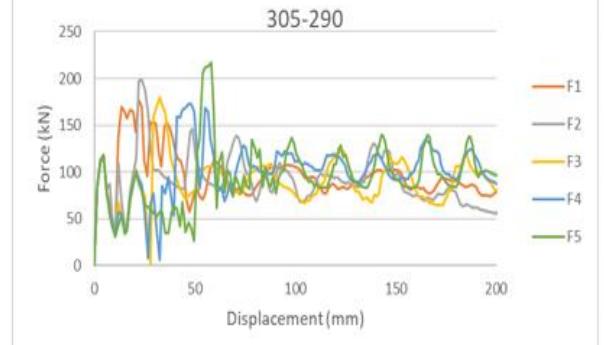
Force-displacement for bi-tubular configuration F (305-295.
Figures 6-11 demonstrate that the initial peak force in each configuration decreases by more than 50% compared to both the monotube and equivalent bitubular tube. As a consequence, the deceleration experienced by the car occupants will also be reduced in line with the lower peak force, resulting in a reduced risk to occupants during a collision. The significant reduction in the initial peak force highlights the effectiveness of the proposed bitubular design in enhancing safety and mitigating the potential risks to occupants in the event of a crash.
Selection of best specimen
Among all 36 bitubular specimens studied listed in Table 2, one cannot straightforwardly select the best specimen as an energy absorber. The highest performing specimen was chosen at each perimeter, resulting in six specimens (A3, B3, C1, D1, E4 and F4).
Table 2 Specifications of the monotubal and different bitubular configurations.
| Sample | Ро | Pi | Lo | Li | Initial force | Pmax | CFE | Mass |
|---|---|---|---|---|---|---|---|---|
| Jampic | (mm) | (mm) | (mm) | (mm) | (kN) | (kN) | (kg) | |
| Monotube | 300 | 350 | 270 | 270 | 0.52 | 1.649 | ||
| Α | 350 | 250 | 350 | 350 | 224 | 224 | 0.43 | 1.649 |
| A1 | 350 | 250 | 350 | 340 | 131 | 208 | 0.48 | 1.629 |
| A2 | 350 | 250 | 350 | 330 | 131 | 164 | 0.61 | 1.609 |
| A3 | 350 | 250 | 350 | 320 | 130 | 159 | 0.60 | 1.59 |
| A4 | 350 | 250 | 350 | 310 | 131 | 167 | 0.55 | 1.57 |
| A5 | 350 | 250 | 350 | 300 | 130 | 169 | 0.52 | 1.55 |
| В | 340 | 260 | 350 | 350 | 229 | 229 | 0.44 | 1.567 |
| B1 | 340 | 260 | 350 | 340 | 126 | 201 | 0.47 | 1.628 |
| B2 | 340 | 260 | 350 | 330 | 126 | 176 | 0.54 | 1.608 |
| В3 | 340 | 260 | 350 | 320 | 127 | 152 | 0.62 | 1.587 |
| B4 | 340 | 260 | 350 | 310 | 127 | 187 | 0.47 | 1.567 |
| B5 | 340 | 260 | 350 | 300 | 126 | 174 | 0.56 | 1.546 |
| С | 330 | 270 | 350 | 350 | 233 | 233 | 0.43 | 1.649 |
| C1 | 330 | 270 | 350 | 340 | 123 | 158 | 0.60 | 1.627 |
| C2 | 330 | 270 | 350 | 330 | 123 | 180 | 0.54 | 1.606 |
| C3 | 330 | 270 | 350 | 320 | 123 | 166 | 0.56 | 1.585 |
| C4 | 330 | 270 | 350 | 310 | 123 | 183 | 0.51 | 1.564 |
| C5 | 330 | 270 | 350 | 300 | 123 | 207 | 0.41 | 1.543 |
| D | 320 | 280 | 350 | 350 | 234 | 234 | 0.43 | 1.649 |
| D1 | 320 | 280 | 350 | 340 | 120 | 167 | 0.60 | 1.627 |
| D2 | 320 | 280 | 350 | 330 | 120 | 184 | 0.53 | 1.605 |
| D3 | 320 | 280 | 350 | 320 | 121 | 190 | 0.48 | 1.583 |
| D4 | 320 | 280 | 350 | 310 | 120 | 188 | 0.49 | 1.561 |
| D5 | 320 | 280 | 350 | 300 | 121 | 204 | 0.47 | 1.539 |
| E | 310 | 290 | 350 | 350 | 235 | 235 | 0.44 | 1.649 |
| E1 | 310 | 290 | 350 | 340 | 119 | 182 | 0.54 | 1.626 |
| E2 | 310 | 290 | 350 | 330 | 120 | 214 | 0.46 | 1.603 |
| E3 | 310 | 290 | 350 | 320 | 120 | 188 | 0.53 | 1.58 |
| E4 | 310 | 290 | 350 | 310 | 119 | 159 | 0.60 | 1.557 |
| E5 | 310 | 290 | 350 | 300 | 118 | 219 | 0.43 | 1.535 |
| F | 305 | 295 | 350 | 350 | 235 | 235 | 0.42 | 1.649 |
| F1 | 305 | 295 | 350 | 340 | 118 | 177 | 0.54 | 1.625 |
| F2 | 305 | 295 | 350 | 330 | 116 | 198 | 0.56 | 1.602 |
| F3 | 305 | 295 | 350 | 320 | 117 | 180 | 0.5 | 1.579 |
| F4 | 305 | 295 | 350 | 310 | 118 | 173 | 0.59 | 1.556 |
| F5 | 305 | 295 | 350 | 300 | 118 | 217 | 0.44 | 1.533 |
where:
Po: outer tube perimeter Pi: inner tube perimeter Lo: outer tube length
Li: inner tube length
The multi-criteria decision-making (MCDM) process and the complex proportional assessment method (COPRAS) were used to choose the optimal specimen from among the monotubular and the six chosen bitubular specimens (A3, B3, C1, D1, E4 and F4). COPRAS as a method was originally proposed by Kaklauskas (Kaklauskas et al., 2006), and is designed to allow for the optimal decision considering the ideal and the least-preferred solutions. COPRAS is well explained in refs.(S. Abdulqadir et al., 2021; Davies et al., n.d.; Kaklauskas et al., 2006). The six initially chosen specimens represent the lowest peak force and highest CFE for each configuration. Tables 3-7 represent the procedures for the selection of the optimal specimen.
Table 3 Weightage setting for each performance indicator.
| Performance | Runs, N¼n(n−1)/2 (n¼number of performance indicators) | |||||||||||
|---|---|---|---|---|---|---|---|---|---|---|---|---|
| indicators | 1 | 2 | 3 | 4 | 5 | 6 | 7 | 8 | 9 | 10 | ∑ | ∑/E |
| % P reduction | 3 | 3 | 3 | 3 | 12 | 0.3 | ||||||
| CFE | 1 | 3 | 3 | 3 | 10 | 0.25 | ||||||
| E | 1 | 1 | 3 | 3 | 8 | 0.2 | ||||||
| P | 1 | 1 | 1 | 3 | 6 | 0.15 | ||||||
| Mass | 1 | 1 | 1 | 1 | 4 | 0.1 | ||||||
| E= 40 | 1 |
Table 4 Data of performance indicators in a decision matrix.
| 0.3 | 0.25 | 0.2 | 0.15 | 0.1 | |
| Specimen | % P reduction | CFE | E | P | Mass |
| Monotube | 0.00 | 0.52 | 30 | 270 | 1.65 |
| A3 | 0.41 | 0.60 | 18.5 | 159 | 1.59 |
| B3 | 0.44 | 0.62 | 18.1 | 152 | 1.59 |
| C1 | 0.41 | 0.60 | 18.7 | 158 | 1.63 |
| D1 | 0.38 | 0.60 | 19.8 | 167 | 1.63 |
| E4 | 0.41 | 0.60 | 18.2 | 159 | 1.56 |
| F4 | 0.36 | 0.59 | 19.7 | 173 | 1.56 |
Table 5 Weighted normalized decision matrix.
| % P reduction | CFE | E | P | Mass | |
|---|---|---|---|---|---|
| Monotube | 0 | 0.031476998 | 0.041958042 | 0.03271 | 0.0147285 |
| A3 | 0.051058994 | 0.036319613 | 0.025874126 | 0.01926 | 0.0142022 |
| B3 | 0.054274477 | 0.037530266 | 0.025314685 | 0.01842 | 0.0141817 |
| C1 | 0.051517284 | 0.036319613 | 0.026153846 | 0.01914 | 0.0145391 |
| D1 | 0.047379011 | 0.036319613 | 0.027692308 | 0.02023 | 0.0145319 |
| E4 | 0.051058994 | 0.036319613 | 0.025454545 | 0.01926 | 0.0139146 |
| F4 | 0.04471124 | 0.035714286 | 0.027552448 | 0.02096 | 0.013902 |
Table 6 Sums of the weighted normalized values.
| Beneficial | Non-Beneficial | ||||||
|---|---|---|---|---|---|---|---|
| Specimen | si+ | si | |||||
| Monotube | 0.031476998 | 0.0894 | 0.6477942 | ||||
| A3 | 0.087378607 | 0.05934 | 0.9759336 | ||||
| B3 | 0.091804744 | 0.05791 | 1 | ||||
| C1 | 0.087836897 | 0.05984 | 0.9678539 | ||||
| D1 | 0.083698623 | 0.06246 0.9272268 | |||||
| E4 | 0.087378607 | 0.05863 | 0.9877058 | ||||
| F4 | 0.080425526 | 0.06242 | 0.9278621 | ||||
| ∑si+ | 0.55 | 0.45 | 6.4343763 | ||||
Table 7 Qi and Ui values.
| Specimen | Q | U | |
|---|---|---|---|
| Monotube | 0.076781684 | 47.471824 | 7 |
| A3 | 0.155632326 | 96.222823 | 3 |
| B3 | 0.161741592 | 100 | 1 |
| C1 | 0.155525545 | 96.156804 | 4 |
| D1 | 0.148545945 | 91.841526 | 5 |
| E4 | 0.156455633 | 96.73185 | 2 |
| F4 | 0.145317275 | 89.845335 | 6 |
| 1 |
The COPRAS process demonstrated that specimen B3, with an outer perimeter of 340 mm and an inner perimeter of 260 mm, an outer length of 350 mm and inner length of 320 mm, and a wall thickness of 1 mm for each tube, was the optimal specimen.
Splitting and combining the proposed specimen
The outer and inner tubes were independently subjected to an axial dynamic load, the results from which were compared with the bitubular tube, as shown in Figure 12.
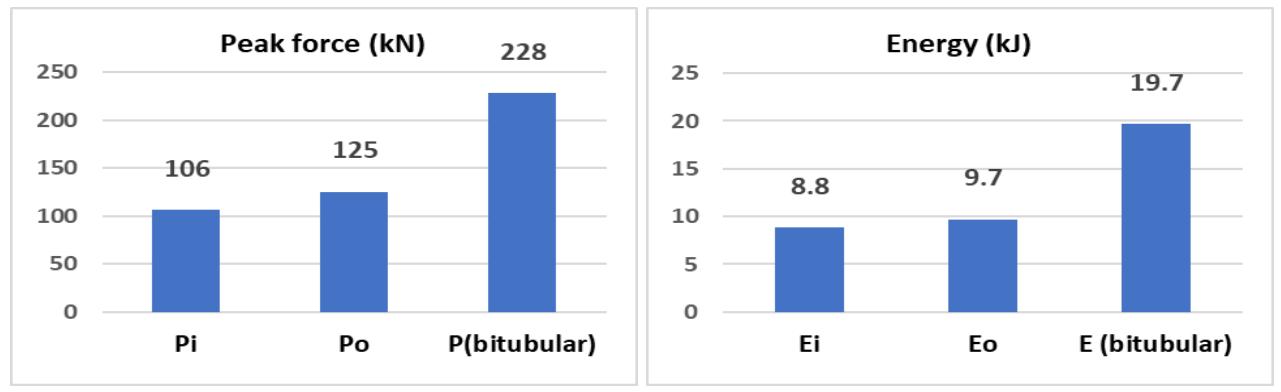
Initial peak force (left), Energy absorption (right).
The results verified that the initial crushing force of the bitubular tubes is nearly identical to the sum of each individual tube. However, the energy absorption of the bitubular tubes is 6% higher than the sum of each; this can be attributed to the friction and interaction between the tubes during deformation. When the outer and inner tubes are compressed independently, their deformation modes collapse in a diamond and Euler mode. In contrast, the bitubular configuration exhibits a more stable diamond mode during the collapse, leading to higher energy absorption and more regular folds, as depicted in Figure 13.
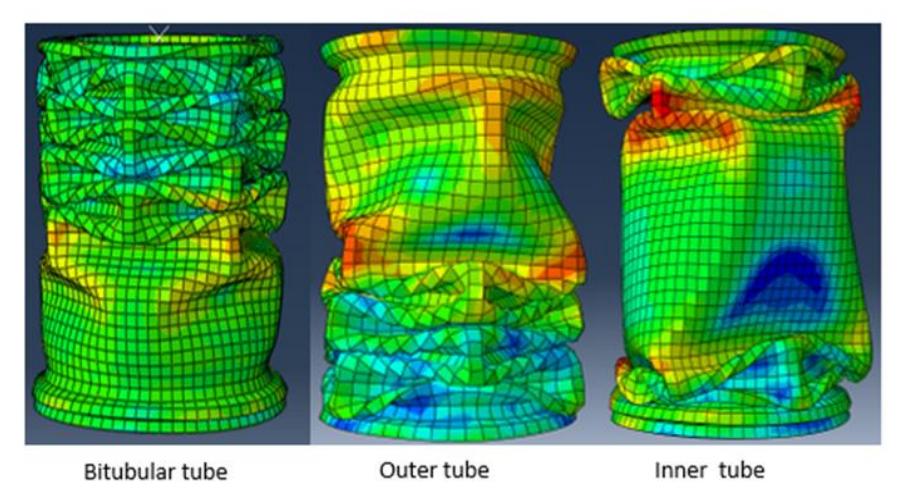
Deformation mode of the bitubular specimen, and outer and inner tube individually.
In general, the bitubular structures demonstrated a significant decrease in the initial crushing force (13-17%) for all tubular configurations when compared to the monotube structure, although this nevertheless remains somewhat high. To achieve further reduction in the initial crushing force, a bitubular structure with different lengths was proposed. As a result, all the bitubular configurations exhibited a substantial reduction in initial peak force. When comparing the maximum force of the monotube or equivalent bitubular with the shortened bitubular configurations, it becomes evident that the maximum force is achieved when the inner tube is 10 mm shorter than the outer, especially in cases A and B (350-250 and 340-260). This is because the collapse of the outer (longer) tube initiates first, and the first fold then starts to form. Before the first fold has fully developed, however, the striker reaches the shorter (inner) tube, and the first inner tube fold begins to form. The combination of forces from both the outer and inner tubes contribute to the maximum load.
As the clearance between tubes decreases in configurations C, D, E, and F, the initial force decreases slightly. However, the maximum force in this type of configuration is observed when the inner tube is shortened to 300 mm (50 mm less than normal). In this scenario, when the striker hits the outer tube, two folds have already formed, and as the striker reaches the inner tube the force needed to form the third fold combines with the force required to form the first fold of the inner tube. This results in a higher force, as depicted in Figures 8-11.
Effect of structure wall thickness
In the selected specimen, both the inner and outer tube thicknesses were modified, and the overall thickness of the structure was varied from 0.5 mm to 2.5 mm by increasing both the inner and outer tube thicknesses equally. The results indicated that the peak force followed an almost linear increase with structure thickness, which can be attributed to the corresponding increase in the structure's stiffness.
Additionally, the CFE also demonstrated an increase in the thickness due to an enhancement in the deformation mode. However, the CFE reached a plateau beyond a wall thickness of 2 mm. This can be attributed to the increase in structure stiffness, which limits any further improvement in the CFE, as shown in Figure 14.
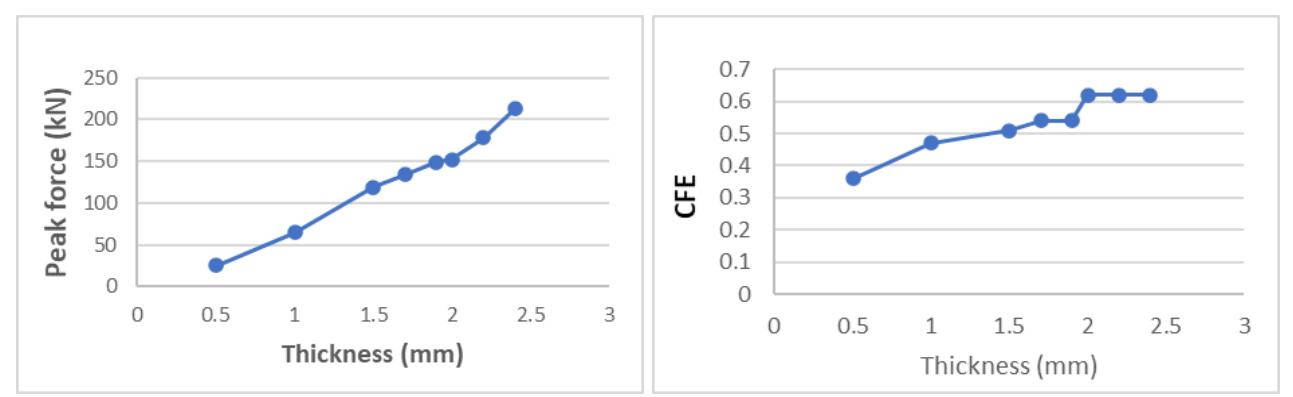
Effect of bitubular tube thickness on the peak force (left) and CFE (right).
Further investigation has been undertaken for the selected specimen by changing the inner and outer tube thicknesses independently. As a result, the thicknesses of each of the tubes has been changed as per Table 8.
| Table 8 | Effect of bitubular wall thickness on the candidate specimen |
|---|---|
| Specimen name | 𝒕𝒐(mm) | 𝒕𝒊 (mm) | 𝑷𝒎𝒂𝒙 (kN) | CFE | Mass (kg) |
|---|---|---|---|---|---|
| T1 | 0.25 | 1.75 | 212 | 0.51 | 1.38 |
| T2 | 0.5 | 1.5 | 184 | 0.59 | 1.45 |
| T3 | 0.75 | 1.25 | 183 | 0.55 | 1.52 |
| Proposed | 1 | 1 | 152 | 0.62 | 1.59 |
| T4 | 1.25 | 0.75 | 196 | 0.53 | 1.66 |
| T5 | 1.5 | 0.5 | 213 | 0.54 | 1.73 |
| T6 | 1.75 | 0.25 | 252 | 0.52 | 1.80 |
where:
: outer tube thickness
: inner tube thickness
As presented in Table 8, the outer tube thickness was increased from its lowest value of 0.25 mm, while simultaneously decreasing the inner tube thickness from its highest value of 1.75 mm and vice versa, all while maintaining the overall specimen structure thickness at 2 mm, consistent with the selected specimen. The overall structure thickness was kept the same as the monotube specimen for comparison.
From the data in Table 8, it can be observed that the peak force increased as the wall thickness gap between the inner and outer tube structure widened, and vice versa. The specimen with the highest peak force value was T6, which can be attributed to the significant wall thickness gap between the outer and inner tubes, leading to increased tube stiffness due to the increased tube mass.
In contrast, the proposed specimen exhibits superior structural performance by demonstrating the highest CFE and the lowest peak force. This can be attributed to the fact that both the inner and outer tube thicknesses are identical, and the tube wall thickness difference is at its lowest in this configuration.
Reverse lengths of the proposed structure
In this section, the effect of shortening the outer tube length of the proposed specimen will be studied by maintaining the inner tube length at 350 mm, inner perimeter at 260 mm, outer perimeter at 340 mm and both tube thicknesses at 1 mm each, the numerical results for which are listed in Table 9.
| Specimen name | 𝐋𝐨(mm) | 𝐋𝐢 (mm) | 𝐏𝐦𝐚𝐱 (kN) | CFE | Mass (kg) | |
|---|---|---|---|---|---|---|
| R1 | 350 | 350 | 229 | 0.44 | 1.65 | |
| R2 | 340 | 350 | 220 | 0.44 | 1.62 | |
| R3 | 330 | 350 | 202 | 0.47 | 1.6 | |
| R4 | 320 | 350 | 218 | 0.42 | 1.57 | |
| R5 | 310 | 350 | 178 | 0.52 | 1.54 | |
| R6 | 300 | 350 | 174 | 0.53 | 1.52 | |
| Proposed | 350 | 320 | 152 | 0.62 | 1.59 | |
Table 9.Effect of reversing the candidate bitubular tube length
From Table 9, the data for each specimen reveals a reduced performance compared to the proposed specimen since the latter has the lowest peak force and highest CFE; accordingly, the candidate specimen is still considered the optimal choice.
Bi-tubal vs monotubal structure
The use of the bitubular specimen offered the benefit of a low peak force (127 kN) during the early stages of a collision, resulting in a dynamic load that was 53% lower than that of the monotubal specimen (270 kN). This reduction plays a crucial role in minimizing the risk of exerting higher forces on car occupants, thereby enhancing overall safety and reducing the potential for morbidity and mortality resulting from car collisions.
Additionally, the selected bitubular design demonstrated a maximum crushing force of 152 kN, which occurred after the striker impacted the shorter tube at 52.1 mm. Therefore, it can be concluded that the proposed bitubular design offers improved crashworthiness for car structures, presenting a safer design that exhibits a lower initial peak force and higher Crush Force Efficiency (CFE).
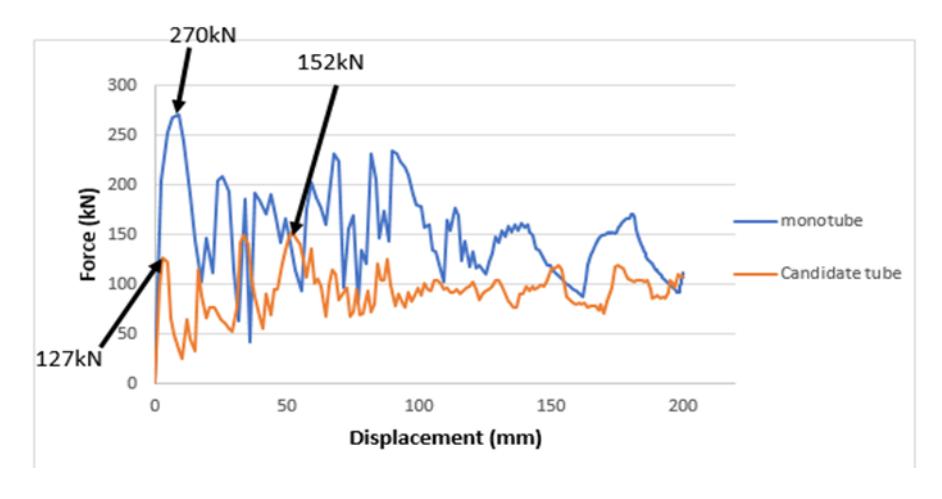
Monotubal versus proposed optimal bitubular specimen.
Validation of finite element
The finite element (FE) model of indirect dynamic loading was validated by comparing the experimental results of Aljawi et al. (Aljawi & Asiri, 2004) with the predicting model. The square tube with dimensions of 50 × 50 mm, a length of 150 mm, and a thickness of 1.25 mm was subjected to an axial impact load. Figure 16 shows the experimental loaddisplacement curve determined by Aljawi et al., whilst Figure 17 shows the finite element versus experimental results.
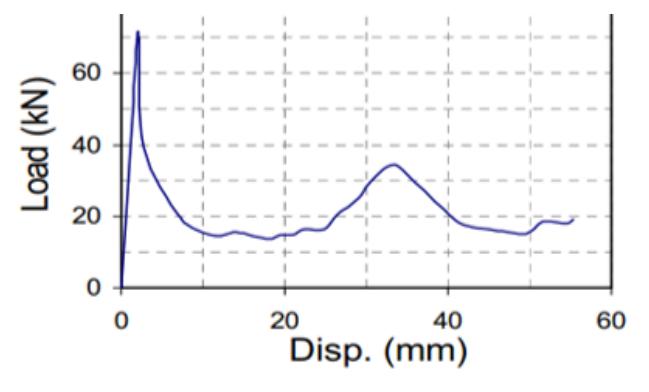
Experimental load-displacement of the square tube (Aljawi & Asiri, 2004)
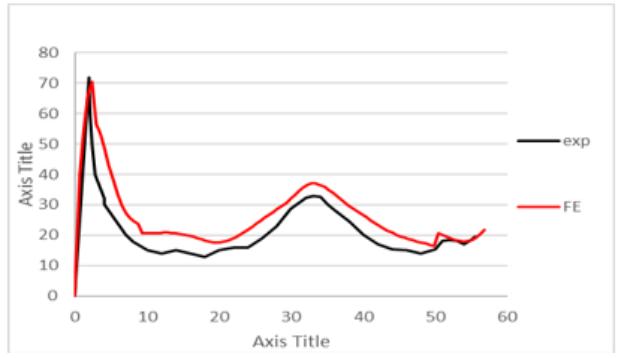
FE vs experimental of the square tube.
The experimental properties of the tube are reported in Table 9. The FE results are used for comparison to verify the experimental results.
Table 9 Material specifications used in the experiment.
| Material | Steel |
|---|---|
| Length (mm) | 150 |
| Dimensions (mm) | (50*50) |
| Thickness (mm) | 1.25 |
| Velocity (m/s) | 9.4 |
| Mass (kg) | 100 |
It is clear that the FE results are in good agreement with the experimental, and indeed even the behavior of the curves is essentially identical. The finite element experimental results are reported in Table 10.
Table 10 Comparison of experimental and numerical results in direct loading.
| Parameter | Experimental | FE | Difference (%) |
|---|---|---|---|
| Mean load(kN) | 21 | 22.3 | 5.8 |
| Peak load (KN) | 72 | 70 | 2.8 |
Conclusion
A numerical study was conducted on a bitubular (concentric) circular tube, comparing it with an equivalent monotube design. The monotube had a perimeter of 300 mm, a thickness of 2 mm, and a length of 350 mm. Various configurations were tested based on the perimeters of the bitubular tubes.
The study initially used an outer tube perimeter of 350 mm and an inner tube perimeter of 250 mm (350-250). The outer perimeter was then reduced by 10 mm while simultaneously increasing the inner tube perimeter by the same amount. This was continued until the (310-290) configuration was reached. The final test configuration was (305-295). The bitubular tube with an outer perimeter of 340 mm, an inner perimeter of 260 mm, an inner tube length of 320 mm, and a wall thickness of 1 mm for both the outer and inner tubes was determined to be the optimal specimen using the COPRAS method. The study was further enhanced by incorporating different lengths of the inner tube, namely 350 mm, 340 mm, 330 mm, 320 mm, 310 mm, and 300 mm. In addition to the monotube specimen, six specimens were selected
based on the criteria of the lowest peak force and highest CFE. The optimal specimen was determined using the COPRAS method.
A subsequent investigation was conducted on the selected profile, initially by varying the overall thickness while maintaining identical measurements for both tubes. Another aspect of the study involved maintaining an overall thickness of 2 mm while altering the thicknesses of the inner and outer tubes. Additionally, the study explored the effects of shortening the length of the outer tube instead of the inner tube. Based on these investigations, the study arrived at the following conclusions:
Regarding energy absorption and crushing force, bitubular specimens demonstrate values nearly equivalent to the combined sum of individual tubes. However, individual tubes tend to exhibit more irregular folding patterns and fluctuations in force-displacement behavior. Among the tested specimens, the bitubular configuration (B3), with an outer perimeter of 340 mm, an inner perimeter of 260 mm, and an inner tube length of 320 mm, was identified as the best-performing design based on the COPRAS method. This specimen achieved a peak force of 152 kN, which corresponds to only 56% of the peak force observed in the monotubal specimen.
Moreover, the CFE of the selected bitubular specimen showed a 19% improvement over the monotubal specimen. This enhancement was attributed to the smoother wave pattern and more regular deformation mode, as illustrated in Figures 15 and 5. Furthermore, the selected specimen exhibited a 3.7% reduction in mass compared to its monotubal counterpart. It was also observed that higher peak forces occurred in bitubular structures when there was a substantial thickness difference between the inner and outer tubes, while reducing this thickness difference led to a decrease in peak force. The best crashworthiness performance was achieved when both the inner and outer tube walls had the same thickness of 1 mm.
Finally, the study found that shortening the outer tube instead of the inner tube did not contribute to an improvement in crashworthiness performance. These findings provide valuable insights into optimizing bitubular tube structures for enhanced energy absorption and impact resistance.
Compliance with ethics guidelines
The authors declare they have no conflict of interest or financial conflicts to disclose.
This article contains no studies with human or animal subjects performed by authors.