
Introduction
Biodegradable plastics, particularly those made from polylactic acid (PLA), have significant market potential in addressing environmental pollution caused by plastic waste. PLA is typically produced from lactic acid through condensation polymerization, where the hydroxyl group of one lactic acid molecule forms an ester bond with the carboxyl group of a neighboring lactic acid molecule, releasing water (Figure 1). This process makes PLA a more environmentally friendly alternative compared to the petroleum-based plastics such as polypropylene (PP), polystyrene (PS), and polyvinyl chloride (PVC). Moreover, the biodegradability of PLA has been highlighted by Fukushima et al. (2009).
\[\text{[rumus tidak dapat ditampilkan dengan baik — lihat PDF asli]}\]
Polymerization of lactic acid into polylactic acid (Sin and Tueen, 2019).
Lactic acid is a key platform molecule in the bio-based chemical industry due to its numerous economically beneficial derivatives (Fukushima et al., 2009). Sudarmo (2015) explains that lactic acid can be produced from renewable resources, such as glucose, which is abundant in nature. Glucose serves as the sole monomer of cellulose, which constitutes 40 – 60% of lignocellulose, the structural material of plants. Additionally, lactic acid can be formed from glucose through glycolysis, a biochemical process that breaks down glucose into three-carbon compounds while
generating energy (Blanco and Blanco, 2017; McKee and McKee, 2019). These references describe the first stage of glycolysis, which involves five reactions in which glucose is phosphorylated twice and then split into two molecules of glyceraldehyde 3-phosphate. Furthermore, lactic acid is a functional group isomer, sharing the same molecular formula (C3H6O3) with dihydroxyacetone and glyceraldehyde, as shown in Figure 2. When comparing these three compounds to glucose, which has the molecular formula C6H12O6, we see that (C6H12O6 = 2 C3H6O3); thus, all three are indeed products of the breakdown of glucose.
Structure of lactic acid, dihydroxyacetone, and glyceraldehyde (DeMan et al., 2018).
Nowadays, lactic acid—produced through either chemical synthesis or microbial fermentation—is priced between $1,140 and $1,590 per metric ton, according to a 2023 report by Chemanalyst. Batch fermentation typically takes three to six days (Sin and Tueen, 2019) and requires a pH of 3.78 or lower (Abedi and Hashemi, 2020). These conditions lead to longer production times, higher costs for corrosion-resistant equipment, and increased expenses for product recovery. Additionally, the fermentation process requires complex nutrients (Abedi and Hashemi, 2020), which further drive up production costs. This positions lactic acid as a "commodity chemical sleeping giant", highlighting its potential for widespread industrial use (Fukushima et al., 2009). However, its high price hinders realization and affects the cost of polylactic acid. Consequently, its promise as an environmentally friendly packaging material remains unfulfilled due to competition from cheaper, non-biodegradable alternatives. This situation underscores the need for more costeffective production methods.
Other researchers, including Feliczak-Guzik et al. (2018); Hossain et al. (2021); and Jolimaitre et al. (2018), have investigated the later stages of glucose glycolysis, particularly the isomerization of dihydroxyacetone to lactic acid. However, there have been no comprehensive studies on the initial stages of glucose glycolysis, specifically the conversion of glucose into dihydroxyacetone and glyceraldehyde using biomimetic metal-organic catalysts. Most previous research has focused on synthesizing dihydroxyacetone from glucose using microorganisms. For example, Jojima et al. (2012) achieved a glucose conversion of 77% using Corynebacterium glutamicum at pH 7.5 and 33°C over 48 hours. Jain et al. (2016) reported that engineered Escherichia coli could achieve over 70% conversion at pH 7.2 and 37°C for 40 hours. Additionally, Sun et al. (2021) found that Klebsiella pneumoniae reached 98% glucose conversion at pH 6 and 37°C over 91 hours. However, these microbial processes take considerably longer compared to this study, which achieved nearly 60% glucose conversion in just 6 hours. Furthermore, studies on synthesizing dihydroxyacetone using biomimetic catalysts remain limited. To the authors' knowledge, existing research on the catalytic conversion of dihydroxyacetone has primarily focused on breaking down fructose using zwitterionic catalysts (HIDA), which achieved a fructose conversion of 60%, as reported by Jing et al. (2020).
Numerous experimental results have been reported by Solomons et al. (2004); Bhosale et al. (1996); Bommarius and Riebel (2004); as well as Blacklow et al. (1988). An examination of the enzymes involved in the first stage of glycolysis reveals that the active sites contain specific amino acid residues: glutamate and histidine in phosphoglucose isomerase (Solomons et al., 2004); aspartate and histidine in glucose isomerase (Bhosale et al., 1996); aspartate or glutamate and histidine in aldolase (Bommarius and Riebel, 2004); and glutamate and histidine in triose phosphate isomerase (Blacklow et al., 1988). Therefore, it is essential to incorporate monosodium glutamate or monoammonium glutamate (both of which are easier to obtain than monosodium aspartate or monoammonium aspartate) along with imidazole, which represents the free end of the histidine residue (Parvin and Kalant, 1973), into the catalyst formulation of the tripolyphosphate solution.
According to Blanco and Blanco (2017); McKee and McKee (2019), the metal ions that are important in the enzymatic conversion of glucose to dihydroxyacetone phosphate and glyceraldehyde 3-phosphate include Mg2+ (and sometimes
Mn2+) in the conversion of glucose to fructose 1,6-bisphosphate and Zn2+ in the breakdown of fructose 1,6-bisphosphate. Based on experiment by Jin et al. (2013); Sechi and Marques (2017); Sugih et al. (2019), and considering that carbohydrate phosphorylation can apparently be carried out with sodium tripolyphosphate, it follows that Mg (or Mn(II)) and Zn tripolyphosphate should also be used as biomimetic catalysts in conversion of glucose to dihydroxyacetone and glyceraldehyde. Bobtelsky and Kertes (1954, 1955) explain that Mg and Zn tripolyphosphate [M5(P3O10)2, M = Mg, Zn] can dissolve in water as the complex compound Na3+[MP3O10] 3- . Experiments conducted by Guppy et al. (1992) indicate that the best pH for the glycolysis reaction is around 8. Hence, the biomimetic catalyst used in our experiments is a metal-organic compound that combines Mg-Zn tripolyphosphate with imidazole and monosodium or monoammonium glutamate, with the reaction conditions set at pH 8. Under nearly neutral pH conditions, there is no need for corrosion-resistant equipment, which can help reduce costs.
Based on Gibbs free energy of formation data compiled by Jankowski et al. (2008), the change in Gibbs free energy for the reaction shown in Eq. (1):
\[C_6H_{12}O_6\] \(\rightleftharpoons\) \(C_3H_6O_3\) + \(C_3H_6O_3\) (1) Glucose Dihydroxyacetone Glyceraldehyde is G o ' = (-108,16) + (-106,70) – (-218,28) = +3,42 kkal/mol = +14,31 kJ/mol. This reaction is endergonic, indicating that if dihydroxyacetone or glyceraldehyde is the desired main product, an effective strategy is needed to address the low product yield, as the equilibrium is heavily skewed toward the glucose reactant. A promising approach involves introducing a second liquid phase that is immiscible with the first liquid phase (reaction phase). This second phase allows the reaction products to partition into it while retaining glucose in the first liquid. By removing dihydroxyacetone and glyceraldehyde from the reaction mixture, the equilibrium shifts toward the product side, thereby increasing the conversion of glucose.
A literature search regarding the use of two immiscible liquids reveals that acetonitrile (CH3CN, normal boiling point 82°C) is completely miscible with water. However, Wang et al. (2008) report that when glucose, fructose, xylose, and similar sugars are dissolved in a 50%-v acetonitrile aqueous solution, two liquid phases form. The upper phase, which is lighter, consists of acetonitrile that dissolves some water and a small amount of monosaccharide. The lower phase, which is heavier, contains the aquatic phase that dissolves most monosaccharides along with some acetonitrile. Dhamole et al. (2010) and Cardoso et al. (2013) confirm this phenomenon across various temperatures and monosaccharide concentrations. Imbault et al. (2020) demonstrate that acetonitrile can effectively serve as a solvent for dihydroxyacetone, finding that photocatalytic oxidation of glycerol in acetonitrile yields higher conversion and selectivity compared to water. Moreover, Vilonen et al. (2004) conclude that in a 50%-v acetone aqueous solution, the isomerization of glucose to fructose (catalyzed by xylose isomerase) exhibits a higher reaction rate and equilibrium concentration of fructose than in water. According to Arcos et al. (1998), acetone, like acetonitrile, is a poor solvent for glucose, and Xie et al. (2015) observe sugaring-out effects of glucose in an (acetone + 1-butanol + ethanol) (ABE) solution. Therefore, the reaction medium for the experiment will consist of a mixture of water–acetonitrile or a combination of water–acetonitrile–acetone.
To address the research gap, this exploratory study tested homogeneous biomimetic metal-organic catalysts composed of Mg-Zn tripolyphosphate combined with imidazole and monosodium or monoammonium glutamate at various concentrations, types, and reaction temperatures. The goal was to determine their effectiveness in converting glucose into dihydroxyacetone and glyceraldehyde. Before catalyst testing, either water–acetonitrile or water–acetonitrile– acetone solutions were selected as the reaction medium based on their ability to produce phase separation. Glyceraldehyde and aldose analyses were conducted to quantify glucose and glyceraldehyde levels. Additionally, the results were validated by calculating errors in the aldose analysis and performing qualitative tests to confirm the presence of dihydroxyacetone.
Experimental Section
Materials
In carrying out this study, several materials were used, such as aquadest, acetonitrile (Merck), and acetone (CV Mekar Pancaraya, Bandung) as part of the reaction medium, and glucose (Merck) as the reactant. The materials for synthesizing the biomimetic catalysts included sodium tripolyphosphate (PT Bratacho, Bandung), ammonia (CV Mekar Pancaraya,
Bandung), reagent-grade imidazole, H2SO4, MgCl2.6H2O, and ZnCl2 from Merck, as well as monosodium glutamate (MSG) from the local brand Ajinomoto. The pH of the reaction medium was adjusted using a phosphate buffer made from monobasic and dibasic sodium phosphate (PT Brataco, Bandung), following the guidelines in the Safety Data Sheet from Thermo Fisher Scientific Chemicals, Inc (2024).
Determination of Reaction Medium
Mixtures of water, acetonitrile, and acetone were prepared with the following compositions: 50%-v water – 50%-v acetonitrile; 50%-v water – 25%-v acetonitrile – 25%-v acetone; 35%-v water – 35%-v acetonitrile – 30%-v acetone; 60% v water – 20%-v acetonitrile – 20%-v acetone; and 40%-v water – 30%-v acetonitrile – 30%-v acetone. Each mixture was made to a total volume of 100 mL, into which 20 grams of glucose were dissolved at room temperature. The mixtures were then cooled to 1°C to observe phase separation (Wang et al., 2008; Xie et al., 2015).
Preparation of Monoammonium Glutamate
First, glutamic acid was made through a precipitation reaction by dissolving 7.5 grams of MSG in 30 mL of distilled water in an Erlenmeyer flask. Then, 11 mL of 2M H2SO4 was added at room temperature. After shaking the mixture thoroughly, the flask was sealed until the glutamic acid crystals settled. The crystals were filtered and washed twice with 10 mL of distilled water each time. Subsequently, they were left to dry on a filter and further dried in an oven at 105oC until a constant weight was achieved. Next, to make monoammonium glutamate monohydrate (C5H12N2O4.H2O), 4.414 grams (0.03 mol) of glutamic acid were dissolved in 30 mL of 1 N ammonia solution. The solution was then evaporated by slow boiling until solid crystals began to form. The process continued at room temperature until the crystals were dry and a constant weight was achieved.
Preparation of Mg (or Zn) Tripolyphosphate
To prepare magnesium tripolyphosphate [Mg5(P3O10)2], 5.08 grams (0.025 mol) of MgCl2.6H2O were dissolved in 50 mL of distilled water at room temperature until a clear solution without solids was formed. This solution was then added slowly to a stirred solution of 3.68 grams (0.01 mol) Na5P3O10 in 50 mL of distilled water, and stirring continued for an additional 5 minutes. The resulting Mg5(P3O10)2 precipitate was filtered, washed five times with 20 mL of distilled water each time, and dried in an oven at 105oC until the weight was constant. To make zinc tripolyphosphate [Zn5(P3O10)2], 0.025 mol of ZnCl2 was used instead of 0.05 mol of MgCl2.6H2O, following the same procedure.
Preparation of Catalyst Solution
The formation of a catalyst solution with ammonium as a glutamate ion pair began by dissolving 2.44 grams of Na5P3O10 in 50 mL of distilled water in a 150 mL beaker to create a clear solution at room temperature. While stirring, 0.70 grams of [Mg5(P3O10)2] and 0.925 grams of [Zn5(P3O10)2] were added. To assist in dissolving the magnesium and zinc tripolyphosphate, Na5P3O10 was gradually added until a clear solution formed. Next, 0.378 grams of imidazole and 1.01 grams of (C5H12N2O4.H2O) were dissolved, and the solution was adjusted to a final volume of 100 mL by adding distilled water. Four milliliters of this solution contained Mg2+, Zn2+, imidazole, and glutamate ions at a concentration of 0.222 millimoles each. For the catalyst solution with sodium as a glutamate partner, 0.94 grams of MSG were used to replace 1.01 grams of (C5H12N2O4.H2O), following the same procedure.
Experimental Procedure
This study evaluated a range of temperatures (40oC and 90oC), catalyst concentrations (0.05%-mol, 0.2%-mol, 0.4%-mol, and 0.8%-mol with respect to the mol of glucose), and types of catalysts (monosodium glutamate and monoammonium glutamate) over a reaction time of 6 hours. The selection of 40oC was influenced by Arcos et al. (1998), who reported that the first enzymatic reaction in an aqueous buffer solution occurs at this temperature. The higher temperature of 90°C was chosen because it lies between the boiling points of acetonitrile (82°C) and water (100oC). To assess the impact of catalyst concentration, 0.05%-mol was selected to evaluate the effect of using 1 mL of catalyst solution. Higher concentrations of 0.2%-mol, 0.4%-mol, and 0.8%-mol were also tested to evaluate the impact of increasing the volume to 4 mL, 8 mL, and 16 mL, respectively. The choice of monosodium and monoammonium glutamate enabled a comparison of the effects of strong and weak bases in the reaction. The choice of a 6-hour reaction time was based on prior experiments by Jolimaitre et al. (2018), which studied the conversion of dihydroxyacetone to lactic acid in aqueous
media with metal salts. The experimental design comprised 8 main runs plus 3 additional runs, each repeated two to three times.
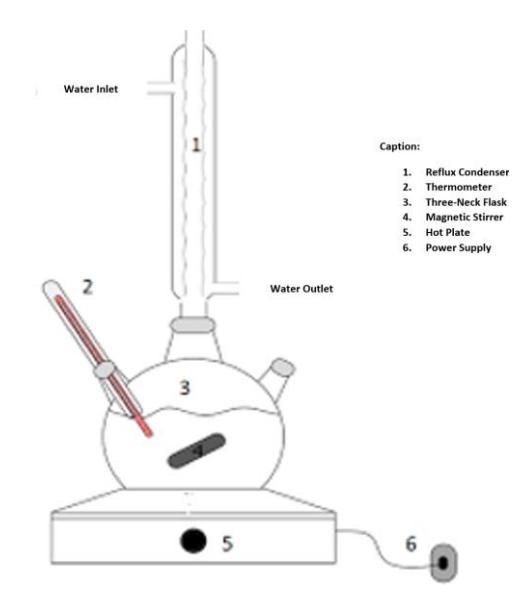
A series of experimental tools.
The experiments were conducted in a 250 mL three-neck flask equipped with a magnetic stirrer, reflux condenser, and thermometer, which were all placed on a hot plate (Figure 3). Initially, 100 mL of a 50%-v water and 50%-v acetonitrile mixture was prepared. Next, 20 grams of glucose were added and stirred into the mixture. Phosphate buffer was added to adjust the pH to 8, and the mixture was transferred to a three-neck flask. The uncatalyzed mixture was then heated to the desired reaction temperature while being continuously stirred with a magnetic stirrer. The reaction started with the addition of a specific volume of catalyst solution. After 6 hours, heating and stirring were stopped, and the reaction mixture was allowed to cool to room temperature. To clarify the phases formed, the mixture was further cooled to 1°C. Finally, the phases were separated using a separating funnel.
Analytical Methods
Aldose and glyceraldehyde analyses were carried out to calculate the amounts (in mol) of glucose and glyceraldehyde in the upper and lower phases. The dihydroxyacetone content was determined by subtracting the initial glucose concentration from the aldose concentration and glyceraldehyde concentration present in the sample. Next, the amount of glucose that reacted in each phase was calculated using a 12:8 ratio of the organic phase to the aquatic phase, as shown in the following equation (Eq. (2)):
Reacted glucose = Initial glucose – (12 x Organic phase residual glucose) – (8 x Organic phase residual glucose) (2)
Glucose conversion was determined by comparing the reacted glucose to the initial glucose amount. In addition, the quantities of glucose converted into glyceraldehyde were calculated using the same 12:8 ratio for glyceraldehyde concentration between the organic and aquatic phases. The resulting values were summed and averaged. Meanwhile, the amount of glucose converted to dihydroxyacetone was obtained by subtracting the glucose converted to glyceraldehyde from the total reacted glucose. Selectivity and yield were calculated using the following equations (Eq. (3) and (4)):
Product selectivity (%) = \[\frac{\text{Mol product is formed}}{\text{Teoritical maximum mol product}}\] (3)
Product yield = product selectivity x glucose conversion (4)
Aldose Analysis Method
Kline and Acree (1930) found that residual glucose and glyceraldehyde can be analyzed without interference from ketoses (fructose and dihydroxyacetone) using the iodometric method. The primary reaction involved is the oxidation of aldose by iodine (Eq. (5)), which can be accompanied by a side reaction (Eq. (6)):
\[C_nH_{2n+1}O_nCHO_{(aq)} + 3 NaOH_{(aq)} + I_{2 (aq)} \longrightarrow C_nH_{2n+1}O_nCOONa_{(aq)} + 2 NaI_{(aq)} + 2 H_2O_{(I)}\] (5)
\[3 I_{2 (aq)} + 6 NaOH_{(aq)} \longrightarrow NaIO_{3 (aq)} + 5 NaI_{(aq)} + 3 H_2O_{(I)}\] (6)
For the analysis, 0.1 N iodine and 0.1 N NaOH were successively added to the sample in a 2:3 ratio, using phenolphthalein as an indicator, until the yellow color of iodine and the pink color of phenolphthalein no longer faded. Iodine also reacted with NaOH to produce sodium iodate (NaIO3), which did not participate in the aldose oxidation reaction. To address this, 0.1 N HCl was added to release iodine from NaIO3 and the liberated iodine was subsequently titrated with 0.1 N sodium thiosulfate (Na2S2O3). The excess acid was then re-titrated with 0.1 N NaOH using phenolphthalein until the solution turned pink. Kline and Acree (1930) concluded that the quantities of (mL 0.1 N I2 mL 0.1 N Na2S2O3) and (mL 0.1 N NaOH - mL 0.1 N HCl) represent the amounts of 0.1 N iodine and 0.1 N NaOH used in the aldose oxidation. Moreover, for each millimole of aldose, 20 mL of 0.1 N iodine and 30 mL of 0.1 N NaOH were required for oxidation.
Glyceraldehyde Analysis Method
Glyceraldehyde concentration was determined based on a report by Balogh et al. (1975). Initially, glyceraldehyde was reacted with an excess of hydrogen sulfite. The remaining hydrogen sulfite was then titrated with a 0.1 N iodine solution using a starch indicator until the solution changed color to blue. Next, the glyceraldehyde-bisulfite compound was decomposed by adding 2.0 grams of sodium bicarbonate, and the released bisulfite (equivalent to the amount of glyceraldehyde) was titrated with the 0.1 N iodine solution. Balogh et al. (1975) determined that 1.0 mL of 0.1 N iodine solution was equivalent to 4.504 mg of glyceraldehyde.
Dihydroxyacetone Qualitative Analysis Method
The presence of dihydroxyacetone was analyzed qualitatively using the procedure described by Asnis and Brodie (1953). First, 4 mL of a 2 %-w resorcinol solution in 37% concentrated HCl was mixed with 1 mL of the sample solution in a Pyrex test tube. The tube was then incubated at 37°C for 3 hours. A color change to pink or blue indicated the presence of dihydroxyacetone, with the intensity of the color reflecting its concentration in the solution.
Results and Discussions
Determination of Reaction Medium
The goal of selecting the reaction medium is to identify a solvent that effectively separates dihydroxyacetone and glyceraldehyde from glucose. This is essential because the equilibrium reaction for the conversion of glucose into these products has a ΔG°' of +14.31 kJ/mol, which favors glucose as the reactant (Jankowski et al., 2008). Experiments using this reaction medium represent one strategy for shifting the reaction equilibrium towards the products, allowing dihydroxyacetone and glyceraldehyde to move into the second liquid phase while keeping glucose in the first phase. The choice of acetonitrile is based on its ability to dissolve dihydroxyacetone, as noted by Imbault et al. (2020), while remaining insoluble in glucose, as demonstrated by Wang et al. (2008); Dhamole et al. (2010); and Cardoso et al. (2013) on the sugaring-out effect in the acetonitrile-water system. Thus, the selected reaction medium is a 50%-v water and 50%-v acetonitrile. In this mixture, acetonitrile acts as the hydrogen bond acceptor, while water serves as the donor. The hydrogen bonds formed between them are weaker than those between water and glucose, which has multiple hydroxyl groups that can both donate and accept hydrogen bonds. Additionally, a mixture of 35%-v water – 35%-v acetonitrile – 30%-v acetone is considered based on findings by Arcos et al. (1998) and Vilonen et al. (2004), which show that acetone is a poor solvent for glucose but can facilitate the conversion of glucose to fructose. The ternary system, which contains equal amounts of acetonitrile and acetone along with a larger proportion of water, is also selected because the nitrile groups in acetonitrile and the carbonyl groups in acetone both act as hydrogen bond acceptors. This necessitates a higher concentration of water as the hydrogen bond donor to interact with both acetone and acetonitrile.
The experimental results in Figure 4(a) show that dissolving 20 grams of glucose in a 50%-v water and 50%-v acetonitrile solution below room temperature creates two distinct phases. The upper (lighter) layer, primarily acetonitrile, contains dissolved water and a small amount of glucose, while the lower (heavier) layer, an aquatic phase, holds a significant concentration of glucose along with some acetonitrile. This separation occurs due to strong hydrogen bonds between polar water molecules and the hydroxyl or carbonyl groups of glucose. As a result, the water initially associated with the acetonitrile is drawn to the lower phase, where it binds to the glucose. Wang et al. (2008) note that this phase separation occurs below room temperature because a decrease in temperature lowers the glucose concentration threshold required to form two distinct phases.
In contrast, dissolving glucose in mixtures of 50%-v water – 25%-v acetonitrile – 25%-v acetone (Figure 4(b)) and 35%-v water – 35%-v acetonitrile – 30%-v acetone (Figure 4(c)), does not result in the formation of two liquid phases. Similarly, adjusting the amount of water in mixtures of 60%-v water – 20%-v acetonitrile – 20%-v acetone (Figure 4(d)) and 40% v water – 30%-v acetonitrile – 30%-v acetone (Figure 4(e)), also does not cause phase separation. It can be concluded that a water composition below 50%-v causes glucose to precipitate in the lower phase due to insufficient water molecules for dissolution. Conversely, a water composition above 50%-v allows sufficient water molecules to interact with all the glucose, resulting in excess water interacting with both acetonitrile and acetone, which prevents phase separation. Consequently, the water–acetonitrile–acetone ternary system is less effective as a reaction medium compared to the water–acetonitrile system. The presence of acetone in the reaction medium hinders glucose dissolution and does not influence phase separation. Xie et al. (2015) conclude that acetone is more challenging to use for phase separation with the sugaring-out method compared to other compounds, such as 1-butanol. Furthermore, this method requires additional testing, as it is not as well validated as the salting-out method.
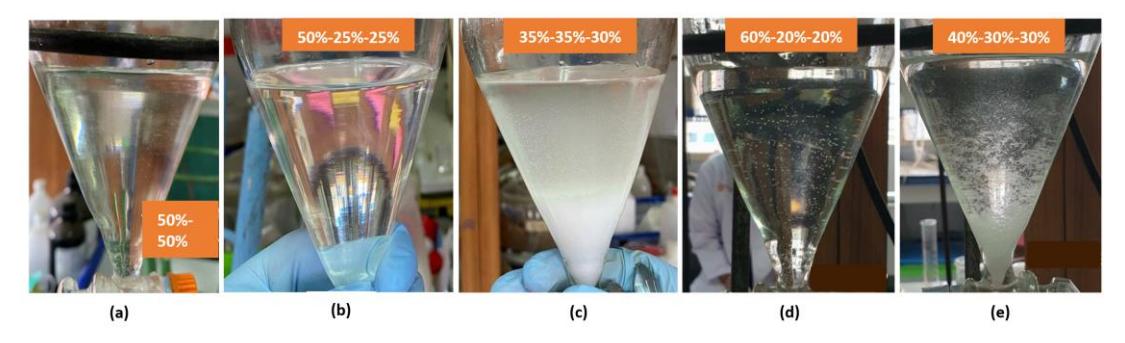
Phase changes of the solution when 20 grams of glucose were dissolved in a 100 mL mixture of water, acetonitrile, and acetone: (a) 50%-v water – 50%-v acetonitrile – 0%-v acetone; (b) 50%-v water – 25%-v acetonitrile – 25%-v acetone; (c) 35%-v water – 35%-v acetonitrile – 30%-v acetone; (d) 60%-v water – 20%-v acetonitrile – 20%-v acetone; (e) 40%-v water – 30%-v acetonitrile – 30%-v acetone.
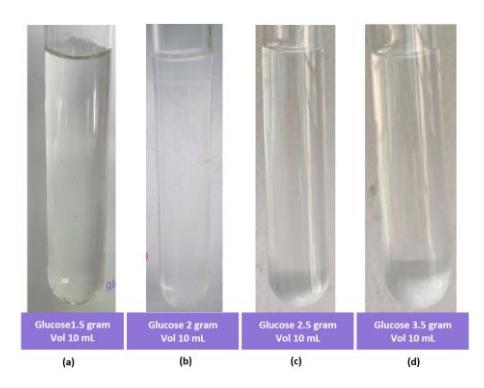
Phase changes of the solution when (a) 1.5 grams, (b) 2 grams, (c) 2.5 grams, and (d) 3.5 grams of glucose were dissolved in a 10 mL mixture of 50%-v water and 50%-v acetonitrile.
According to previous experimental results, a reaction medium of 50%-v water – 50%-v acetonitrile was the most effective for producing phase separation. In the next test, varying amounts of glucose (1.5 grams, 2 grams, 2.5 grams, and 3.5 grams) were added to a total solution volume of 10 mL, consisting of 5 mL water and 5 mL acetonitrile. The addition of 2 grams of glucose produced a noticeable phase separation (Figure 5(b)), while 1.5 grams did not lead to any separation (Figure 5(a)). In contrast, both 2.5 grams (Figure 5(c)) and 3.5 grams (Figure 5(d)) caused the glucose to settle at the bottom of the test tube. This supports an earlier finding by Wang et al. (2008) that excess glucose was unnecessary for phase separation, as it remained in the lower phase. Therefore, adding 2 grams of glucose was the most effective in producing phase separation. Following this, the main experiment utilized a 100 mL solution of 50% v water – 50%-v acetonitrile, with the addition of 20 grams of glucose.
Experimental Results on the Splitting of Glucose into Dihydroxyacetone and Glyceraldehyde Using Biomimetic Metal-Organic Catalysts
The main experiment consisted of eight runs, during which temperatures, catalyst concentrations, and types of catalyst (glutamate ion pairs) were varied. The response variables measured included glucose conversion, selectivity, and the yield of dihydroxyacetone and glyceraldehyde. The results presented in Table 1 show that using a water– acetonitrile medium in combination with a biomimetic metal-organic catalysts composed of Mg-Zn tripolyphosphate, imidazole, and monosodium or monoammonium glutamate effectively facilitates the conversion of glucose into dihydroxyacetone and glyceraldehyde. Additionally, these biomimetic metal-organic catalysts are miscible with glucose in the reaction medium, indicating a successful attempt to mimic the enzymes involved in glucose glycolysis.
| Table 1 | Experimental results on glucose conversion, selectivity and yield of dihydroxyacetone and glyceraldehyde with |
|---|---|
| variations in temperature, catalyst concentration and type of catalyst. | |
| Run | Temperature | Catalyst Concentration (%-mol) | Type of Catalyst | Glucose Conversion (%) | Dihydroxyacetone Selectivity (%-mol) | Glyceraldehyde Selectivity (%-mol) | Dihydroxyacetone Yield (%-mol) | Glyceraldehyde Yield (%-mol) |
|---|---|---|---|---|---|---|---|---|
| 1 | 40 | 0.05 | mono-NH4 | 44.0 | 99.2 | 0.8 | 43.7 | 0.3 |
| 2 | mono-Na | 48.9 | 65.5 | 34.5 | 32.0 | 16.9 | ||
| 3 | 0.2 | mono-NH4 | 48.4 | 80.9 | 19.1 | 39.2 | 9.3 | |
| 4 | mono-Na | 49.7 | 60.7 | 39.3 | 30.1 | 19.5 | ||
| 5 | 90 | 0.05 | mono-NH4 | 90.6 | 77.7 | 22.3 | 70.2 | 20.2 |
| 6 | mono-Na | 90.6 | 77.6 | 22.4 | 70.3 | 20.3 | ||
| 7 | 0.2 | mono-NH4 | 87.1 | 65.5 | 34.5 | 57.1 | 30.0 | |
| 8 | mono-Na | 90.6 | 57.8 | 42.2 | 52.4 | 38.2 |
Role of the Biomimetic Metal-Organic Catalysts
The conversion of glucose into dihydroxyacetone phosphate and glyceraldehyde 3-phosphate involves a series of five reactions, each catalyzed by a specific enzyme (Blanco and Blanco, 2017; McKee and McKee, 2019). The first reaction is the phosphorylation of glucose to form glucose 6-phosphate, catalyzed by hexokinase. In this reaction, glucose is phosphorylated by ATP (adenosine triphosphate), which donates a phosphate group and is converted into ADP. This irreversible reaction requires Mg2+ ions, as the ATP-Mg²⁺ complex serves as the transition state for phosphate group transfer (Blanco and Blanco, 2017; McKee and McKee, 2019). Additionally, the enzyme's active site contains the carboxyl group of aspartate (Brito-Arias, 2020). The biomimetic catalyst, which includes Mg tripolyphosphate, mimics both the phosphate group of ATP and the Mg2+ ions, while the glutamate ion resembles the aspartate residue found at the active site of hexokinase. This biomimetic catalyst functions similarly to the third glycolysis reaction, where fructose 6 phosphate is phosphorylated to form fructose 1,6-bisphosphate. This irreversible reaction is catalyzed by phosphofructokinase, which also contains aspartate in its active site and requires Mg2+ ions (Blanco and Blanco, 2017; McKee and McKee, 2019).
The second reaction involves the isomerization of glucose 6-phosphate to fructose 6-phosphate, a reversible process catalyzed by phosphoglucose isomerase. This enzyme's active site consists of the amino acids glutamate, lysine, histidine, and arginine (Solomons et al., 2004). The biomimetic catalyst with glutamate ion mimics the carboxyl group of glutamate. Additionally, its imidazole content mimics the active sites of lysine, arginine, and histidine, all of which contain nitrogen atoms capable of acting as proton donors and acceptors. In the fourth step of glycolysis, fructose 1,6 bisphosphate is split into glyceraldehyde 3-phosphate and dihydroxyacetone phosphate. This reversible process is catalyzed by aldolase, which has active sites composed of aspartate, glutamate, histidine, lysine, and requires Zn2+ as a cofactor (Blanco and Blanco, 2017; McKee and McKee, 2019; Bommarius and Riebel, 2004). The biomimetic catalyst with glutamate ion mimics the active sites of aspartate and glutamate through carboxyl groups, while Zn tripolyphosphate provides Zn2+ ions. In the fifth glycolysis reaction, which is also reversible, dihydroxyacetone phosphate is isomerized into glyceraldehyde 3-phosphate by triose phosphate isomerase. This enzyme's active site consists of glutamate and histidine (Brito-Arias, 2020). The biomimetic catalyst with glutamate ion mimics the carboxyl group of glutamate, while its imidazole content mimics the active site of histidine.
Proposed Reaction Mechanism
The proposed reaction mechanism for splitting glucose into dihydroxyacetone phosphate and glyceraldehyde 3 phosphate, according to the stages of glycolysis, is based on the literature of Solomons et al. (2004); Bommarius and Riebel (2004); and Brito-Arias (2020). This mechanism is illustrated in Figure 6. In the first reaction, the glutamate ion
deprotonates the C6 hydroxyl group in glucose, converting it into an alkoxide that attacks the phosphate group of magnesium tripolyphosphate. The phosphate group binds to the C6 oxygen of glucose, forming glucose 6-phosphate (Brito-Arias, 2020). This compound subsequently undergoes ring opening, assisted by imidazole and the glutamate ion in the second reaction.
The proposed reaction mechanism for splitting glucose into dihydroxyacetone and glyceraldehyde using a biomimetic metal-organic catalyst consists of five reactions.
Imidazole protonates the C5 oxygen, while the glutamate ion deprotonates the C1 hydroxyl group, leading to the formation of an open-chain aldose. Imidazole then deprotonates C2, generating a cis-enediol intermediate, which is stabilized by glutamate. Following this, imidazole donates its proton to C1, and the C2 hydroxyl group loses its proton to form an open-chain ketose. Imidazole then deprotonates the C5 hydroxyl group, resulting in the ring closure of fructose to form fructose 6-phosphate (Solomons et al., 2004). In the third reaction, the glutamate ion deprotonates the C1 hydroxyl group of fructose 6-phosphate, forming an alkoxide at C1 that attacks the phosphate group of magnesium tripolyphosphate. The phosphate group attaches to the C1 oxygen of fructose 6-phosphate, creating fructose 1,6-diphosphate (Brito-Arias, 2020).
In the fourth reaction, the glutamate ion deprotonates the C4 hydroxyl group of fructose 1,6-diphosphate, leading to the cleavage of the C3–C4 bond and the formation of glyceraldehyde 3-phosphate and the enediolate intermediate. The Zn²⁺ ion, which coordinates with three imidazoles, interacts with the enolate ion to assist glutamate in transferring hydrogen to the enediolate carbanion, resulting in the formation of dihydroxyacetone phosphate (Bommarius and Riebel, 2004). In the fifth reaction, the glutamate ion deprotonates C3 of dihydroxyacetone phosphate, while imidazole protonates the C2 oxygen to form the enediol intermediate. Finally, imidazole deprotonates the C3 hydroxyl group, and glutamate transfers hydrogen to C2, producing glyceraldehyde 3-phosphate (Brito-Arias, 2020).
Effect of Temperature
Visual observations of the experimental results indicated that at temperatures of 40°C and 90°C, the organic (upper) phase displayed a clear white color, while the aquatic (bottom) phase exhibited different colors at each temperature. The small amounts of glucose and reaction products (dihydroxyacetone and glyceraldehyde) in the upper phase, which consisted of acetonitrile, did not affect its color. However, glucose in the bottom phase caused a color change: it appeared clear at 40°C (Figure 7(a)) but turned yellow at 90°C (Figure 7(b)) due to Maillard reactions between glucose and active amino groups from glutamate and imidazole as a result of heating. According to Raisii and Aroujalian (2010), these Maillard reactions lead to the formation of color pigments in glucose, transitioning from colorless to yellow and eventually brown, with higher temperatures accelerating the browning process.
Aquatic phase reaction product at reaction temperature of (a) 40℃ (b) 90℃.
Based on data in Table 1, glucose conversion and the yields of dihydroxyacetone and glyceraldehyde are higher at 90℃ (runs 5, 6, 7, 8) compared to 40℃ (runs 1, 2, 3, 4), using catalyst concentrations of 0.05%-mol and 0.2%-mol, as well as mono-NH₄ and mono-Na as glutamate ion pairs. Handoko et al. (2009) conclude that higher temperatures result in faster reaction rates due to an increased frequency of particle collisions. As collision frequency rises, more effective interactions occur. Consequently, at higher temperatures, there are more effective collisions among Mg2+ and (P3O10) 5 ions for phosphorylating glucose, along with Zn2+, glutamate ion, and imidazole for protonating and deprotonating glucose, thereby accelerating the formation of dihydroxyacetone and glyceraldehyde. Furthermore, selectivity for dihydroxyacetone decreases while selectivity for glyceraldehyde increases with rising temperatures. This indicates that the catalyst favors dihydroxyacetone at lower temperatures but becomes more selective for glyceraldehyde at higher temperatures. The increased collision effectiveness at higher temperatures enhances protonation and deprotonation of dihydroxyacetone by glutamate ion and imidazole, leading to glyceraldehyde formation, as illustrated in Figure 6 (reaction number 5).
Effect of Catalyst Concentration
As shown in Table 1, glucose conversions are higher at 40℃ with a catalyst concentration of 0.2%-mol using mono-NH₄ and mono-Na as glutamate ion pairs (runs 3 and 4) compared to 0.05%-mol (runs 1 and 2). The increased catalyst concentration provides more Mg2+ and (P3O10) 5 ions for phosphorylating glucose, while Zn2+, glutamate ion, and imidazole facilitate the protonation and deprotonation of glucose to form dihydroxyacetone and glyceraldehyde. According to Setyaningsih et al. (2017), the presence of a catalyst generally reduces activation energy, resulting in a faster reaction rate; therefore, higher catalyst concentrations lead to greater glucose conversion. In contrast, at 90℃ with mono-NH₄ as the glutamate ion pair, glucose conversion is higher with a 0.05%-mol catalyst (run 5) compared to 0.2%-mol (run 7). However, glucose conversion is similar for both catalyst levels (0.05%-mol in run 6 and 0.2%-mol in run 8) when using mono-Na as the glutamate ion pair at 90°C. This discrepancy may indicate that the maximum conversion value is reached at 90°C, as evidenced by the nearly identical conversions in runs 5, 6, 7, and 8. Under the same temperatures and catalyst types, the selectivity and yield for dihydroxyacetone are higher with a catalyst concentration of 0.05%-mol, while selectivity and yield for glyceraldehyde increase with a concentration of 0.2%-mol. This suggests that a higher catalyst concentration enhances the protonation and deprotonation of dihydroxyacetone by glutamate ion and imidazole, facilitating the formation of glyceraldehyde, as illustrated in proposed reaction mechanism number 5 (Figure 6) (Blanco and Blanco, 2017; McKee and McKee, 2019).
Effect of Catalyst Type (Glutamate Ion Pairs)
According to the data in Table 1, glucose conversions are slightly higher when using mono-Na as the glutamate ion pair (runs 2 and 4) compared to mono-NH₄ (runs 1 and 3) at 40℃ with catalyst concentrations of 0.05%-mol and 0.2% mol. Similarly, at 90℃ and a catalyst concentration of 0.2%-mol, glucose conversion is slightly higher with mono-Na (run 8) than with mono-NH₄ (run 7). However, at 90°C and a catalyst concentration of 0.05%-mol, glucose conversion is identical for both mono-NH₄ and mono-Na (runs 5 and 6). These results suggest a slight tendency for higher glucose conversion with mono-Na compared to mono-NH₄. This indicates that Na⁺, which makes the solution more basic than NH₄⁺, does not significantly affect glucose conversion. Similarly, the presence of NH₄⁺, which can donate protons and make the solution slightly more acidic, has little impact on glucose conversion. In this context, mono-Na helps solubilize the poorly soluble [Mg5(P3O10)2] and [Zn5(P3O10)2], promoting the formation of soluble Na3[MgP3O10] and Na3[ZnP3O10] complexes. Meanwhile, mono-NH₄ mimics the NH bond in the amino acid structures of glycolysis enzymes. Under the same temperatures and catalyst concentrations, the selectivity and yield of dihydroxyacetone are generally higher with mono-NH₄ as the glutamate ion pair compared to mono-Na. This suggests that mono-NH₄ exhibits greater specificity in the formation of dihydroxyacetone, likely due to slightly more acidic solution conditions.
Futher Investigation (Confirmation Experiment)
Additional investigations were conducted to validate previous results on conversion, selectivity, and yield. Other researchers, such as D'Amore et al. (1989), achieved an 80% conversion in glucose fermentation with yeast over 72 hours. Akoetey (2015) reported a 70% conversion of potato starch to lactic acid using Lactobacillus amylovorus in 60 hours, while Jing et al. (2020) noted a 60% conversion of fructose to dihydroxyacetone using zwitterionic catalysts (HIDA). In contrast, the reaction medium and biomimetic metal-organic catalyst used in this study achieved approximately 90% conversion of glucose to trioses in just 6 hours. Given that other studies reported glucose conversions of 60 – 80% over longer periods, we conducted reconfirmation experiments to ensure the accuracy of our findings.
We modified our analysis methodology for these experiments. Previously, reducing sugars were analyzed using DNS reagent in both phases, while aldose analysis was performed exclusively in the lower phase and glyceraldehyde analysis exclusively in the upper phase. In this follow-up research, we replaced spectrophotometric analysis of the DNS reagent with titration methods to analyze aldose and glyceraldehyde in both phases. While spectrophotometric analysis was quicker and easier, it proved less accurate due to difficulties in establishing a highly linear standard curve between concentration and absorbance. Additionally, the acetonitrile used in the experiment had a purity level of 80% (containing 20% water), allowing for the possibility that glucose could dissolve in the upper phase. In contrast, dihydroxyacetone and glyceraldehyde are organic compounds that can dissolve in both phases.
This investigation was conducted under near-optimal conditions. The experiments were performed at a temperature of 90℃, as glucose conversions were higher at this temperature compared to 40℃. Mono-Na was used as the glutamate ion pair because it resulted in slightly higher glucose conversions than mono-NH4, particularly at catalyst levels of 0.05%mol and 0.2%-mol. At 90℃ with mono-Na, glucose conversions were similar for both catalyst levels. Consequently, further experiments were conducted using catalyst concentrations of 0.4%-mol and 0.8%-mol, as increasing catalyst concentration could accelerate the reaction rate and improve glucose conversion (Setyaningsih et al., 2017). An additional variation, extending the reaction time to 8 hours, was performed to determine whether the conversion of glucose to trioses in the equilibrium reaction could be further enhanced or if it had reached a plateau. The experimental results and variations are summarized in Table 2, where the averages of duplicate experiments show a variance of approximately 3%.
Table 2 Further experimental results at temperature 90oC on glucose conversion, selectivity and yield of dihydroxyacetone and glyceraldehyde with variations in catalyst concentration and reaction time.
| Run | Temperature | Catalyst Concentration | Reaction Time | Glucose Conversion | Dihydroxyacetone Selectivity | Glyceraldehyde Selectivity | Dihydroxyacetone Yield | Glyceraldehyde Yield |
|---|---|---|---|---|---|---|---|---|
| (°C) | (%-mol) | (hours) | (%) | (%-mol) | (%-mol) | (%-mol) | (%-mol) | |
| 1 | 90 | 0.4 | 6 | 39.74 | 40.73 | 59.27 | 16.20 | 23.54 |
| 2 | 0.4 | 8 | 48.17 | 46.70 | 53.30 | 22.50 | 25.67 | |
| 3 | 0.8 | 6 | 57.16 | 55.88 | 44.12 | 31.94 | 25.22 |
According to Table 2, the highest glucose conversion (57.16%) occurs at 90°C within 6 hours using a catalyst concentration of 0.8%-mol. Significant glucose conversion is also observed at catalyst concentrations below 1% with a reaction time of 6 hours. Compared to previous studies on glucose conversion to dihydroxyacetone, which primarily focused on microorganisms, this study presents a more efficient catalytic approach. For example, Corynebacterium glutamicum achieves 77% conversion at pH 7.5 and 33°C over 48 hours (Jojima et al., 2012), genetically engineered Escherichia coli shows over 70% conversion at pH 7.2 and 37°C for 40 hours (Jain et al., 2016), and Klebsiella pneumoniae attains 98% conversion at pH 6 and 37°C for 91 hours (Sun et al., 2021). In contrast, this study demonstrates that biomimetic metal-organic catalysts offer a promising alternative for glucose conversion to dihydroxyacetone, achieving relatively high conversions with significantly shorter reaction times and smaller catalyst amounts.
Table 3 Percentage error in the accuracy test of aldose analysis using a glucose solution.
| Initial Glucose Concentration (mmol) | Tested Glucose Concentration (mmol) | Error (%) |
|---|---|---|
| 107.14 | 3.57 | |
| 111.11 | 108.33 | 2.5 |
Color of the sample solution: (a) Before incubation (b) After incubation in several test tubes for dihydroxyacetone qualitative analysis (1:sample of the aquatic phase; 2:sample of the organic phase; 3:standard solution of dihydroxyacetone dissolved in acetonitrile; 4 and 5:standard solution of dihydroxyacetone dissolved in water at a certain concentration).
This experiment further validated the assessment of aldose content in the sample. The procedure involved using a glucose solution (since glucose is an aldose) with the same concentration as the glucose sample, followed by titration and calculation of glucose content. The results in Table 3 showed a ±3% error between the initial and measured glucose concentrations, indicating that the aldose analysis could detect aldoses with relatively small error. Furthermore, the presence of dihydroxyacetone in this experiment was confirmed through qualitative analysis. However, glyceraldehyde could not be analyzed qualitatively due to limited material availability. As shown in Figures 8(a) and (b), all solutions in the test tubes changed color, transitioning from clear yellow to orange before incubation and then shifting to pink and dark red after incubation. These color changes confirmed the presence of dihydroxyacetone. The color change in test tube (1) was particularly pronounced and closely resembled that in test
tube (5), suggesting a high concentration of dihydroxyacetone in the aquatic phase. In contrast, the similar color changes observed in test tubes (2) and (3) indicated a lower concentration of dihydroxyacetone in the organic phase.
Effect of Catalyst Concentration
In experiments conducted at 90°C, using mono-Na as the glutamate ion pair and a reaction time of 6 hours, glucose conversion, selectivity, and yield of dihydroxyacetone are higher with a catalyst concentration of 0.8%-mol compared to 0.4%-mol. As shown in Table 2, the conversion in run 3 is 57.16%, higher than the 39.74% observed in run 1. An increased catalyst concentration provides more Mg2+ and (P3O10) 5 ions for phosphorylating glucose, as well as Zn2+ , glutamate ion, and imidazole to protonate and deprotonate glucose, leading to the formation of dihydroxyacetone and glyceraldehyde. This demonstrates that catalyst concentration significantly influences the reaction rate, as a catalyst generally lowers the activation energy and accelerates the reaction. Consequently, higher catalyst concentrations result in enhanced glucose conversion and higher yields of dihydroxyacetone and glyceraldehyde (Setyaningsih et al., 2017). When comparing runs 1 and 3 (Table 2), the selectivity for dihydroxyacetone increases from 40.73% to 55.88% with a higher catalyst concentration, while selectivity for glyceraldehyde decreases from 59.27% to 44.12%. In run 1, with a 0.4%-mol catalyst, Mg2+ and (P3O10) 5 ions phosphorylate glucose, while Zn2+ , glutamate ion, and imidazole protonate and deprotonate glucose to form glyceraldehyde. This results in higher selectivity for glyceraldehyde (59.27%) than dihydroxyacetone (40.73%). When the catalyst concentration increases to 0.8%-mol in run 3, the additional glutamate and imidazole facilitate the conversion of glyceraldehyde back to dihydroxyacetone, leading to higher selectivity for dihydroxyacetone (55.88%) than for glyceraldehyde (44.12%). As shown in Figure 6 (reaction number 5), glyceraldehyde is the primary product; however, since this isomerization reaction is reversible (Blanco and Blanco, 2017; McKee and McKee, 2019), glyceraldehyde can be converted back to dihydroxyacetone in the presence of more glutamate and imidazole. As a result, increasing the catalyst concentration enhances selectivity for dihydroxyacetone.
Effect of Reaction Time
In experiments conducted at 90°C with mono-Na as the glutamate ion pair and a catalyst concentration of 0.4%-mol, glucose conversion, selectivity, and yield of dihydroxyacetone are higher with an 8-hour reaction time compared to a 6-hour reaction time. As shown in Table 2, glucose conversion increases from 39.74% at 6 hours (run 1) to 48.17% at 8 hours (run 2), indicating that conversion has not yet reached a plateau. This increase is attributed to the longer reaction time, which allows more Mg2+ and (P3O10) 5 ions to phosphorylate glucose, while providing more Zn2+ , glutamate ion, and imidazole to protonate and deprotonate glucose, thereby forming dihydroxyacetone and glyceraldehyde. Moreover, the selectivity and yield of dihydroxyacetone increase with longer reaction times, while selectivity for glyceraldehyde decreases. During the 6-hour reaction, the presence of Mg2+ and (P3O10) 5 ions phosphorylates glucose, while Zn²⁺, glutamate ion, and imidazole facilitate the protonation and deprotonation of glucose to form glyceraldehyde. This results in higher selectivity for glyceraldehyde, with values of 59.27% (run 1) and 53.30% (run 2), compared to dihydroxyacetone's selectivities of 40.73% (run 1) and 46.70% (run 2). However, extending the reaction time to 8 hours enables longer interactions between glutamate, imidazole, and glyceraldehyde, which facilitates the conversion of glyceraldehyde back to dihydroxyacetone. This shift increases dihydroxyacetone selectivity from 40.73% (run 1) to 46.70% (run 2), while selectivity for glyceraldehyde decreases from 59.27% (run 1) to 53.30% (run 2). As illustrated in Figure 6, reaction number 5 identifies glyceraldehyde as the primary product. However, since this isomerization reaction is reversible (Blanco and Blanco, 2017; McKee and McKee, 2019), glyceraldehyde can be converted back to dihydroxyacetone. Consequently, selectivity for glyceraldehyde decreases with longer reaction times.
Conclusions
The results of this investigation suggest that Mg-Zn tripolyphosphate, in combination with imidazole and monosodium glutamate, is a promising biomimetic metal-organic catalyst for splitting glucose into dihydroxyacetone and glyceraldehyde. In this study, a 50%-v mixture of acetonitrile and water is identified as the optimal reaction medium. Increasing the temperature, catalyst concentration, and reaction time significantly enhances glucose conversion, while the catalyst type has a relatively minor effect. The highest glucose conversion (57.16%), dihydroxyacetone selectivity (55.88%) and yield (31.94%), as well as glyceraldehyde selectivity (44.12%) and yield (25.22%), are achieved at a temperature of 90°C, with a reaction time of 6 hours and a catalyst concentration of 0.8%-mol.
Compliance with ethics guidelines
The authors declare that they have no conflict of interest or financial conflicts to disclose.
This article does not contain any studies with human or animal subjects performed by any of the authors.