
Introduction
The geological framework of Indonesia has distinctive features due to the interplay of the three major tectonic plates, including the Eurasian, Pacific, and Indo-Australia located at the west, east, and south, respectively (Hall, 2009). The Indo-Australia plate subducts under the Eurasian plate and this leads to the production of Sunda Volcanic Arc consists of Sumatra, Sunda Strait, Java, and the Lesser Islands from Bali to Sumba Islands (Harjono, 2017). Moreover, the relative movement of the three plates produces different microplates or blocks which further experience some motion and volcanic chains from the western to eastern parts of Indonesia (Darman & Sidi, 2021). It is also important to state that Sumatra Island is bounded by subduction from the SW region as well as the Sumatran fault system known as the Sumatran Great Fault Zone (Diament et al., 1992).
The subduction zones were built from descending oceanic plates under the continental or other oceanic plates and manifest as volcanoes through the high pressure and temperature of the subducted slab which change solid into molten rocks (Hall, 2002). Moreover, the molten materials termed as magma erupt to the surface of the Earth through weak zones such as fractures in the crust to form volcanoes (Schminke, 2004). The Western Sunda Arc region is composed of eighty-three active volcanoes which have led to the development of a dynamic and complex geological environment (Venzke, 2024; Sukhyar, 2011). Volcanic activity varies based on the speed and angle of the subducting slab in each segment, leading to notable differences in geodynamic conditions. The geodynamic conditions refer to the processes related to tectonic plate movements, crustal deformation, subducted plate, and mantle dynamics including partial melting and magmatic plumbing system. Variations of the subduction rate and angle create significant differences in these geodynamic conditions (Harjono, 2017). Therefore, volcanic activity characteristics—such as eruption style, magma composition, and intensity—can be distinguished among different subduction segments. A minimum of five characters of eruption related to active volcanoes have been recognized in Indonesia, especially Java and Sumatra, in the last four decades. The characteristics of eruption mean the behavior of eruption such as eruption type, duration of the eruption, resting period, and explosivity energy. Those characteristics are important to mitigate their hazards such as lava flows, pyroclastic flows, or ash falls, which directly impact human safety and the environment. Understanding eruption characteristics are crucial for risk reduction as well as hazard mitigation. The first includes volcanoes with lava domes, the second is those with crater lakes, the third is those with hydrothermal systems, the fourth is with gas eruptions, and the fifth is the cones inside a caldera (Zaennudin, 2010; Pratomo, 2006). Furthermore, the changes of eruption style and magnitude have been reported in volcanic activities over the last decades as observed in the eruption of Mt. Sinabung in 2010 after a long resting period estimated at 400 years and Mt. Merapi in the same year which produced large volcanic products with VEI=4 (Iguchi et al., 2012). The trend of the eruption behaviors shows the importance of the subduction segment in obtaining information related to volcanic activities (Stern, 2002). Furthermore, satellite imagery data can be used to monitor and analyze these phenomena thoroughly (Lukiawan, 2019).
This study aimed to identify the geological lineament and land surface temperature (LST) on the volcanoes distributed along the Western Sunda Arc subduction zone as presented in the following Figure 1.
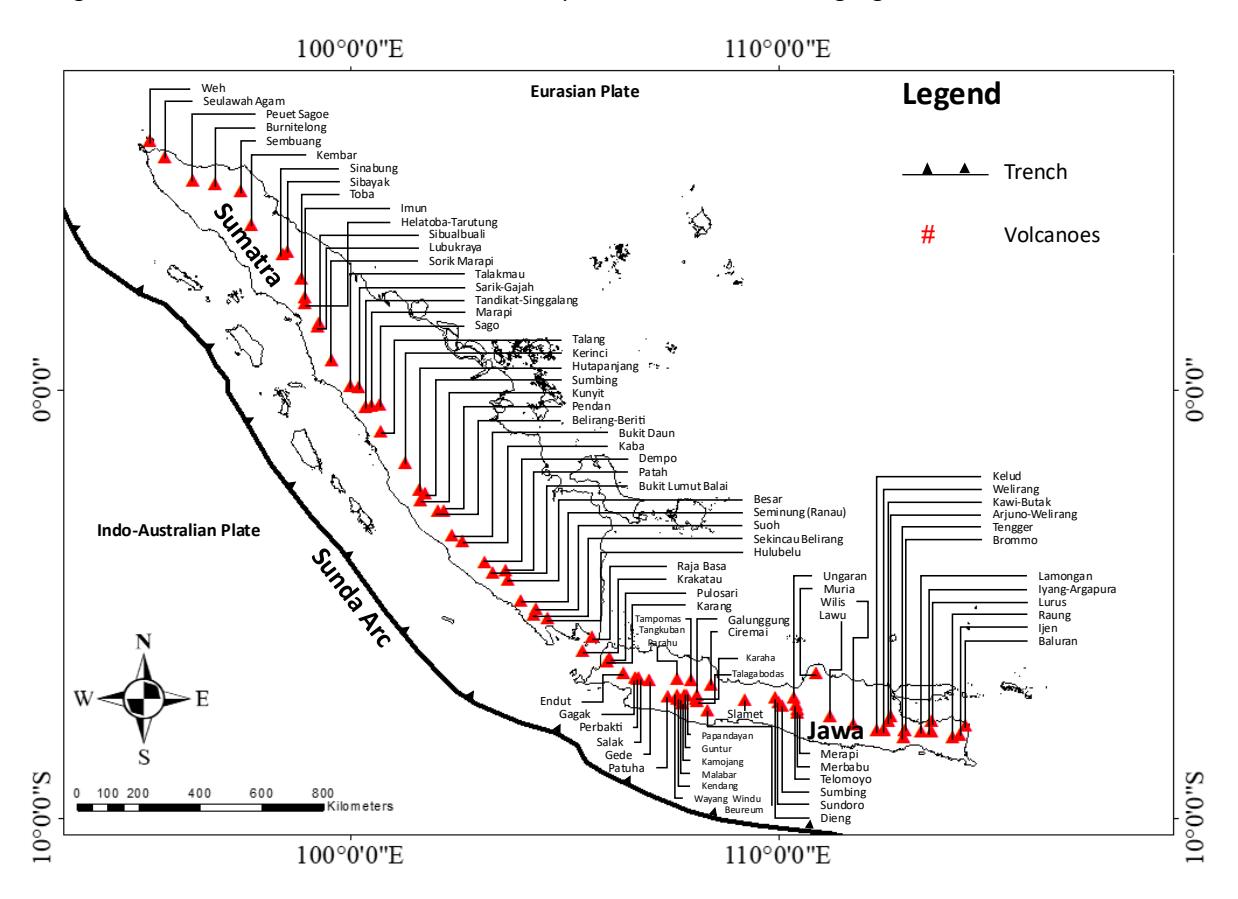
The Sunda arc is presented in black line to represent the trench and volcanic chain above the subduction zones of Indo-Australia and Eurasia plates occupying Sumatra and Java Islands.
The purpose was to spatially group Sumatra-Java volcanoes based on similar surface parameters considering the challenges posed by highly varied activities to mitigation efforts. The focus was on the geological lineament and LST which were selected due to the tectonics and volcanics association (Bermudez, 1993). Moreover, the preference for Sunda Arc as the study area was because of the tectonics and volcanic complexity as well as the location around the densest population in Indonesia. This study also discussed the characteristics of the subduction slab between Sumatra and Java islands to serve as an initial hypothesis for the distribution of volcanoes.
Data Collection and Method
The digital elevation model (DEM) from Shuttle Radar Topographic Mission (SRTM) 30 m images was used to obtain geological lineament, Landsat 8 OLI/TIRS images from United States Geological Survey (USGS) to calculate the LST, and slab subduction data from United States Geological Survey (USGS) (Siombone, 2022) to support the segmentation. The SRTM DEM images are currently being used widely to model surface morphology (Yang et al., 2011) and the data are discovered to be providing a high-resolution elevation to represent the topography of the Earth with global coverage estimated at 80% (Prabowo, 2017). The data are considered superior in the process of obtaining height information in the form of 2D map products such as contour, profile, and shade maps. Furthermore, the topographical accuracy was estimated at 30 m and made available for medium to small-scale mapping. The Landsat 8 OLI/TIRS satellite was launched in 2013 as part of the Landsat Program developed to provide imagery of Earth's surface from space since 1972 (Ridwan et al., 2018).
The satellite uses the operational land imager (OLI) and thermal infrared sensor (TIRS) instruments to acquire images of Earth at different spectral wavelengths. It has the capacity to provide spatial resolution from 15 to 30 meters as well as multispectral bands such as ultraviolet, visible, and infrared. However, optical satellite images affected by atmospheric condition such as clouds, shoot, and water pavor, especially in tropical regions such as Indonesia. To overcome this limitation, atmospheric correction was applied to reduce water pavor and cloud removal algorithms to improve the quality of the images (Sulyantara et al., 2018). Moreover, the subduction slab data used in this study included the depth, angle, and geometry of the slab sinking into the mantle selected due to the importance of understanding the seismicity, volcanic activity, as well as geodynamic processes and evolution of the Earth's crust in subduction zones (Alif et al., 2021). The slab data were obtained from the United States Geological Survey (USGS) in the form of slab models (Hayes et al., 2018). It is also important to state that the detailed information on the data used in this study is listed in the following Table 1 while the methodology applied to determine the segmentation of volcanoes is presented in Figure 2.
Table 1 Data on Sumatra and Java Islands used in this Study.
| Data | Resolution (m) | Acquisition | Accumulated Frames | Source | |
|---|---|---|---|---|---|
| SRTM DEM | 30 | 2014 | 860 | https://earthexplorer.usgs.gov/ | |
| Slab 2.0 | - | 2019 | - | https://www.science.org/doi/10.1126/science.aat4723 | |
| Landsat 8 OLI/TIRS | 15 and 30 | 2019 | 955 | https://earthexplorer.usgs.gov/ | |
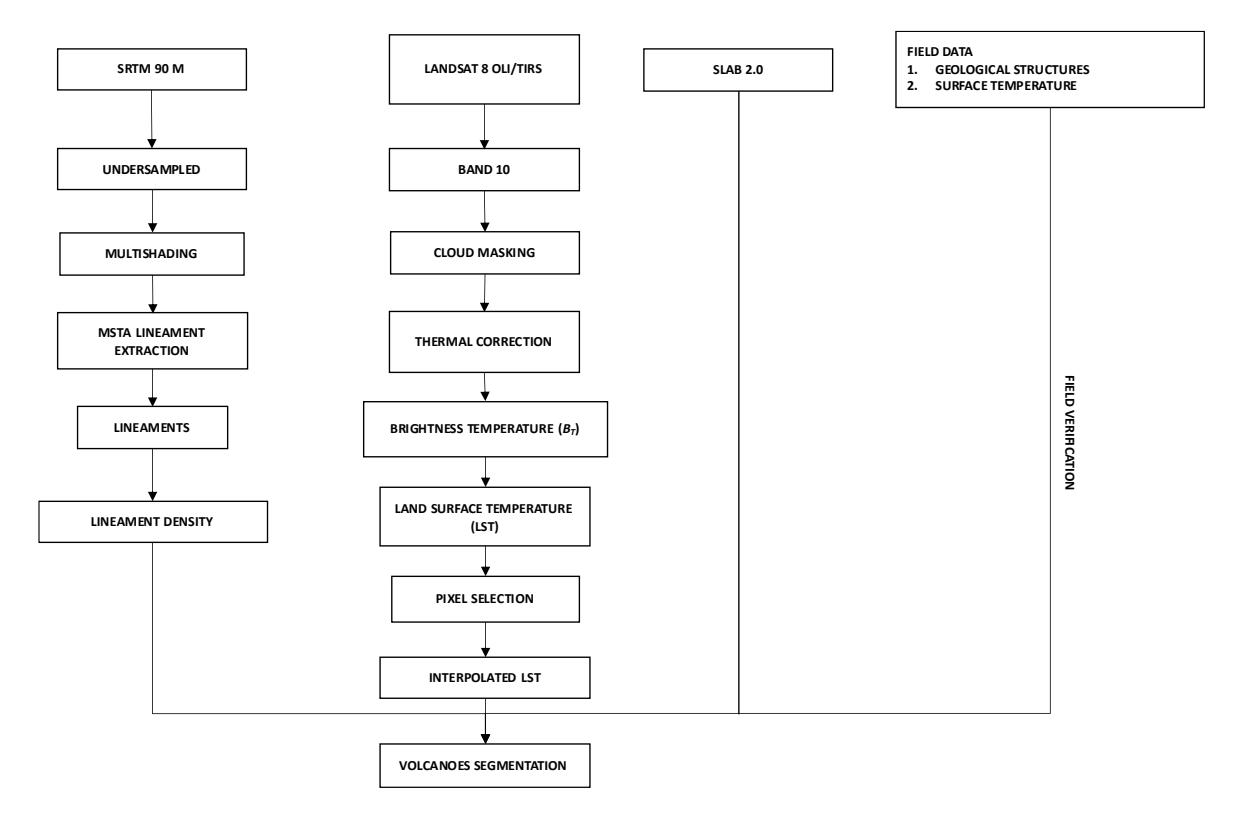
Workflows to identify the segmentation of volcanic distribution beyond Sunda Arc based on geological lineament densities and land surface temperatures.
Quantification of Extracted Geological Lineaments
Lineament density was analyzed based on simulated DEM SRTM data at a shading azimuth of 45° and 315 as well as an elevation of 45°, Those sun azimuthal orientations were selected perpendicular to the main strikes of geological structure in the West Sunda Arc with the purpose to expose the lineament related structures and minimize redundancy of the same lineaments (Palanunu et al., 2020). These two shading azimuths were selected to enhance the visual aspects of the geological structures in Sumatra and Java. Moreover, the differences between the hue contrast and color similarity (Hermawan & Rezky, 2011) were used to identify the ridge and valley patterns. The process was followed by the analysis of the lineament using a rose diagram to determine the dominance based on frequency, azimuth magnitude, and formation style (Junursyah, 2017). The method was applied because of its ability to reduce the subjectivity factor in describing the possible lineament due to human misperception during the process of drawing the lines as well as the capacity to improve time efficiency (Saepuloh et al., 2018). It is important to state that the extraction using visual analyses of satellite images can effectively characterize fracture systems but the process is subjective and limited for large areas due to the negligibility of the lineament in large-scale analysis, leading to inefficiency (Saepuloh et al., 2013). Therefore, an automatic detection method termed modified Segment Tracing Algorithm (mSTA) SRTM was developed to identify geological structures in Sumatra and Jawa Islands. The mSTA was applied based on the edge detected from satellite images through the statistical criteria within 11x11 window size (Koike et al., n.d.). The method was observed to have been used in previous studies to identify landslide susceptibility zones (Zahratunnisa et al., 2023), geological structures in geothermal fields (Pradipta et al., 2016), and detection of near-surface permeable zones (Heriawan et al., 2021). It has also been applied to geological lineament extracted from dual-orbit SAR images for fluid flow path detection and characterization in geothermal systems (Aulia et al., 2020).
The extraction of the lineament was based on the SRTM DEM shaded images through the following steps. The 860 frames of SRTM DEM images were mosaicked based on geographic references and resampled from 30 to 750 m spatial resolution to simplify the processing effort. The under-sampled system used is a digital processing method to minimize image size and retain spatial information by reducing the spatial resolution (Occorsio et al., 2023). This was achieved by recreating the image to change the pixel size and detail level (Occorsio et al., 2023). To minimize information loss during the under-resampled process, a bilinear interpolation method was applied. This technique calculates the new pixel values based on the weighted average of its nearest neighbors, effectively preserving spatial patterns and topographic details (Carneiro De Souza Barros & Rolim Da Paz, 2024). Moreover, the mSTA method allows lineament detections in a multi-shaded SRTM image. This led to the simulation of the SRTM DEM image using multi-directional illumination shades in order to understand the main geological structures in Sumatra and Java islands. The application of the mSTA method was followed by the identification of the line elements by examining the local Gray variations along 16 directions at intervals of 11.25° using an 11 × 11 pixels window size (Koike et al., n.d.). Furthermore, the three lineament density indices were calculated as the lineament intersection (\(L_i\)), frequency (\(L_f\)), and length (\(L_i\)). The \(L_i\) is the intersected lineaments within the selected grid corresponding to the estimated multiple fracturing system (Saepuloh et al., 2013) while the \(L_f\) and \(L_i\) are the summation and the total length of extracted lineaments within the selected grid, respectively calculated as follows:
\[L_l = \frac{1}{A} \sum_{k=1}^n l_k \tag{1}\]
\[L_f = \frac{1}{A} \sum k(x) \tag{2}\]
\[L_i = \frac{1}{A} \sum i \left( x \right) \tag{3}\] where, k is the lineament in grid x, A is area, \(l_k\) is the length of each lineament k, and i is the lineament intersection in grid x. The three lineament densities calculated are subsequently presented in the following Figure 3.
In the calculation of lineament density, the dimensions of the grid size to the total study area had a significant impact on the lineament map (Haeruddin et al., 2016). This was observed from the fact that a small grid size produced local density variations but the general patterns were less obvious. Meanwhile, a large grid size produced less local density variations with more pronounced general patterns. The results of previous studies on the application of lineament density showed that the appropriate grid size to estimate fracture permeability at 28 m resolution and 20 x 20 km surface manifestation area was \(1\times1\) km (Haeruddin et al., 2016). Therefore, this study was conducted using a grid size of \(8\times8\) km for mosaicked SRTM DEM at 750 m image resolution and \(2500\times1900\) km² area.
Figure 3 Quantified extracted lineaments (k) for length density \((L_i)\), frequency density \((L_f)\), and intersection density \((L_i)\) within the grid (x).
The results of the analysis showed that the mSTA successfully extracted 1390 and 565 lineaments with the strike direction observed to be mainly NW-SE and W-E for Sumatra and Java Islands, respectively as presented in Figure 4A. The strike directions were in line with the regional tectonic framework of Sumatra and Java (Handayani & Harjono, 2008). Moreover, the lineaments extracted were associated with geological structures such as faults, fractures, joins, beddings, and lithological boundaries (Ahmadi & Pekkan, 2021). The densities were later calculated and interpolated using the ordinary kriging method with a focus on \(L_f\), \(L_i\), and \(L_i\) to quantify the lineaments. The \(L_i\) showed the number of lineament length densities detected in Figure 4B, \(L_f\) presented the number of lineament frequency densities in Figure 4C, and \(L_i\) indicated the density of intersections in Figure 4D.
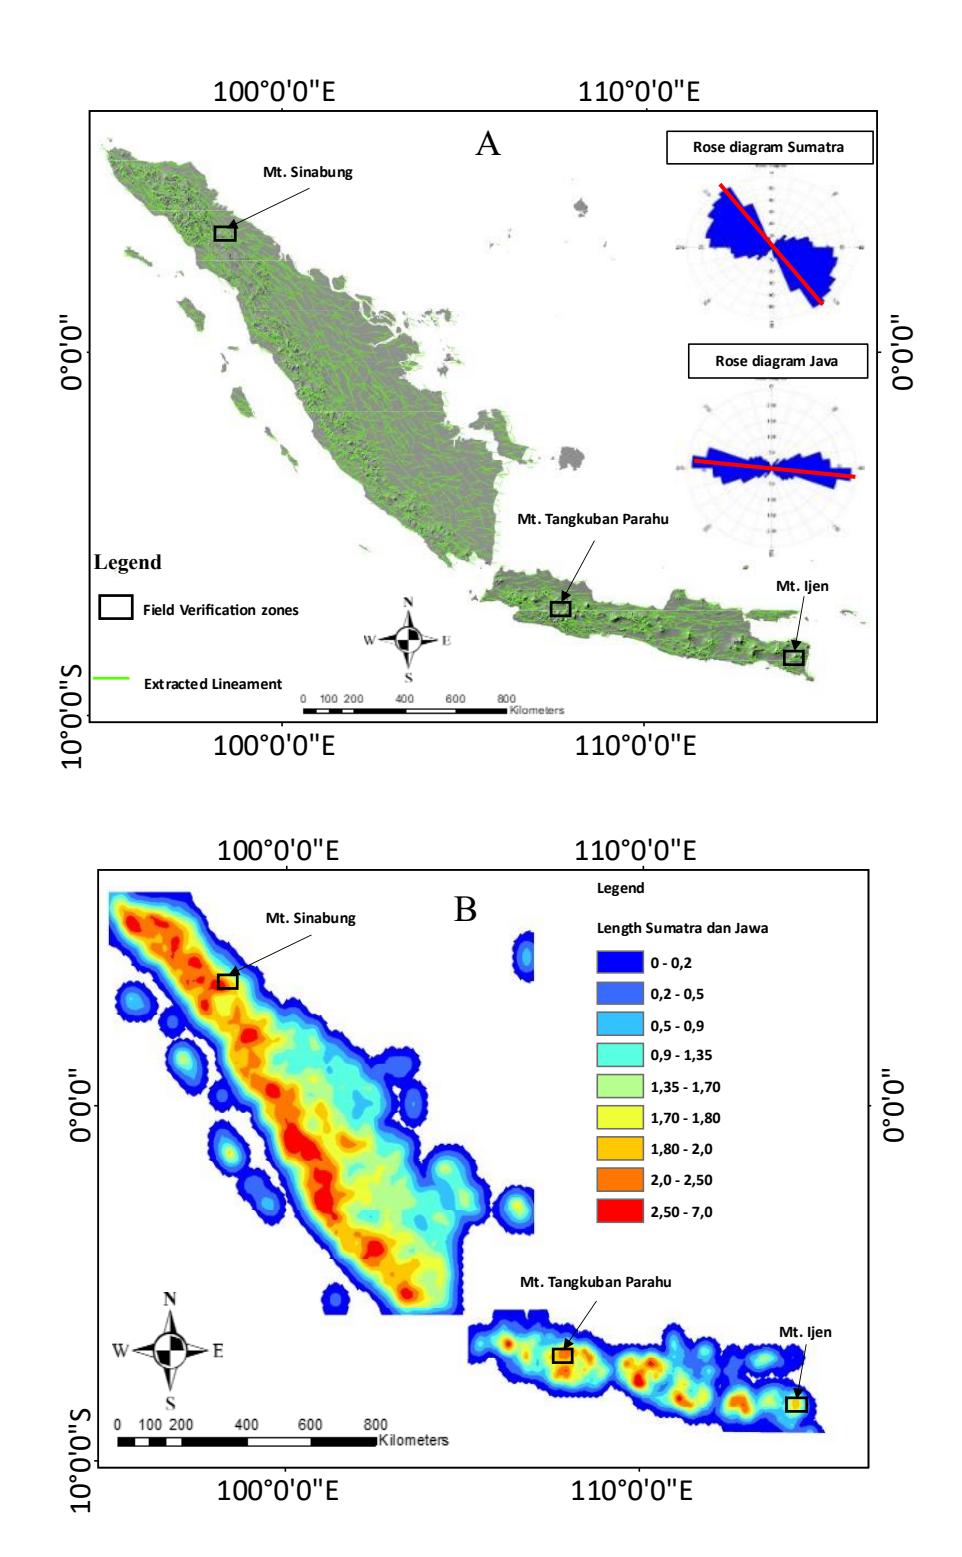
The lineaments extracted using the mSTA method and frequency of directions presented by the rose diagram. The regional fault directions of Sumatra and Java Islands are represented in red lines (A) while the ordinary kriging map of the lineament length density Ll is in (B), frequency Lf (C), and intersection Li (D).
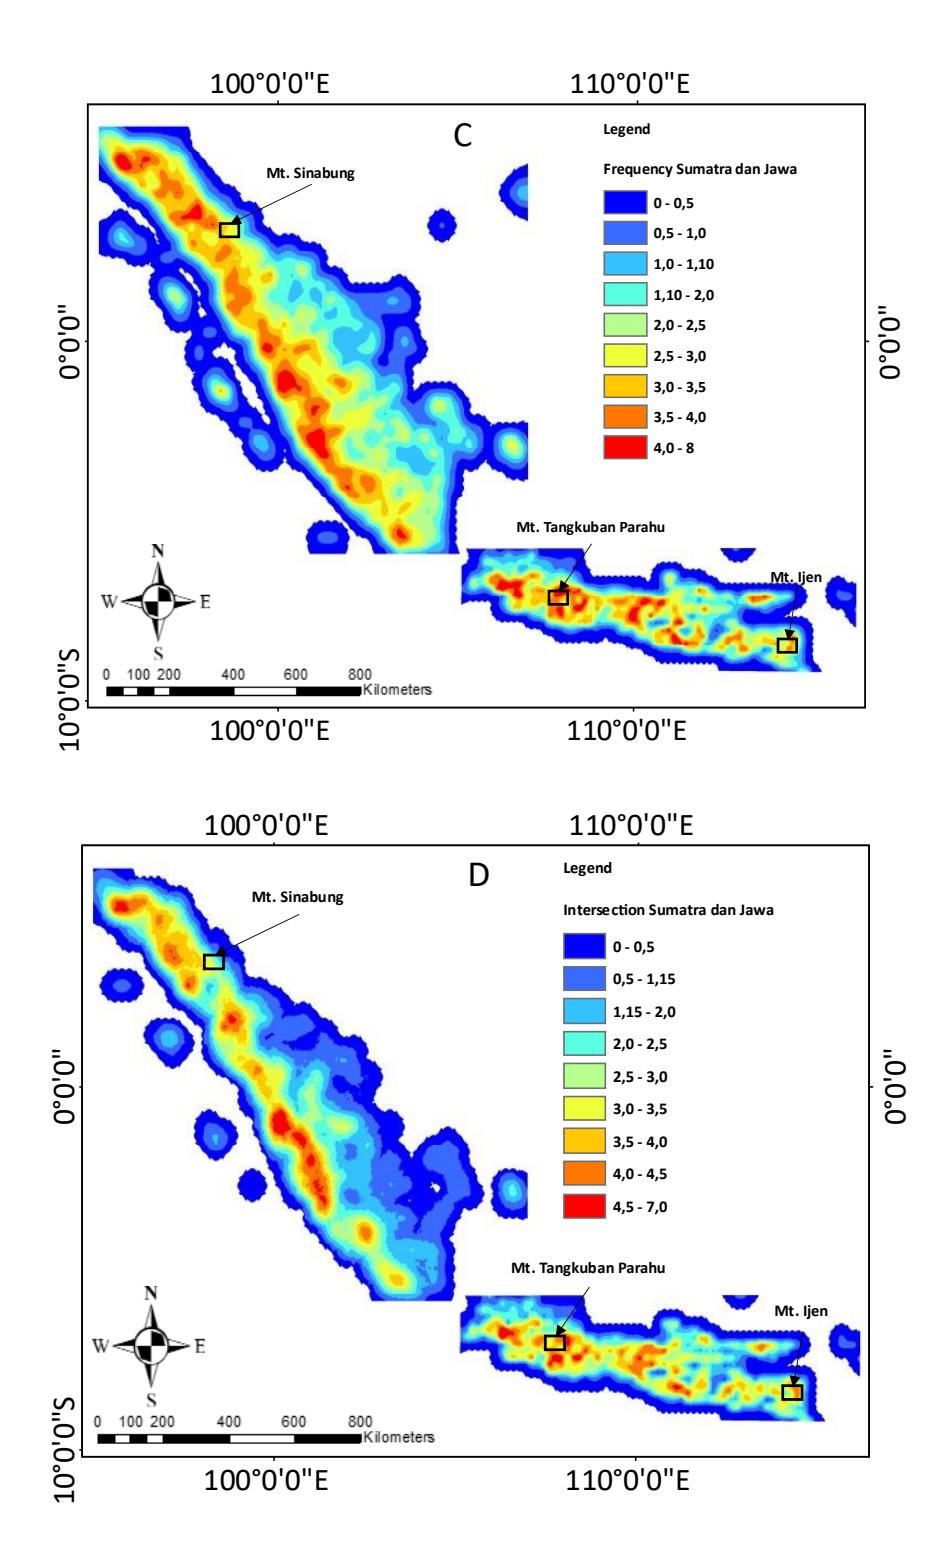
Figure 4 Continued. The lineaments extracted using the mSTA method and frequency of directions presented by the rose diagram. The regional fault directions of Sumatra and Java Islands are represented in red lines (A) while the ordinary kriging map of the lineament length density Ll is in (B), frequency Lf (C), and intersection Li (D).
The lineament density and volcanoes distribution were used to divide the Ll in Sumatra and Java into six and three segments as presented in Figure 5A. The segments were identified based on the Ll patterns in the map and the volcanic distribution density. Another interesting phenomenon observed was that the strike directions of the lineament from Segment-1 (S-1) to -6 (S-6) rotated counterclockwise as presented in Figure 5B.
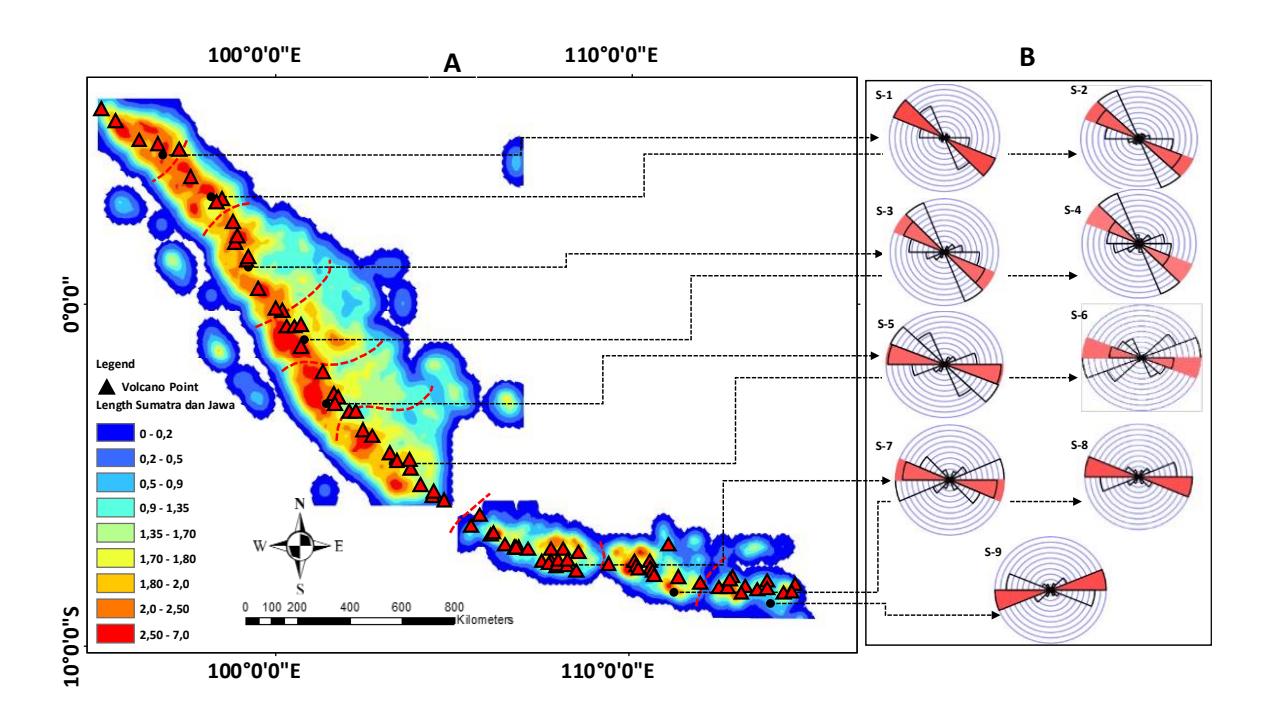
Figure 5 The segments identified through the ordinary kriging map of the lineament length density (L<sub>I</sub>) and distribution of volcanoes (A). The lineament strike directions frequency presented by the rose diagram shows that the lineament directions rotate counterclockwise from Segment-1 (S-1) at North Sumatra to -9 (S-9) at East Java (B).
The rotation of lineament strike directions showed that the directional stress for each segment was consistent with the tectonic frameworks from the northwest-southeast in Sumatra to the West-East in Java (Hall, 2012). Each segment exhibited distinctive features from S-1 to S-6 in line with the Great Sumatra Fault (GSF) zone in the NW-SE direction. Moreover, the lineament direction shifted from S-7 to S-9 in line with the Java Fault zone in the W-E direction.
Extraction of Land Surface Temperature
The land surface temperature (LST) is the temperature of the Earth's surface as measured from a satellite or other remote sensing platforms (Siombone, 2022). The concept is also explained in remote sensing as the average temperature determined through the coverage of different types of surfaces under a pixel. The LST was calculated using the thermal emissivity separation (TES) method as well as the measurement of the ground temperature which was conducted to mitigate the influence of atmospheric absorption, the thermal inertia of the surface, and/or daily temperature variations within the images (Hulley & Hook, 2011). The TES method was applied with an improved thermal correction based on field measurements to estimate kinetic temperature as well as the emissivity obtained from Landsat 8 OLI/TIRS (Saepuloh et al., 2021). The formula used in calculating the LST is presented as follows:
\[B\tau = \frac{2\pi hc^2}{\lambda \ln(\frac{\tau \epsilon hc\lambda^{-5}}{\pi Pk} + 1)} \tag{4}\]
Where, R is the radiance detected at the sensor in Wm-\(^2\)ster\(^-\)1, h is the Planck constant, c is the speed of light, k is the Boltzmann constant, \(\tau\) is the atmospheric transmittance, \(\lambda\) is the wavelength, and \(\epsilon\) is the surface emissivity estimated from the TES method (Saepuloh et al., 2021). The LST of Sumatra and Java Islands was calculated using 955 frames of Landsat 8 OLI/TIRS with a focus on the 2019 acquisition year, and the distribution was observed to have varied from 16°C to 31°C as presented in Figure 6A.
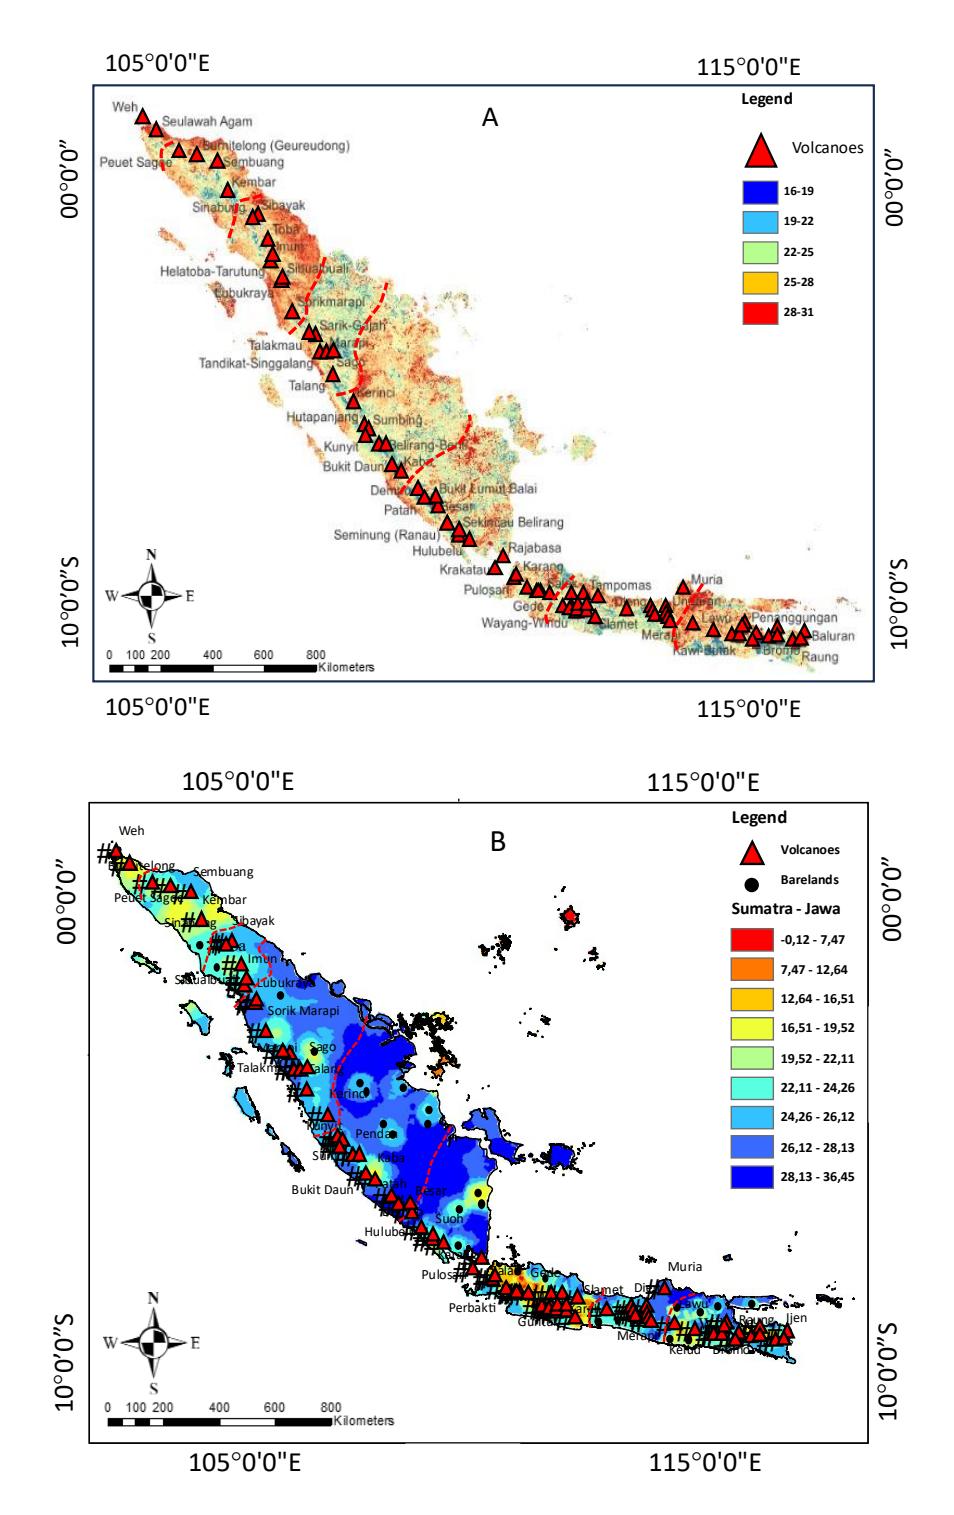
Figure 6 Land surface temperature calculated from the Landsat 8 OLI/TIRS (A) and the values interpolated based on pixel selections at eruption centers and bare lands (B) overlaid by the segments identified in Sumatra and Java Islands which are presented in red lines.
The LST at the summit of volcanoes and bare lands was selected to exclude the thermal energy from the environment such as the urban heat. Moreover, an interpolation was conducted using the ordinary kriging method to determine the spatial distributions of the selected LST map in Figure 6B. This was used to zone the surface temperature based on the segments identified. The results further showed that high thermal radiation from volcanoes contributed significantly to the zonation process. Therefore, the tectonic frameworks presented through the segments identified were in line with the thermal distribution from the volcanoes.
Field Verification of Extracted Lineaments and Land Surface Temperatures
The extracted lineaments and LST were verified using field geological investigation and measurements. The field verification was conducted by selecting three volcanoes to represent Sumatra and Java segments, including Mt. Sinabung (North Sumatra), Tangkuban Parahu (West Java), and Ijen (East Java). For Mt. Sinabung, the mSTA extracted 1152 lineaments with strike direction mainly in the 70° NE as presented in Figure 7A which was in line with the NE-SW faults zone in the rose diagram results. However, some discrepancies were associated with the field results which included the domination of local geological structures under extensional and compressional regimes. For Mt. Tangkuban Parahu, a total of 1890 lineaments were extracted with the mine strike direction recorded to be 86° NE as presented in Figure 7B which conformed to the W-E faults zone in the rose diagram results. Moreover, 1987 lineaments were extracted from Mt. Ijen with the mine strike direction observed at 140° SE in Figure 7C which was in agreement with the NW-SE faults zone in the rose diagram results. It was also reported that the results obtained through the field measurement had some discrepancies.
The verification process led to the measurement of four faults in four locations around Mt. Sinabung. The first fault evidence was located at Lau Kawar Lake in N200°E/75° direction as presented in Figure 8A and the value calculated for the structure was 31, N206°E, the second evidence was at the Payung Village River in N 47°E/55° and the value was 05, N04°E, the third location was the Gamber Village River in N50E°/20° with 06, N335°E, and the last location was Mardinding Village in N66°E/65° with 18, N 25° E as presented in Figure 8A. All the calculated values led to the categorization and identification of the locations as a right lag slip fault (Rickard, 1972). For Mt. Tangkuban Parahu, the bends of the river were observed and the lineament hills with 86° NE direction were used to present the lineaments detected by mSTA as presented in Figure 8B. Moreover, one fault plane was obtained for Mt. Ijen at Kalipait River with N 120° E / 76° direction as presented in Figure 8C and the value calculated was 28, N 118° E which was also identified as a right lag slip fault (Rickard, 1972).
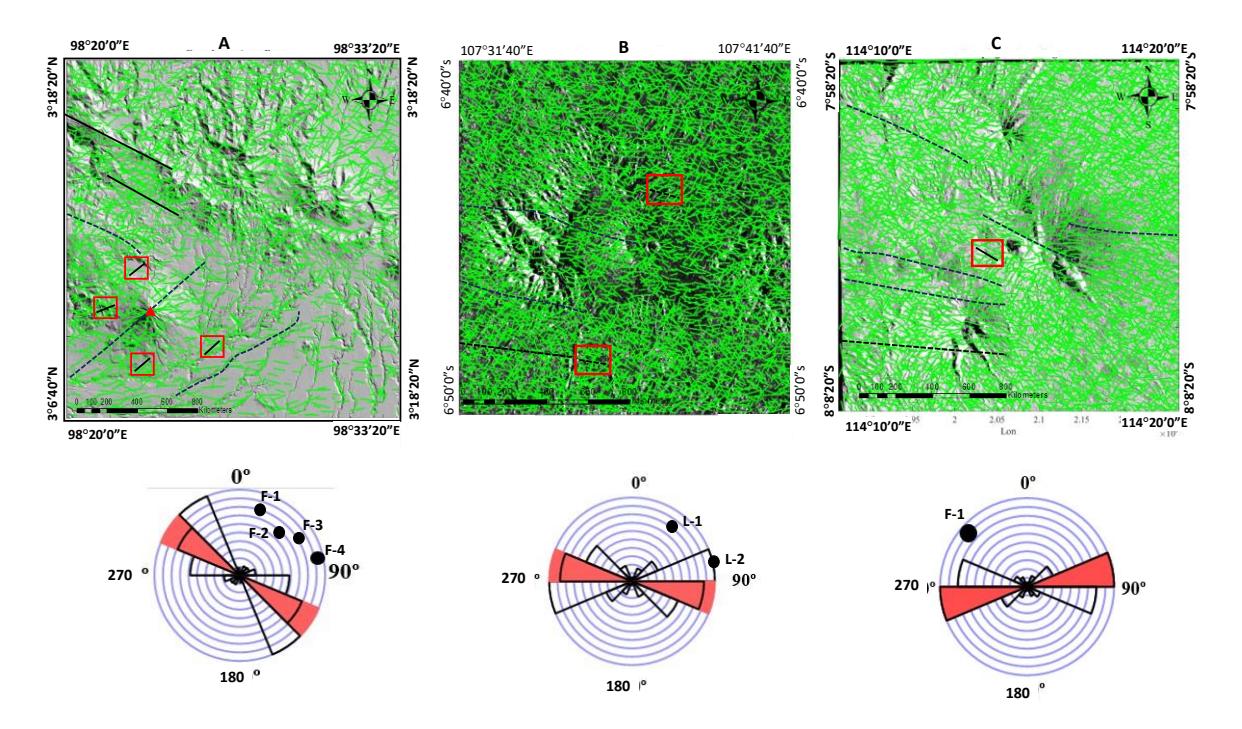
The extracted lineaments at Mt. Sinabung (A), Mt. Tangkuban Parahu (B), and Mt. Ijen (C) using the mSTA method with the rose diagrams show the lineament direction frequency. The directions of faults measured were represented by "F" v " " .
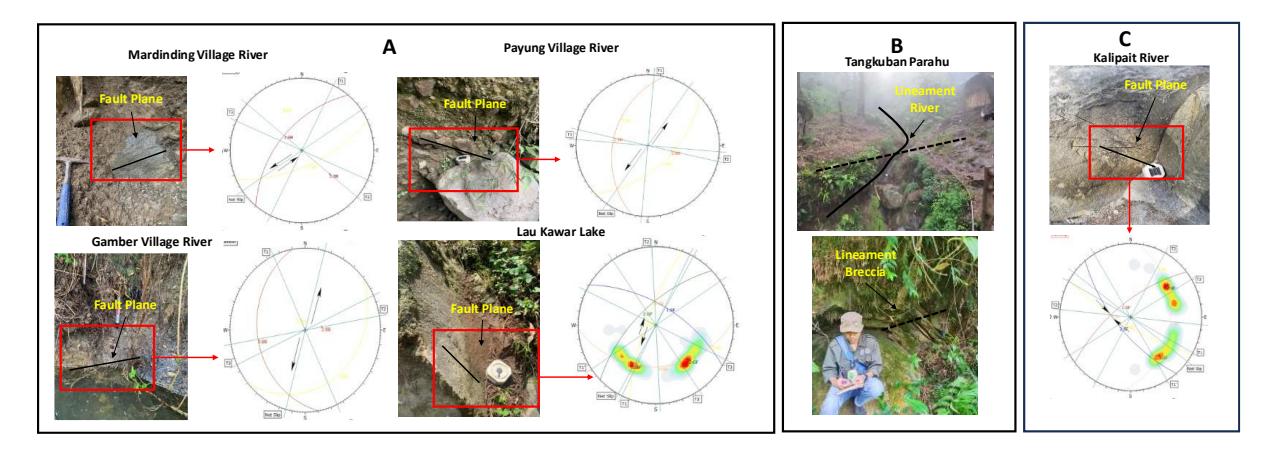
Figure 8 The faults plane measured at Mt. Sinabung using the stereonet diagram shows the right and left lag slip faults at Mardinding, Payung, Gamber Village River, and Lau Kawar Lake (A). The fault indicators are observed as breccia and river lineaments at Mt. Tangkuban Parahu (B). The fault plane measured at Mt. Ijen with the stereonet diagram shows the presence of right lag slip faults at Kalipait River (C).
The LST was verified by measuring the ground temperature at Mts. Sinabung, Tangkuban Parahu, and Ijen using Fluke II ground thermometer. The focus was on surface features such as the crater, steaming ground, and bare soil at an estimated depth of 20 cm. The results showed that the LST values were similar to the ground temperature measured. The correlation was further observed in the LST images showing values higher than 20°C around the summit as presented in Figure 9. For Mt. Sinabung, nine ground temperatures were evaluated around the summit and the correlation with the LST was determined based on the coefficient determination \(R^2\) which was recorded to be 0.72 in Figure 9A. Moreover, ten ground measurements were conducted at Mt. Tangkuban and the \(R^2\) was found to be 0.70 while the nine evaluated at Mt. Ijen had 0.71 as shown in Figures 9B and C respectively. The fact that the \(R^2\) values were higher than 0.7 showed that the LST significantly represented the field conditions (Ravand & Baghaei, 2016).
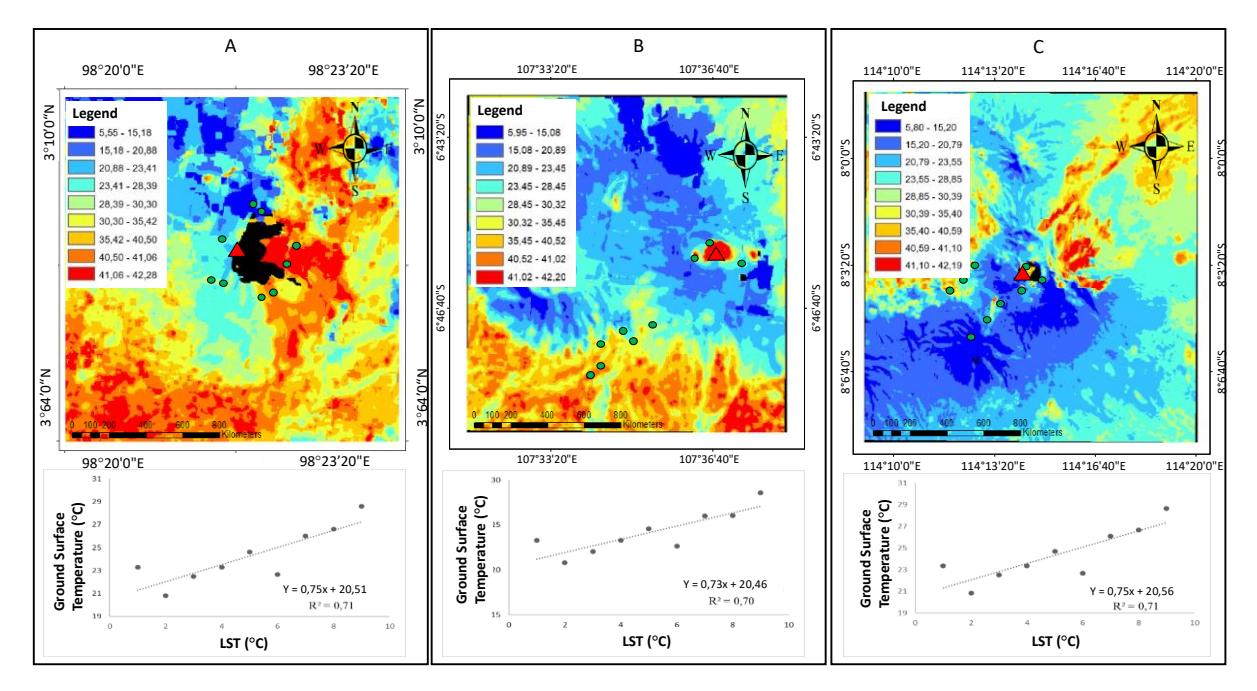
Figure 9 The LST map (top) and scatter plot between LST and ground surface temperature measured (bottom) at Mt. Sinabung (A), Mt. Tangkuban Parahu (B), and Mt. Ijen (C). The black portions are cloud masking while the red triangles and black dots are the summits of volcanoes and ground measurement points.
Discussion
The geological lineament density and LST were used to identify nine significant volcanic segments six and three volcano segments for Sumatra and Java Islands, respectively. The variation in the number was associated with the different subduction vectors in the Indo-Australian to Eurasian plates as presented by lineament direction which was observed to be rotating counterclockwise. Java is observed to be located at a tectonic plate margin known as the Sunda land block which subducts beneath the Eurasian Plate (Hall, 2012). Moreover, the oblique subduction vector from the Indo-Australian and Eurasian Plates caused complexity in the geological framework of Sumatra Island, leading to the occurrence of large earthquakes and frequent volcanic eruptions (Mulyana, 2006). Some transitional zones were identified in the direction and speed of the subduction slab between Java and Sumatra. The subductions were observed to be perpendicular towards Java, forming the Java Trench at a direction estimated at N 100°E and an oblique movement towards Sumatra to cause a Sumatra Trench at N 140°E. Furthermore, the geological phenomena obtained from these different subduction vectors were included in the development of the Great Sumatra Fault (GSF) system which was located longitudinally along the axis of Sumatra and eventually disappeared in the Sunda Strait to form normal faults or grabens as well as volcanic chains (Mulyana, 2006).
The influence of the tectonic framework was determined by overlaying the segments identified on the subducted slabs based on the dip as presented in Figure 6B. The differences in the subduction slab dips were observed to have affected the characteristics of the volcanic distribution and activities (Liu & Gao, 2023), leading to a variation in the type and volume of magma produced (Liu & Gao, 2023). Detail identified segment in this study has been listed in Table 2.
Table 2 Characteristics of the identified volcanoes segments in the Western Sunda Arc
| Segment | Volcanoes | Average Lineament Density | Average Land Surface Temperature | Average Dip Subduction Slab | Average Angle of the Lineament Strikes |
|---|---|---|---|---|---|
| 1 | Weh, Seulawah Agam, Peuet Sagoe, Burnitelong, Sembuang, Kembar | 207.83 | 23.36 | 22.871° | N 330° E |
| 2 | Sinabung, Sibayak, Toba, Imun, Helatoba-Tarutung, Sibualbuali, Lubuk raya | 202.96 | 20.84 | 28.253° | N 320°E |
| 3 | Sorik Marapi, Talakmau, Sarik-Gajah, Tandikat-Singgalang | 210.67 | 22.52 | 27.383° | N 320°E |
| 4 | Marapi, Sago, Talang, Kerinci, Hutapanjang, Sumbing, Kunyit, Pendan | 209.83 | 23.36 | 32.416° | N 310°E |
| 5 | Belirang-Beriti, Bukit Daun, Kaba, Dempo, Patah, Bukit Lumut Balai, Besar, Seminung (Ranau) | 197.90 | 24.69 | 33.241° | N 277°E |
| 6 | Sekincau Belirang, Suoh, Hulubelu, Rajabasa, Krakatau Karang, Pulosari, Endut, Kiaraberes Gagak, Perbakti, Salak, Gede, | 193.22 | 22.67 | 36.369° | N 270°E |
| 7 | Tangkuban Parahu, Tampomas, Ciremai, Patuha, Malabar, Guntur, Wayang Windu, Kendang, Papandayan, Galunggung, Karaha, Beureum | 182.78 | 26.09 | 36.369° | N 265°E |
| 8 | Slamet, Dieng, Sundoro, Sumbing, Ungaran, Muria, Telomoyo, Merbabu, Merapi, Lawu, Wilis, Kawi Butak, Kelud, Welirang, Arjuno Welirang, Penanggungan | 182.44 | 26.66 | 37.105° | N 270°E |
| 9 | Tengger, Bromo, Semeru, Lamongan, Lurus, Iyang-Argapura, Raung, Ijen, Baluran | 166.06 | 28.65 | 38.007° | N 260°E |
This led to the significant identification of the uniqueness associated with the geological frameworks and landforms. Furthermore, the heat detected by the sensor was from the thermal radiation produced by the magmatic system under the volcano which was caused by the partial melting process occurring at the top of the subducting slab. The results showed that the variations in the gradient slab led to disparities in the distance of the volcanoes as observed in steep gradient slabs producing short distances (Schminke, 2004). Therefore, the segments identified showed the significance of tectonics in the distribution of volcanoes as presented by thermal radiation obtained from the sensor in Figures 6B and 10B. The lineament detected through the mSTA method also represented the geological structures evolving due to tectonics in the Sunda Arc. This was observed from the fact that a high lineament length (Ll) density showed the accumulation of intensive geological structures such as faults, fractures, and damage zones. The fracture permeability further facilitated the ascent of magma above the subducting slab to the surface, leading to the formation of volcanoes. This phenomenon was evidenced by the high anomalies in Ll corresponding to the presence of volcanoes in Figures 4 and 10B.
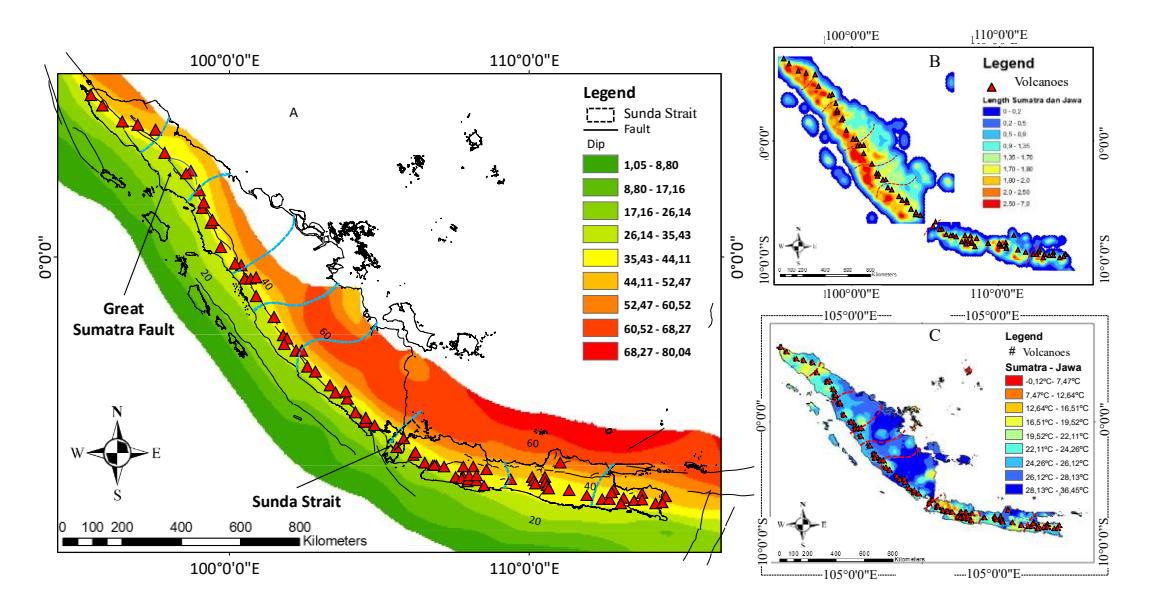
Figure 10 The nine segments identified are overlaid on the Sumatra and Java subduction slab model presented by dip (A), lineament length density (B), and interpolated land surface temperatures (C). The fault line originated from the Indonesian Geospatial Agency.
The results obtained were confirmed by calculating the density of the segmented volcanoes at a grid size of 50×50 km and extracting the midpoint of the slab dip. It was observed that the density of volcanoes correlated effectively with the slab dip as shown by the polynomial regression represented through the R² value of 0.95 in Figure 11A. Moreover, the values of the distribution density for volcanoes on Sumatra Island were 1 to 2 which were smaller than the 3 to 6 recorded for those on Java Island. The variations showed that the slab dip in Java was gentler than in Sumatra Island. The trend further showed slab dip as an important component in the distribution of volcanoes. This was observed from the fact that a high slab dip caused a denser distribution compared to the low ones (Schminke, 2004).
The volcanoes classified for each segment were related to the subduction process and geometry of the slab causing different zones of volcanic activity along the subduction path. The variability in the trend can be influenced by the slab dip, the depth of subduction, and the criteria of the plates (Liu & Gao, 2023). Moreover, the slab dip and rock type can affect magma migration paths and the location of volcanoes (Schminke, 2004). This study correlated the volcano distributions and the segments identified with the slab dip of subduction in Figure 11B. A gentle slab dip was observed to have produced volcanoes with high spacing distance. Meanwhile, a steep slab dip produced those with low spacing distance with some developing nested or complex volcanoes as reported in Mts. Papandayan, Guntur, Tangkuban Parahu, and Wayang Windu. It is recommended that further studies provide a more detailed analysis of the geometry and subsurface structure using the subsurface geophysical aspects of tomography data.
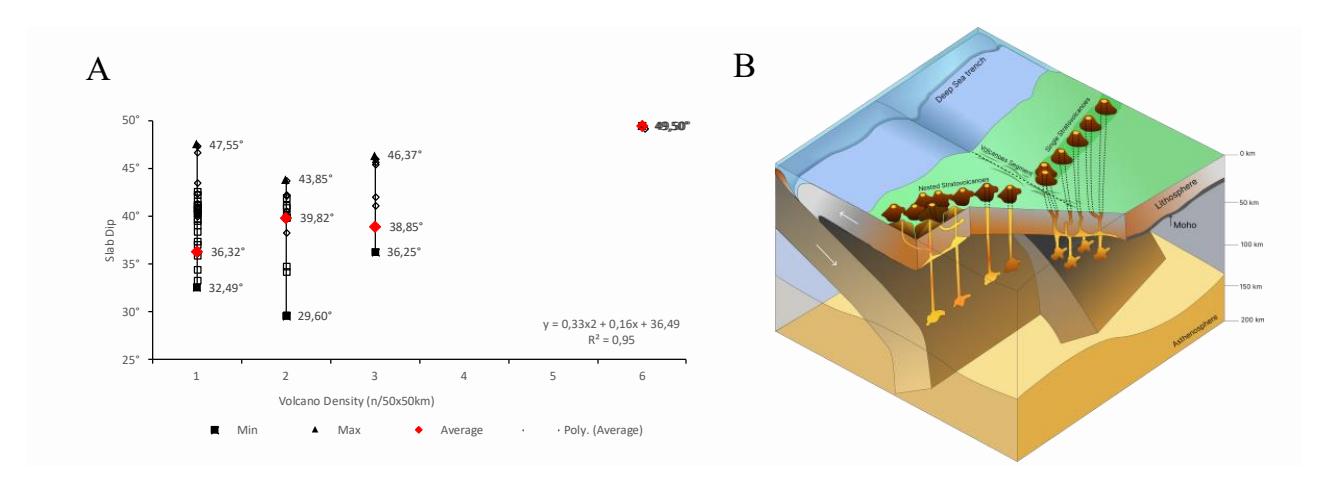
Figure 11 Scatter plot between subduction slab dip and volcano densities for 50x50 km grid size in Sumatra and Java Island (A) and the demonstration of subduction slab dip corresponding to the distribution of volcanoes in Sumatra and Java Islands modified from Schminke (2004) (B).
Conclusion
The modified Segment Tracing Algorithm (mSTA) method was successfully applied to extract the lineaments at Sumatra and Java using SRTM DEM data. A total of seven lineaments were verified through field geological observation at Mts. Sinabung, Tangkuban Parahu, and Ijen. Moreover, the orientation and density patterns of the lineaments were successfully classified into six and three segments for Sumatra and Java, respectively. The segments identified corresponded to the land surface temperature (LST) of these locations and were manifested by the distribution of the grouped volcanoes. Furthermore, the tectonics were responsible for the formation of the segments, as observed from the slab dip, which served as the boundary from Sumatra to Java Islands. This showed that the regional tectonic frameworks influenced the distribution of volcanoes and reflected the complexity of geodynamic processes occurring beneath the Earth's surface.
Acknowledgments
This research is fully supported by the LPPM ITB under the "Riset Unggulan" scheme. The authors express sincere gratitude to the National Research and Innovation Agency (BRIN) for the scholarship awarded which provided invaluable financial support to pursue this academic and research endeavors. The Center for Volcanology and Geological Hazard Mitigation (CVGHM) is also appreciated for facilitating the process of conducting the field surveys. Moreover, it is important to acknowledge that the modified Segment Tracing Algorithm (mSTA) code was granted by the owner of the copyright no. EC00202360205 issued by the Ministry of Law and Human Rights of Indonesia in 2023.
Compliance with ethics guidelines
The authors declare they have no conflict of interest or financial conflicts to disclose.
This article contains no studies with human or animal subjects performed by authors.