
Introduction
Cardiovascular diseases rank as the leading cause of global mortality (World Health Organization, 2021). There were an estimated 17.9 million such deaths in 2019, accounting for approximately 32% of all global mortality. In Vietnam, statistical data suggests around 200,000 annual deaths due to cardiovascular diseases, constituting approximately 33% of the total (Phạm, 2024). The early detection of cardiovascular and related diseases plays a crucial role in preventing, treating, or effectively controlling these conditions. Cardiac arrhythmias-typically detected through electrocardiogram (ECG) signals that reflect the cyclic activities of the heart-are considered indicative of various cardiovascular disorders.
Numerous methods based on artificial intelligence (AI) have been proposed for the detection and classification of cardiac arrhythmias. For instance, Khorrami and Moavenian (2010) propose the use of Wavelet and Discrete Cosine Transform (DCT) transformations to enhance the classification abilities of Multilayer Perceptron (MLP) and Support Vector Machine (SVM) networks for cardiac arrhythmia detection (Khorrami & Moavenian, 2010). BinMakhashen et al. (2014) employed Wavelet, DCT, and Principal Component Analysis (PCA) to train artificial neural network (ANN) models, subsequently fusing their outputs to make final decisions (BinMakhashen et al., 2014). Others have utilized 1-D convolutional neural network (CNN) models for the same purpose (Kiranyaz, Serkan, Turker Ince, 2016). One study applied FFT, DCT, and
Copyright ©2025 Published by IRCS - ITB J. Eng. Technol. Sci. Vol. 57, No. 4, 2025, 530-544 ISSN: 2337-5779 DOI: 10.5614/j.eng.technol.sci.2025.57.4.8
Discrete Wavelet Transform (DWT) to extract features from ECG signals for cardiac arrhythmia classification, based on the Random projection-Random forest (RP-RF) framework (Marasović & Papić, 2018). This research holds promise for practical applications of real-time ECG monitoring. Amirshahi & Hashemi (2021) employed spike-timing dependent plasticity (STDP) and reward-modulated STDP (R-STDP), which can be implemented on resource-limited microcontroller units (MCUs) (Amirshahi & Hashemi, 2021). Saadnatnejad et al. (2020) combined wavelet analysis and long short-term memory (LSTM) networks for ECG classification (Saadatnejad et al., 2020). Zhao et al. (2020) applied wavelet transformation to filter ECG signals before inputting them into a Deep CNN, which classified them into four groups: normal, atrial fibrillation, other abnormalities, and noise (Zhao et al., 2020). This approach achieved an accuracy of 87.1%. Thilagavathy et al. (2020) employed wavelet filtering for ECG preprocessing and an SVM for classifying cardiac arrhythmias (Thilagavathy et al., 2020). Liu et al. (2021) proposed a solution for classifying cardiac arrhythmias using an intrapatient CNN model and an interpatient attention residual network. Experimental results yielded an accuracy of 99.03% and demonstrated deployability on resource-constrained systems (edges) (M. Liu et al., 2021). Cai et al. (2021) utilized a combination of Feedforward Neural Network (FFNN) and CNN for real-time cardiac arrhythmia classification (Cai et al., 2021). Ullah et al. (2021) classified ECG signals using both CNN and a hybrid CNN–LSTM model (Ullah et al., 2021). Kumar & Chakrapani (2021) identified FFT frequency features of ECG for arrhythmia classification using AlexNet, achieving an accuracy of 99.7% (Kumar & Chakrapani, 2022). Elmir et al. (2023) utilized CNN with 2-D images generated by the Gramian Angular Field transform as an input to classify 10 types of ECG signals, achieving over 97% accuracy in detecting abnormal cardiac cycles (Elmir et al., 2023). Vu et al. (2023) proposed a CNN-based solution to convert ECG signals into images for classifying various cardiac arrhythmias. This system effectively classified 15 output labels (Vu et al., 2023).
Panwar et al. (2025) proposed a portable ECG monitoring system that utilizes the AD8232 sensor in combination with an Arduino Nano MCU to acquire and preprocess ECG signals; these can then be transmitted to a computer for analysis using a CNN model (Panwar et al., 2025). Li et al. (2025) developed a wearable ECG system to acquire ECG data using an STM32 and an ADS1292R sensor (Li et al., 2025). The acquired data was transmitted to a computer via Bluetooth Low Energy (BLE) and used to train a CNN–LSTM model for classifying arrhythmias, achieving an accuracy of 98.86%. Meanwhile, Liu et al. (2025) introduced ECG-STAR Net, a deep learning architecture that integrates LSTM, spatio-temporal convolution, and attention mechanisms to perform multi-label classification of ECG abnormalities (C. L. Liu et al., 2025). The model exhibited high performance on three benchmark datasets (PTB-XL, CPSC 2018, and G12EC), achieving AUC scores ranging from 0.91 to 0.97 and an F1-score of up to 0.817. These studies primarily focus on improving the efficiency of ECG classification based on popular AI network architectures. Additionally, some of the proposed CNN-based classification architectures run on hardware-constrained platforms to ensure practical applicability. However, evaluations only extend to analyzing deployment capabilities without direct testing on embedded systems.
Tiny machine learning (TinyML) enables the deployment of quantized AI models on hardware platforms with limited memory and computational capabilities. It is implemented using TensorFlow Lite and is increasingly applied to the practical deployment of machine learning models. TinyML has applications in various fields, such as motor type diagnosis (Khanh et al., 2022), blood pressure monitoring (Ahmed & Hassan, 2022; Sun et al., 2023), smart agriculture (Condran et al., 2022), and emotion recognition (Laureanti et al., 2020). Others have proposed a hardware platform consisting of a dual-core MCU to enhance the real-time efficiency of TinyML applications (Nguyen et al., 2023). The authors were able to efficiently utilize multi-core programming to optimize real-time data processing and execution of TinyML models on embedded systems. Applying TinyML to deploy ECG classification networks on embedded systems for direct patient monitoring is entirely feasible. However, further research is needed to determine appropriate input features and network structures.
Researchers have been seeking optimal solutions for signal classification systems implemented on embedded systems for real-time ECG monitoring. In several studies (Amirshahi & Hashemi, 2021; Cai et al., 2021; Kiranyaz, Serkan, Turker Ince, 2016; M. Liu et al., 2021; Marasović & Papić, 2018; Thilagavathy et al., 2020; Vu et al., 2023; Xing et al., 2022), ECG classification solutions have been proposed and their feasibility has been demonstrated for real-time execution on resource-constrained systems. Additionally, other reports (Farag, 2023; Saadatnejad et al., 2020) have proposed ECG classification models and performed real-time classification on resource-constrained systems. However, these studies only tested these applications on single-board computers (SBCs) integrating relatively powerful processors, such as the Raspberry Pi, Moto 360, NanoPi Neo Plus2, and Pi Zero. Other work (Caesarendra et al., 2022; Chowdhury & Chattopadhyay, 2023; Falaschetti et al., 2022; Kim et al., 2023) has proposed and experimented with CNN-based ECG classification solutions running on popular MCUs such as the Raspberry Pi Pico, Arduino Nano Sen, and ESP32. Chowdhury & Chattopadhyay (2023) utilized a 1-D CNN network with frequency spectrum images as an input, and achieved a peak abnormality detection rate of 91.2% in testing on embedded systems like Raspberry Pi Pico, Arduino Nano 33 BLE, and Teensy 4.0 (Chowdhury & Chattopadhyay, 2023). In contrast, others have employed a 2-D CNN network for the direct
classification of ECG time-domain signals, tested on the Arduino Nano 33 BLE kit, which officially supports TensorFlow Lite (Kim et al., 2023). They demonstrated an approximate 97% detection capability for abnormal ECG signals. Both studies (Chowdhury & Chattopadhyay, 2023; Kim et al., 2023) describe impressive results; however, they were primarily focused on detecting abnormalities in ECG signals, without conducting classification experiments. Other studies (Caesarendra et al., 2022; Falaschetti et al., 2022) employed RNN and CNN architectures for ECG classification.
Falaschetti et al. (2022) conducted real-time execution on an ARM Cortex-M4 CPU with speeds of up to 8 MHz, achieving a maximum accuracy of 90.2% (Falaschetti et al., 2022). However, the inference time was notably high, ranging from 821 to 2262 ms. Meanwhile, others have demonstrated real-time CNN classification of ECG on the SBC Jetson Nano (ARM A57, quad-core, 1.43 GHz) with higher accuracy, reaching 96%; however, inference times were not reported (Caesarendra et al., 2022). Hizem et al. (2025) proposed a real-time ECG anomaly detection method using TinyML on low-power devices such as Arduino and Raspberry Pi (Hizem et al., 2025). The Arduino is responsible for collecting ECG signals from the sensor and transmitting the data to the Raspberry Pi for inference. This system achieved an accuracy of 92.3%. Therefore, there remains a crucial need to develop an efficient ECG classification solution with high accuracy, low classification times, and the ability to run on low-power microcontrollers, with potential integration with affordable or Internet of Things (IoT) devices to support cardiovascular disease diagnosis.
In addition to using time-domain signals or frequency spectrum images, AI models have also been tested using features extracted from common transformations such as FFT, Continuous Wavelet Transform (CWT), DWT, DCT, or PCA to find the most effective classification solutions. For example, frequency features extracted by FFT transformation have been used in several studies (Kiranyaz, Serkan, Turker Ince, 2016; Kumar & Chakrapani, 2022). FFT features have also been used in conjunction with those from DWT, DCT, and PCA transformations to create composite features for training classification networks (BinMakhashen et al., 2014; Khorrami & Moavenian, 2010; Marasović & Papić, 2018). Others have exclusively used wavelet features for classification (Saadatnejad et al., 2020; Thilagavathy et al., 2020). All these studies yield highly accurate results. However, there has been no study directly comparing the effectiveness of using time-domain signals, FFT, DCT, and DWT with ANN or CNN networks on embedded systems. Doing so would help identify optimal solutions for an ECG classification system deployed on an embedded system, enabling the improved practical application of classification networks to support the diagnosis of cardiac arrhythmias.
The objective of this paper is to evaluate ANN- and CNN-based classification of ECG signals using time-series data, FFT, and fast DCT features using open ECG datasets. Several ANN and CNN network structures are proposed for experimentation, with inputs being time-series data and features generated from FFT and fast DCT transformations. Fast DCT was employed to reduce the transformation time of the original DCT algorithm, facilitating its application on embedded systems. The dataset of features generated from the FFT and fast DCT was created directly on the embedded system. The proposed networks were pre-trained on computers to determine the optimal structures before being quantized to evaluate real-time execution on the MCU. The accuracy of the models before and after quantization was compared and evaluated alongside inference time to identify the appropriate feature type and model for deployment on embedded systems.
Data and Methods
Data and Processing Method
This study utilized ECG datasets from the Massachusetts Institute of Technology (MIT)-Beth Israel Hospital (BIH) arrhythmia database and the Physikalisch Technische Bundesanstalt (PTB) diagnostic ECG databases. The ECG data in these datasets have previously been evaluated and classified on a per-cycle basis by cardiac experts, as illustrated in Figure 1(a). In this study, five types of cardiac electrical signals were classified, N, S, V, F, and Q. The morphologies of these signals are depicted in Figure 1(b), 1(c), 1(d), 1(e), and 1(f), respectively, and their meanings presented in Table 1.
Cardiac electrical data were subjected to low-pass and high-pass filtering, with cutoff frequencies set at 0.5 Hz and 40 Hz, respectively. They were subsequently segmented into QRS cycles, organized, labeled, and utilized for training and testing the ANN and CNN models. Two ECG cycle segmentation algorithms have been previously applied in published studies. The first identifies the R peak, taking corresponding samples before and after the peak to obtain a 360-sample cycle (Kim et al., 2023; Kumar & Chakrapani, 2022; Vu et al., 2023; Xing et al., 2022). The second uses 1.2 average R-R cycles and padding with additional data to achieve 180 samples (Elmir et al., 2023; Fikri et al., 2021; Ullah et al., 2021). In this study, the first method is employed for ECG data segmentation. However, both methods could be implemented and deployed on MCUs for real-time ECG signal classification in the future.
Label/ Wave Action N N: normal beat, atrial escape beat, junctional escape beat; L: Left bundle branch block beat; R: Right bundle branch block beat. S Atrial premature beat, aberrated atrial premature beat, junctional premature beat, supraventricular premature beat V Premature ventricular contraction, ventricular escape beat F Fusion of ventricular and normal beat Q Paced beat, fusion of paced and normal beat, unclassifiable beat
Table 1 Descriptions of N, S, V, F, and Q waves.
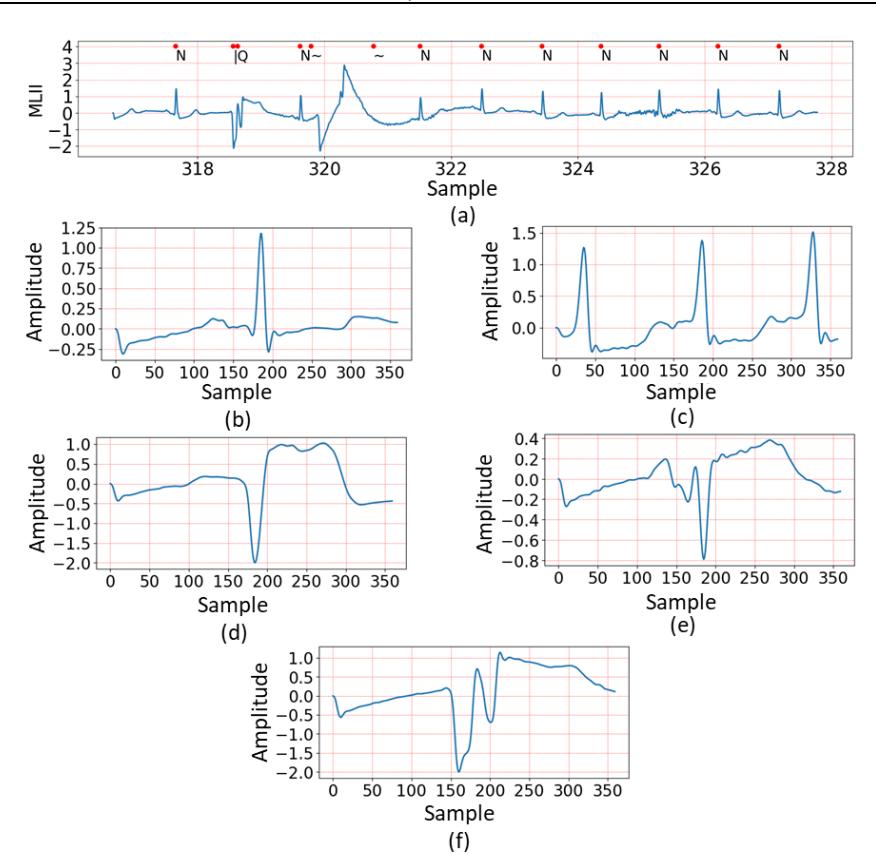
Sample waveform of ECG data: (a) ECG data with label marked by cardiologists, (b) N label, (c) S label, (d) V label, (e) F label, and (f) Q label.
Method
This study aimed to compare the classification performance of various cardiac arrhythmias implemented on embedded systems with limited computational capabilities. Figure 2 illustrates the training and deployment process of the ECG classification system using ANN and CNN models. In the first stage, ECG data were processed using two feature extraction methods: Fast DCT and FFT. These features were used to create training and testing datasets, which were then fed into the proposed ANN and CNN models, which learned to classify ECG signals into five heartbeat categories: N, S, V, F, and Q. After training, the models were optimized through quantization to reduce computational complexity. In the second stage, ECG signals were obtained from an SD card, underwent the same feature extraction process using Fast DCT and FFT, and were then introduced into the quantized ANN and CNN models for real-time classification and evaluation. ECG data for both processes were obtained from the MIT-BIH Arrhythmia database.
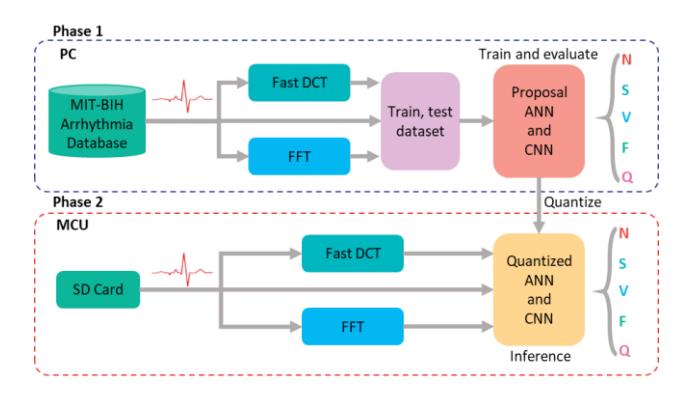
Figure 2 Overall Methodology.
FFT Transform
Frequency features of ECG derived from the FFT have been proposed as a basis for ECG classification. FFT is one of the fundamental transformations in digital signal processing, widely used for analyzing the frequency components of signals, filtering, and signal compression. The discrete Fourier transform (DFT) is an algorithm for converting a signal from its original domain (typically time) to the frequency domain and vice versa. Frequency components are obtained by decomposing the signal into a sequence of sine and cosine components at different frequencies. Assuming the cardiac electrical signal is sampled at 360 points per cycle (as in this study), it can be represented as a time series \(x_0, x_1, \ldots, x_{N-1}\) with N=360. The DFT of this series is defined by Eq. (1):
\[X_k = \sum_{n=0}^{N-1} x_n e^{-\frac{i2\pi kn}{N}}, k = 0, \dots, N-1\] (1)
The DFT offers much more efficient computation compared to the FFT (Marasović & Papić, 2018), making it highly suitable for application on embedded systems. The number of frequency components analyzed is symmetric, so the number of features obtained will be half compared to those in the time domain, resulting in smaller ANN or CNN network structures. The KissFFT library (Mborgerding, 2021)—developed for implementing DFT on MCUs and operating effectively with data whose length differs from 2<sup>n</sup>—was used in this study.
Fast DCT and Implementation on MCU
DCT is known as a signal classification tool used to compress a signal based on its energy property. DCT concentrates the signal energy into a small number of main coefficients to enable signal compression with very low data loss rates. For ECG signals, (BinMakhashen et al., 2014) demonstrated that the first 20% of DCT coefficients are sufficient to recover the original signal, and that the approach was effective for classifying features of cardiac electrical signals. However, the conversion time major drawback of DCT when deployed on embedded systems is its conversion time. The standard DCT conversion has a very large conversion time. The authors directly tested it with ESP32 MCU using the library (Nayuki, 2018), and the total conversion time for one 360-sample cardiac cycle took more than 1.6 seconds. Therefore, it is not feasible to apply DCT directly to embedded systems.
However, fast DCT algorithms have been proposed to overcome this limitation. The fast DCT algorithm type II, based on the FFT algorithm (Makhoul, 1980), has been demonstrated to significantly reduce the computation time of DCT on MCUs. This fast DCT conversion algorithm is based on an N/2 point DFT, resulting in a substantial improvement in computation time. The mathematical representation of the fast DCT is given by Eqs.(2) and (3):
\[C(k) = 2\sum_{n=0}^{N-1} v(n) \cos \frac{\pi(4n+1)k}{2N}, 0 \le k \ge N-1\] (2)
\[v(n) \begin{cases} x(2n), & 0 \le n \le \left[\frac{N-1}{2}\right] \\ x(2N-2n-1), & \left[\frac{N-1}{2}\right] \le n \le N-1 \end{cases}\] \[(3)\]
In which, \(x_0, x_1, \dots, x_{N-1}\) represents one cycle (beat) of the ECG signal, and \(\left\lceil \frac{N-1}{2} \right\rceil\) denotes the integer part of \(\frac{N-1}{2}\).
A library implementing the fast DCT algorithm based on this mathematical representation has been developed (Mborgerding, 2021), and the results are not scaled. This algorithm is not specifically tailored for microcontrollers, and it operates ineffectively with input lengths that differ from 2<sup>n</sup>. So, a modified fast DCT algorithm based on the KissFFT library was also implemented to compare with the initial library (Song et al., 2023) and find the optimal solution to the issue of conversion time. Utilizing only a small number of coefficients with large energy would significantly reduce the complexity of ANN and CNN-based classification networks. This could be crucial in enabling these networks to run on microcontrollers with limited memory and computational resources.
ECG Classification based on ANN and CNN Models
This research aimed to evaluate the classification of ECG signals using time-domain data, FFT, and DCT features with ANN and CNN models implemented directly on MCUs with limited computational resources. Both ANN and CNN were implemented on the MCU using TinyML. They were designed and trained on a PC before being quantized and executed on the MCU using TensorFlow Lite. Each type of data (time-series, FFT, and DCT) was classified using the same ANN and CNN network architectures. Their names are presented in Table 2. There were a total of 6 cases to be trained with two proposed ANN and CNN network architectures. Each case was conducted and measured on the MCU for comparison and evaluation. The comparisons and evaluations of this study will serve as a foundation for further research on ECG classification in resource-constrained embedded systems. The FFT and DCT algorithms were also implemented on the MCU instead of being precomputed, to facilitate their applicability for research.
Table 2 Name of ANN and CNN models.
| Input type | Time-series data | FFT feature | DCT feature |
|---|---|---|---|
| ANN | ANN-TIME | ANN-FFT | ANN-DCT |
| CNN | CNN-TIME | CNN-FFT | CNN-DCT |
This study also classified five different labels of ECG, including N, S, V, F, and Q, as presented in Table 1. The waveform patterns of these are presented in Figure 1. Assuming the output vector of the classification network is \(C = \{N, S, V, F, Q\}\), the ECG classification networks were trained by the training and testing datasets described as follows:
\(X \in \{x_i, Y_i | 1 \le i \le m\}\), where \(Y_i \in C\), m is the number of data divided into training or testing sets, \(x_i\) is a one-dimensional vector containing time-series data or features extracted using FFT and DCT of the ECG. The ANN and CNN networks with parameter \(\theta\) can be described in general by Eq.(4):
\[F(X|\theta) = f_n(\dots f_3(f_2(f_1(X|\theta_1)|\theta_2)|\theta_3)|\dots|\theta_n)\] (4)
In which, \(f_j(X|\theta_j)\), \(j \in n\), represents the \(j^{th}\) layer of the network consisting of n layers. The general structure of the ANN and CNN was proposed as shown in Figure 3. Figure 3(a) illustrates the overall structure of the ANN. The network comprised three hidden layers with the corresponding number of neurons being 12, 64, and 32, respectively. Each hidden layer was connected to a batch normalization (BN) layer followed by a dropout layer. The BN layer was added to accelerate the training speed and stabilize the network (Song et al., 2023), and its outputs \(BN_i\) are computed by Eq.(5):
\[BN_i = \gamma \frac{L_i - \mu}{\sqrt{\sigma^2 + \varepsilon}} + \beta \tag{5}\]
In which, \(L = [L_1, L_2, ..., L_i]\) is the input vector of BN, \(\varepsilon\) is a very small constant, \(\mu\) and \(\sigma\) are the mean and variance of L calculated by Eqs. (6) and (7):
\[\mu = \frac{1}{m} \sum_{i=1}^{m} L_i \tag{6}\]
\[\sigma^2 = \frac{1}{m} \sum_{i=0}^{m} (L_i - \mu)^2 \tag{7}\]
The dropout layers were used to mitigate overfitting, utilizing the same rate of 30%. Figure 3(b) illustrates the general structure of the CNN. The CNN consisted of three convolutional layers interleaved with max-pooling layers, serving the role of feature extraction from the input. The number of features in each convolutional layer was 8, 16, and 32, respectively. The BN and dropout layers were also added to the CNN with parameters depicted in Figure 3. The outputs of these neurons used the rectified linear unit (ReLU) activation function. The CNN network employed 2D convolutions and max-pooling because TinyML operates on the TensorFlow Lite platform, which does not yet support 1D convolutions and max-pooling (Kim et al., 2023). To make the input data compatible with 2D convolutions and max-pooling, they were reshaped into a 1xN 2D form before being fed into the ANN or CNN. The mathematical representation of 2D convolution is given by Eq. (8):
\[f_i(X_i|\theta_i) = h(W * X_i + b) \tag{8}\]
There, W is the set of kernels or filters, h(.) and b correspond to the activation function and bias value, respectively. The formula for the ReLU activation function is given by Eq. (9):
\[h(x) = max(0, x) \tag{9}\]
Following the flatten layer was an ANN consisting of two hidden layers with 32 and 16 neurons, respectively. The output of these hidden layers also utilized the ReLU activation function. Following each of these hidden layers were BN and dropout layers applied consecutively, serving the same purpose as in the ANN. Both the proposed ANN and CNN models had five output neurons for classifying the five ECG labels. These output neurons used the Softmax activation function, defined by Eq. (10):
\[f(z) = \frac{e^{Z_i}}{\sum_j e^{Z_j}} \tag{10}\]
Where, f(z) lies in the range from 0 to 1, \(z_i\) is the inferred score of each class in C, and \(\sum_j e^{z_j} = 1\). Both the ANN and CNN networks used the categorical cross-entropy (CE) loss function, which is defined by Eq. (11):

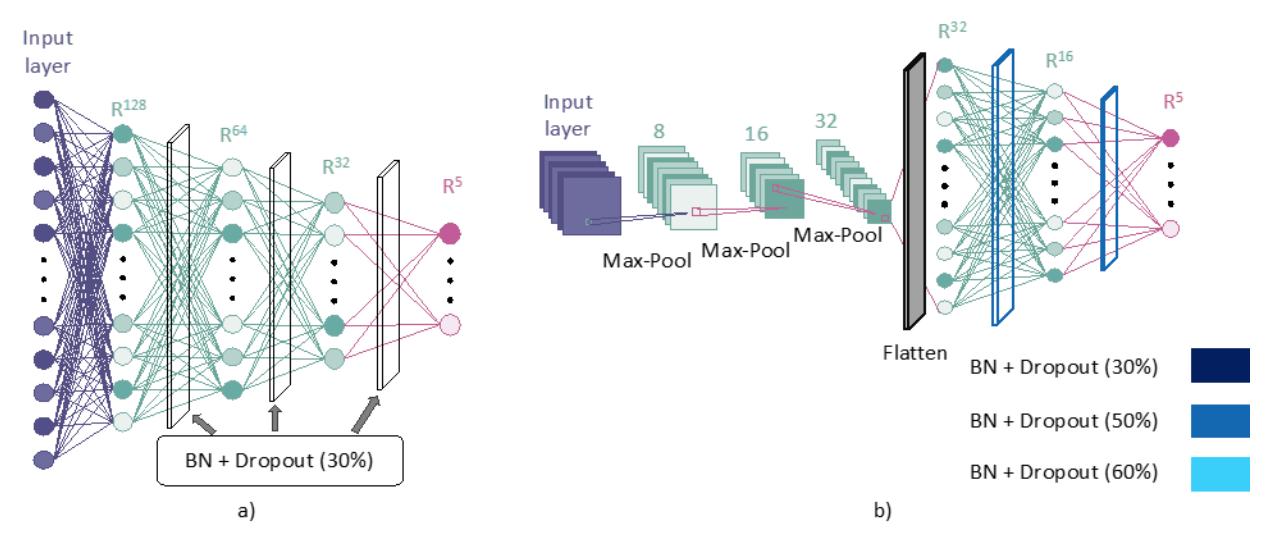
Figure 3 Structure of the proposed models: (a) ANN and (b) CNN.
The training process was optimized based on the first-order gradient-based optimization algorithm Adam, with a learning rate of 0.0001, trained for 500 epochs. The ECG data in the database was divided into 3 sets: Train, Validation, and Test, with the corresponding quantities for each label presented in Table 3. The Train and Validation sets were used to train the ANN and CNN models, while the Test set was used to evaluate the trained models. After training, the models were quantized and tested with the Test set to compare them with the pre-quantization models. This post-quantization model was also deployed on an MCU to assess real-time deployment capabilities on embedded systems.
Table 3 ECG datasets summary.
| N | S | ٧ | F | Q | Total | |
|---|---|---|---|---|---|---|
| Train | 10,000 | 2,147 | 5,245 | 574 | 2,815 | 20,781 |
| Validate | 7,224 | 273 | 538 | 67 | 300 | 8,402 |
| Test | 4,000 | 606 | 1,446 | 161 | 779 | 6,992 |
Metrics such as macro precision (\(P_{macro}\)), macro recall (\(R_{macro}\)), macro F1 (\(F1_{macro}\)), and accuracy were used to evaluate the ANN and CNN networks after training and quantization. Their mathematical representations are presented in the following formulas, given by Eqs. (12) to(15):
\[Accuracy = \frac{TP + TN}{TP + FP + FN + TN}.100\%\] (12)
\[P_{macro} = \frac{1}{N} \sum_{j} \frac{TP_{j}}{TP_{j} + FP_{j}}.100\%\] (13)
\[R_{macro} = \frac{1}{N} \sum_{j} \frac{TP_{j}}{TP_{j} + FN_{j}}.100\%\] (14)
\[F1_{macro} = 2.\frac{P_{macro} \cdot R_{macro}}{P_{macro} + R_{macro}}.100\%\] (15)
In which TP, FP, FN, and TN stand for true positive, false positive, false negative, and true negative, respectively. In addition to these evaluation metrics, the inference time of the ANN and CNN networks was also measured and evaluated directly on the MCU. An ESP32 microcontroller was used to conduct experiments.
To evaluate the performance of the classification model, the receiver operating characteristic (ROC) curve was used to illustrate the relationship between the true positive rate (TPR) and the false positive rate (FPR) (Song et al., 2023). Eqs. (16) and (17) below define how TPR and FPR were calculated for each class.
\[TPR = \frac{TP}{TP + FN} \tag{16}\]
\[FPR = \frac{FP}{FP + TN} \tag{17}\]
Results
Analysis FFT
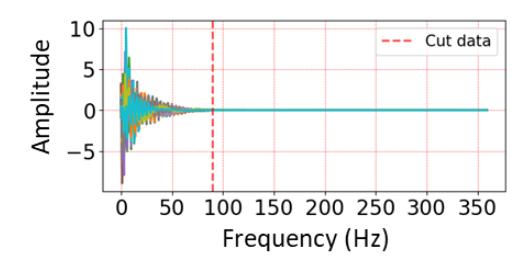
Figure 4 illustrates the FFT features of ECG cycles classified as N, S, V, F, and Q, with each FFT output consisting of 180 values corresponding to frequency components. Waves S, V, and Q have relatively similar spectral distributions. Both N and F exhibit significant differences. Figure 4(f) shows the frequency distribution of all ECGs. All frequencies higher than 50 Hz are depicted as zero, so only the first 50 FFT features were selected to reduce the size of both ANN and CNN networks.
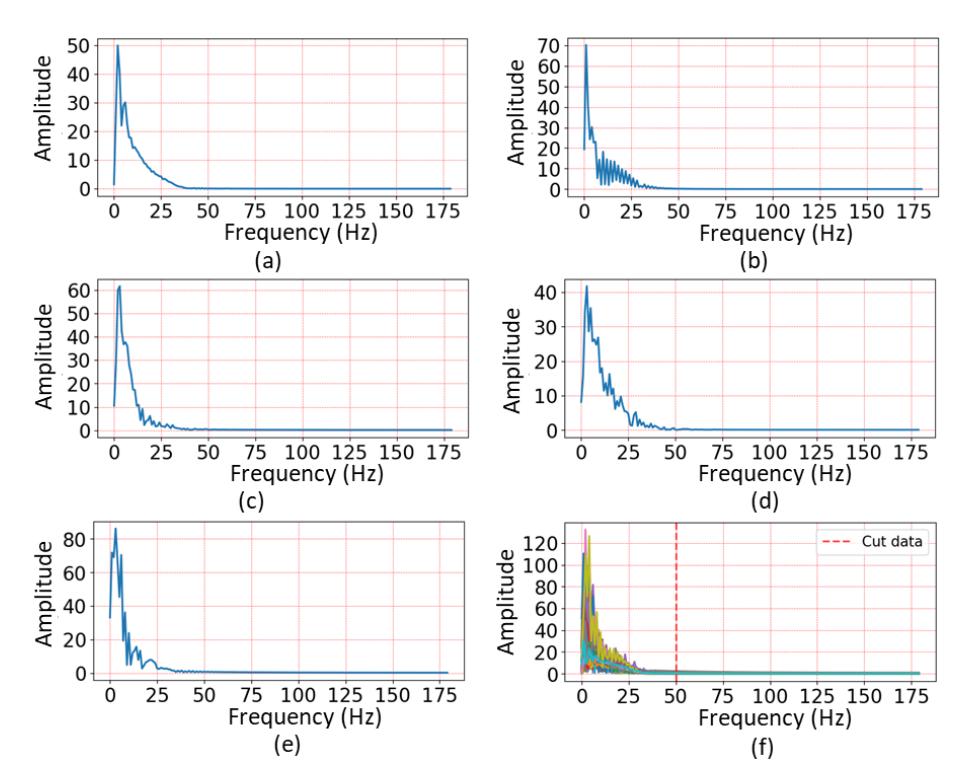
FFT transform results of ECG labels: (a) N, (b) S, (c) V, (d) F, and (e) Q waves, and (f) all labels.
Fast DCT
The forward DCT conversion times for one ECG cycle of 360 samples using the original DCT algorithm, the DCT algorithm based on the Nayuki library (Nayuki, 2018), and the modified DCT algorithm based on the KissFFT library were approximately 1.630, 0.115, and 0.021 seconds, respectively. The modified DCT algorithm provided the fastest conversion time, 5.5 times faster than the Nayuki library (Song et al., 2023) and 78 times faster than the original DCT. Consequently, the modified DCT algorithm was subsequently applied to generate DCT features for ANN and CNN models on microcontrollers. As mentioned, it is unnecessary to use all DCT coefficients as inputs for ANN and CNN networks. The DCT features of all ECGs are visualized in Figure 5. Based on this graph, only the first 90 DCT coefficients were selected for use, rather than the entire set. In other words, the final ANN and CNN networks were smaller in scale, making them suitable for deployment on resource-constrained MCUs in terms of memory and computation.
Visualization of DCT features of all ECGs.
Classification Results
The number of trainable parameters of the proposed ANN and CNN models is summarized in Table 4. The two ANN and CNN networks with time-series data input had the highest number of trainable parameters due to their longer input length. The networks with DCT feature inputs had the fewest parameters because their input length was restricted to 90. Figure 6 presents the changes in accuracy and loss after 500 epochs. The results show that the proposed ANN and CNN networks all exhibited overfitting. Specifically, the ANN networks with time-series data input had the lowest level of overfitting, while ANN-DCT exhibited the most.
Table 4 Number of trainable parameters of proposed ANN and CNN models.
| ANN | CNN | ||
|---|---|---|---|
| Time | 150,821 | 52,805 | |
| DCT feature | 85,637 | 19,013 | |
| FFT feature | 75,397 | 13,893 |
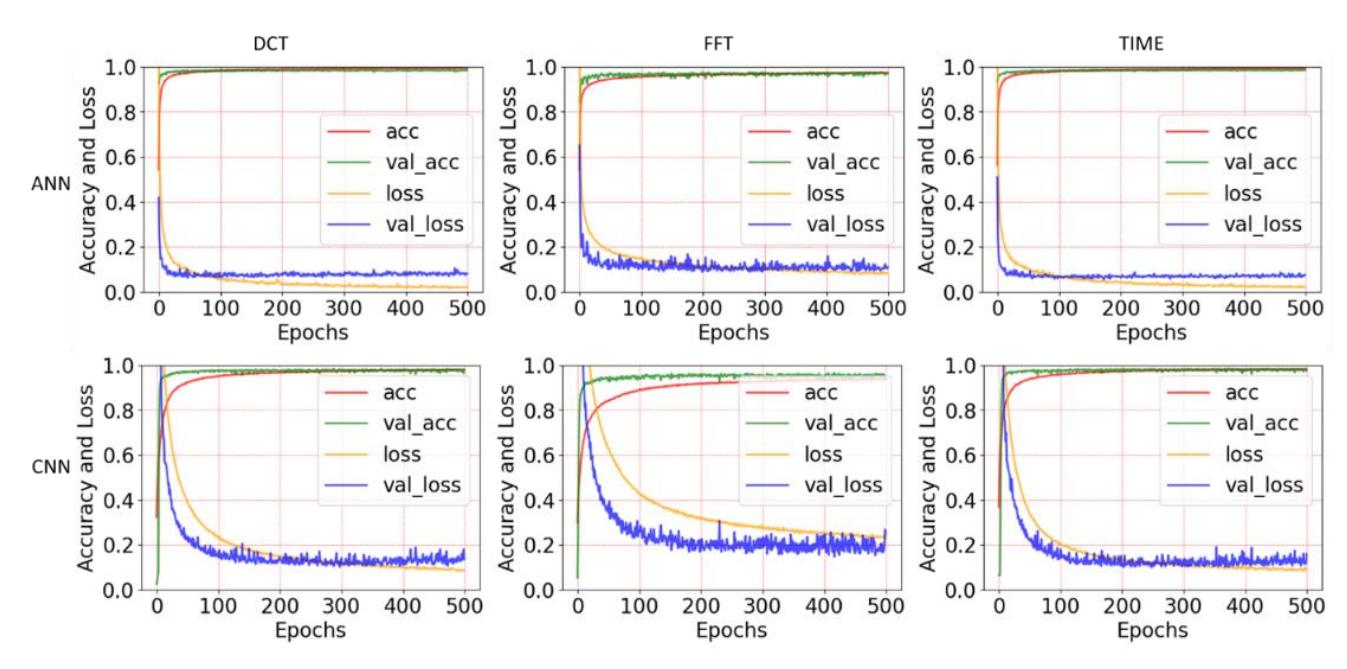
Accuracy and loss of the training process of the proposed ANN and CNN models using training sets of time-series data, FFT features, and DCT features.
The trained ANN and CNN models were quantized for deployment on the MCU to evaluate accuracy and computational speed. This study used fully integer-only quantization, where all weights, activations, inputs, and outputs of the model were statically quantized into 8-bit signed integers using a representative training set (Farag, 2023). Therefore, the input data of the quantized models was scaled accordingly, using Eq. (18):
\[qx_i = \frac{x_i}{input\_scale} + input\_zero\_point\] (18)
Where, qxi is the i-th quantized value of the input xi, with i ranging from 0 to 359, and input_scale and input_zero_point are constants obtained from statistical analysis of the training set during the quantization process of the ANN and CNN models. Their values are presented in Table 5.
Table 5 Value of input_scale and input_zero_point of using datasets.
| Input scale | Input zero point | |
|---|---|---|
| Time | 0.019 | 111 |
| DCT feature | 0.071 | 127 |
| FFT feature | 0.568 | 0 |
The quantized models, after training, were also tested with input data quantized based on the formula above. This testing can be performed directly on a computer using the quantized model instead of running on the MCU. The Pmacro, Rmacro, and F1macro scores were also calculated for the models before and after quantization for comparison, as the test data is imbalanced. The accuracy of the ANN and CNN models before and after quantization is presented in Table 6. The results show that before quantization, both models exhibited similar accuracy, each above 93%. However, after quantization, the accuracy of these models was reduced, especially the ANN-FFT model, which dropped to only 65.6%. The ANN-TIME and CNN-TIME achieved the highest accuracy after quantization, at 97.1% and 95.8%, respectively. The ANN-DCT had a slightly lower quantized accuracy of 95.6%. These results indicate that the DCT feature is effective in ECG classification in both ANN and CNN structures. Furthermore, the results suggest that for the 8-bit signed integer quantized models, ANN structures should be utilized directly for ECG classification instead of CNN structures.
The Pmacro, Rmacro, and F1macro parameters of the models before and after quantization are presented in Tables 7 and 8. Table 7 shows that before quantization, all models had macro parameters greater than 92%, except for CNN-FFT, which was below 89%. After quantization, all macro parameters decreased, as shown in Table 8. ANN-TIME exhibited the best macro parameters, followed by ANN-DCT. The macro parameters of ANN-FFT decreased significantly, all to below 63%. Figure 7 presents the confusion matrices of six ANN and CNN models before and after quantization. These results indicate that ANN is the most suitable model for ECG classification on the MCU, and the data should be based on either time-series or DCT features.
Figure 8 presents the ROC curves of the ANN and CNN models using three types of input features—time, DCT, and FFT both before and after quantization. For the ANN model, the time-domain input yielded consistently high performance, with area under the curve (AUC) values ranging from 0.92 to 1.00 before quantization. After quantization, the model maintained stable performance, with minimal degradation of the AUC, particularly for classes Q and N, which retained values close to 1.00. When using DCT features, the ANN model also demonstrated strong class separability, with all AUC values exceeding 0.93 both before and after quantization. This indicates that the model is robust and generalizes well with DCT-transformed data. In contrast, the FFT features suffered a significant decline in performance post-quantization. Although AUC values ranged from 0.88 to 0.99 before quantization, several classes dropped below 0.60 afterward, most notably class F (AUC = 0.50), suggesting a severe loss of information due to model compression. For the CNN model, performance remains more stable after quantization compared to the ANN. With both time-domain and DCT features, AUC values were largely unchanged, consistently ranging from 0.88 to nearly 1.00 across all classes. Although some drop in AUC was observed with FFT features, the decline was less severe than in ANN, with the lowest AUC still above 0.83.
Table 6 Overall accuracies of the proposed ANN and CNN models before and after quantization.
| Accuracy (%) | Accuracy post-trained (%) | |||||
|---|---|---|---|---|---|---|
| DCT | FFT | Time | DCT | FFT | Time | |
| ANN | 98.0 | 95.8 | 98.0 | 95.6 | 65.6 | 97.1 |
| CNN | 96.9 | 93.0 | 97.0 | 94.9 | 90.0 | 95.8 |
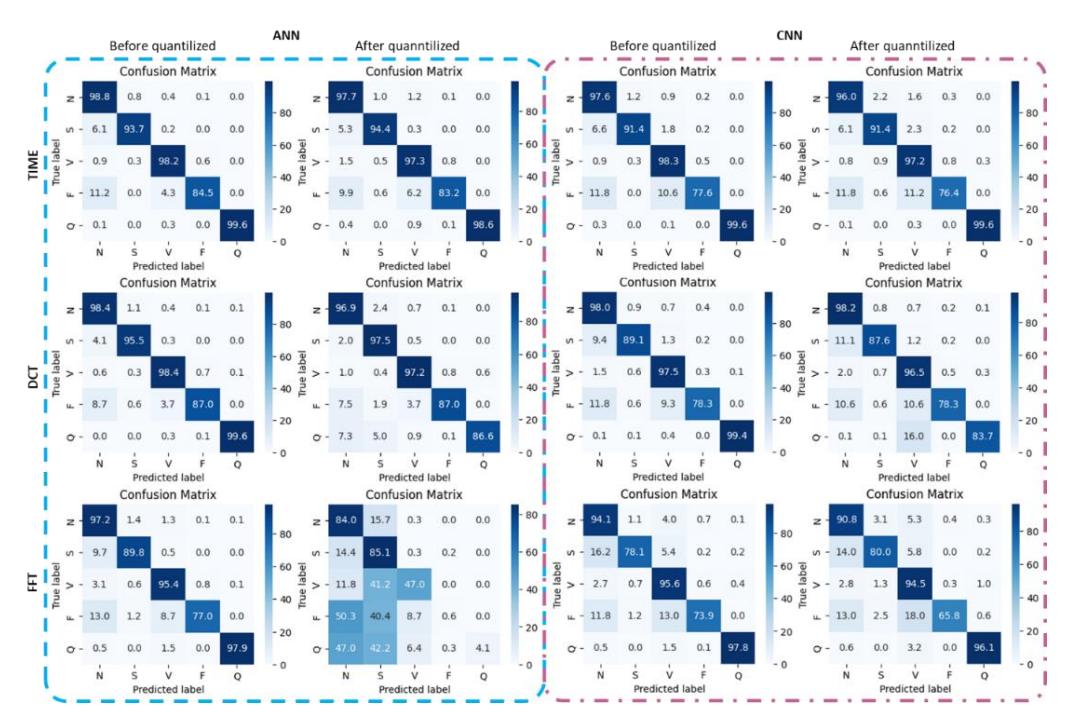
Confusion matrices of the proposed ANN and CNN models before and after quantization.
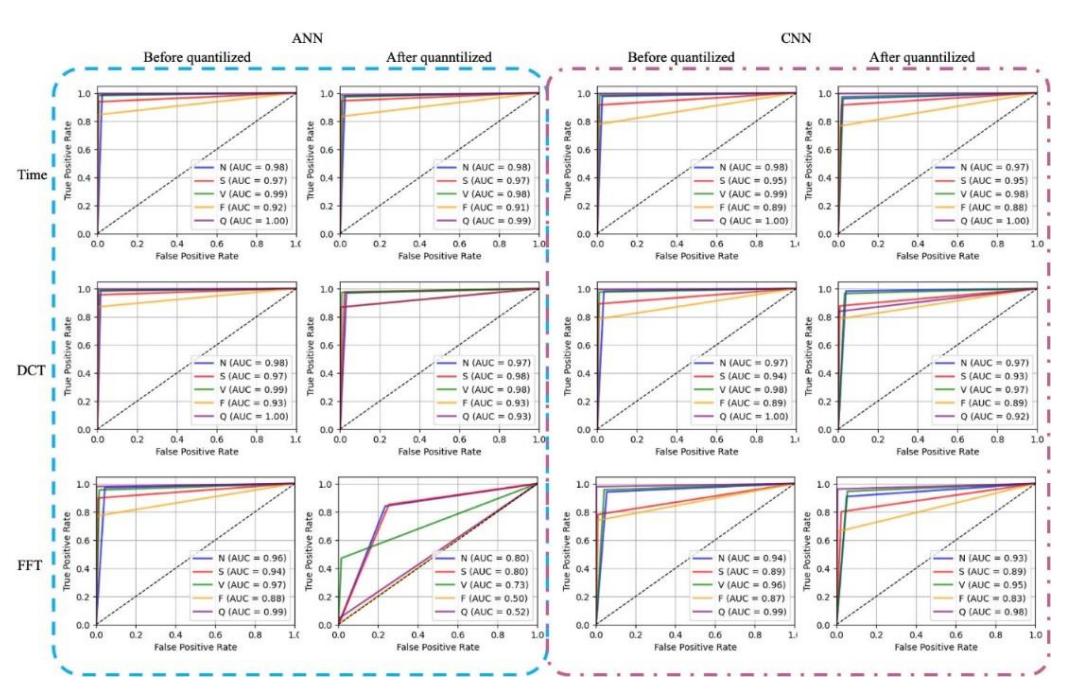
ROC curves of ANN and CNN models using Time, DCT, and FFT features before and after quantization.
Table 7 Pmacro, Rmacro, and F1macro values of the proposed ANN and CNN models before quantization.
| ANN-DCT | ANN-FFT | ANN-TIME | CNN-DCT | CNN-FFT | CNN-TIME | |
|---|---|---|---|---|---|---|
| Pmacro | 95.8 | 91.5 | 95.0 | 92.5 | 87.9 | 92.9 |
| Rmacro | 95.8 | 94.0 | 96.6 | 94.4 | 89.2 | 94.6 |
| F1macro | 95.8 | 92.6 | 95.8 | 93.4 | 88.4 | 93.7 |
Table 8 Pmacro, Rmacro, and F1macro values of the proposed ANN and CNN models after quantization.
| ANN-DCT | ANN-FFT | ANN-TIME | CNN-DCT | CNN-FFT | CNN-TIME | |
|---|---|---|---|---|---|---|
| Pmacro | 93.0 | 44.2 | 94.2 | 88.9 | 85.5 | 92.1 |
| Rmacro | 92.8 | 63.3 | 95.1 | 93.0 | 86.8 | 91.1 |
| F1macro | 92.7 | 38.4 | 94.6 | 90.7 | 85.8 | 91.9 |
The accuracy and macro parameters of the quantized models were tested on a PC to save time, as they yield the same results as testing on the MCU. However, the execution time of the networks must be assessed directly on the MCU. The execution time was collected and compared between all models, with each of the six deployed and tested on the MCU. The ESP32 microcontroller was chosen to test the inference time of the models because TensorFlow Lite is officially supported. The test results may serve as a benchmark for evaluation on other MCUs.
The algorithm used for testing the execution time of models is illustrated in Figure 9. Time-series data were directly declared in the program as constants. If the network used FFT and DCT features, the time series was converted to FFT or DCT features on the MCU. The inference time of a model is equal to the FFT or DCT conversion time (if applicable) plus the model inference time. The system time was read before data conversion and read again immediately after the execution of the model. The time difference was treated as the inference time of the model.
Inference Time (ms) DCT FFT Time ANN 28.4 20.8 21.5 CNN 59.6 50.0 173.0
Table 9 Inference times of the proposed ANN and CNN models on the ESP32 MCU.
Algorithm of real-time testing program on ESP32 MCU.
The results of the inference time evaluation are presented in Table 9. The results show the fast inference times of the proposed ANN models, ranging from 20.8 to 28.4 milliseconds. However, ANN-FFT cannot be applied, due to the significant reduction in accuracy after quantization. The inference times of CNN-DCT, CNN-FFT, and CNN-TIME networks were 59.6 ms, 50.0 ms, and 173 ms, respectively. Therefore, ANN-TIME and ANN-DCT were the most efficient ECG classification networks in terms of real-time execution and accuracy. Considering the processing speed of one ECG cycle, all proposed CNN networks could feasibly be used for real-time processing, as the average human heart rate can reach up to 150 beats per minute (Song et al., 2023), corresponding to a minimum heartbeat interval of 400 milliseconds. Moreover, the proposed ANN models would allow direct deployment on microcontrollers with limited memory resources.
Discussion
Table 10 summarizes and compares studies of ECG classification models that can be deployed on edge devices. Most of these studies have focused on proposing models and demonstrating their deployability on such devices (Amirshahi & Hashemi, 2021; Cai et al., 2021; Farag, 2023; Kiranyaz, Serkan, Turker Ince, 2016; M. Liu et al., 2021; Xing et al., 2022). However, real-time performance testing has not been conducted on edge platforms, making it challenging to compare these results with the current study. Among them, one study (Saadatnejad et al., 2020) tested on edge devices but only used System on Chips (SoCs) with powerful processing capabilities like the ARM Cortex A7, A3, or ARM 11. The reported inference times ranged from 30 to 60 ms (Saadatnejad et al., 2020). Similarly, Caesarandra et al. (2022) conducted realtime execution on the Jetson Nano using ARM A57 quad-core processors with a 1.43 GHz clock speed (Caesarendra et al., 2022). The accuracy in classifying four ECG labels reached 96%, but inference times were not provided. Falaschetti et al. (2022) (Falaschetti et al., 2022) tested ECG classification networks on basic ARM Cortex-M4 processors, achieving a maximum accuracy of 90.2%, with noticeably large inference times ranging from 0.8 to 2.3 seconds. In the current study, the proposed classification networks were tested on ESP32 microcontrollers, a dual-core SoC with a maximum clock speed of 240 MHz and very low power consumption (Khan et al., 2023). Experimental results showed that the ANN-TIME model achieved 98% accuracy after quantization, with an execution time of only 21.5 ms, outperforming previous experiments (Saadatnejad et al., 2020). This achievement is attributed to ANN-TIME using a direct ANN model with time-series inputs. The ANN-DCT model also had a low execution time of 28.4 ms, again faster than previously reported inference times (Saadatnejad et al., 2020). Therefore, despite running on basic microcontrollers with low power consumption, the current study achieved very high accuracy and superior inference times compared to previous studies. Moreover, the low power consumption of the ESP32 microcontrollers means that the approach used in the current study could be applied to develop low-cost diagnostic devices or remote systems based on IoT technology.
Table 10 Comparison of related studies.
| Study | Model used | Feature used | Accuracy (%) | Device (chipset and max clock speed) | Inference time on embedded system (ms) |
|---|---|---|---|---|---|
| Kiranyaz, Serkan, Turker Ince (2016) | CNN | Time- series | > 96 | - | - |
| Amirshahi & Hashemi (2021) | SNN | Time- series | 97.9 | - | - |
| Moto 360 (Snapdragon 400, quad-core 1.2 GHz) | 31.2 | ||||
| Saadatnejad et al. (2020) | LSTM- based | Wavelet | > 99 | ARM Cortex 53 (Allwinner H5, quad-core 1GHz) | 39.1 |
| Raspberry Pi Zero (Broadcom 2835, single-core 1GHz) | 58.6 | ||||
| M. Liu et al. (2021) | CNN | Time- series | 99.03 | - | - |
| Cai et al. (2021) | CNN- FFNN | Time- series | 91.5 | - | - |
| Xing et al. (2022) | SNN | Time- series | 98.26 | - | - |
| Farag (2023) | CNN | Time- series | 98.18 | - | - |
| RNN | 87 | STM32L476RG | 821 | ||
| Falaschetti et al. (2022) | GRU | Time- | 86.6 | (ARM Cortex-M4, single-core 80 | 1660 |
| , | LSTM | series | 90.2 | MHz) | 1590 |
| Consequently at all | BiLSTM | T: | 88.9 | , | 2262 |
| Caesarendra et al. (2022) | CNN | Time- series | 96 | Jetson Nano (ARM A57, quad- core, 1.43 GHz) | - |
| This work | ANN | Time- series | 98 | ESP32 (Xtensa LX6, duo-core 240 | 21.5 |
| DCT | 97 | MHz) | 28.4 |
Conclusion
In summary, the study proposed two general ANN- and CNN-based ECG classification models and tested them with three types of ECG features: time-series, FFT features, and DCT features. The results showed that all 6 classification models achieved very high accuracy, from 93% to 98%, before quantization. However, when quantized into fully integer-only models, the ANN-FFT model proved to be inappropriate with a significant decrease in accuracy. The remaining models after quantization achieved accuracy ranging from 94.9% to 97.1%. Based on overall accuracy and \(P_{macro}\), \(R_{macro}\), and \(F1_{macro}\) scores, the ANN-TIME and ANN-DCT models are the most suitable for the classification task on edges. Moreover, these two models have the fastest inference speed, 21.5 and 28.4 ms, respectively. Compared to previous studies, even the ANN-TIME model outperformed in terms of execution time. However, its accuracy is slightly lower, above 98% compared to over 99%. In the future, real-time ECG signal acquisition and processing systems should be developed to allow automatic ECG signal collection and classification aimed at supporting diagnosis.
Although the current models perform quite well in experimental settings, several limitations remain. The most notable is the lack of real-time data collection from actual deployment environments. In addition, the training dataset lacks diversity, particularly between different population groups such as Asians and Europeans; this could lead to biased predictions. To address this, transfer learning should be applied to fine-tune the models for specific groups, thereby improving accuracy and generalizability. Furthermore, to deploy the models efficiently on resource-constrained embedded platforms, it is necessary to balance accuracy and computational complexity by using lightweight architectures and optimizing the models based on the specific requirements of each application, rather than relying on a one-size-fits-all approach. Overall, expanding the model's applicability to real-world environments requires simultaneously addressing three key challenges: integrating real-time data collection, adapting the models for different population groups through transfer learning, and optimizing architectures to meet the constraints of embedded systems.
Acknowledgement
The authors are grateful to the Faculty of Automation Engineering, College of Engineering, Can Tho University, Can Tho City, Vietnam, for providing the necessary facilities to carry out the work.
Compliance with ethics guidelines
The authors declare they have no conflict of interest or financial conflicts to disclose.
This article contains no studies with human or animal subjects performed by authors.