
Introduction
The increasing urgency to mitigate climate change and reduce air pollution has intensified the search for sustainable and renewable energy solutions. As a renewable energy source, biomass offers a promising pathway to replace fossil fuels, thereby decreasing greenhouse gas emissions and enhancing energy security (Pandey & Erbaugh, 2024). Among the various types of biomass, agricultural residues such as sugarcane bagasse are particularly attractive due to their abundance, low cost, and relatively high energy content. The efficient utilization of sugarcane bagasse, which is a byproduct of the sugar industry, not only provides an alternative to fossil fuels but also addresses waste management challenges associated with large-scale agricultural operations (Ali et al., 2024).
The combustion of biomass involves complex chemical and physical processes, including drying, pyrolysis, and oxidation (Newman et al., 2024). These processes are influenced by several factors such as biomass composition, particle size, moisture content, and combustion conditions (Azarya et al., 2025). Sugarcane bagasse, due to its high cellulose, hemicellulose, and lignin content, undergoes a complex pyrolysis process that significantly affects its combustion characteristics (Mohapatra et al., 2023; Morais et al., 2017). Recent studies have highlighted the importance of accurately predicting the distribution of pyrolysis products, which is critical for optimizing combustion performance and minimizing emissions (Abhijeet et al., 2020; Zhu et al., 2013).
However, the optimization of biomass combustion processes remains a challenging task due to the interplay of numerous parameters, such as air-fuel ratio, temperature distribution, and gas-phase reactions (Siddiqui et al., 2022). Studies have demonstrated that both excess and a deficiency of air can lead to suboptimal combustion, resulting in lower exhaust gas temperatures and higher concentrations of unburnt volatiles (Batista et al., 2023). Thus, fine-tuning
Copyright ©2025 Published by IRCS - ITB J. Eng. Technol. Sci. Vol. 57, No. 5, 2025, 678-687 ISSN: 2337-5779 DOI: 10.5614/j.eng.technol.sci.2025.57.5.8 these parameters through advanced simulations and experimental validations is crucial to developing more efficient biomass combustion technologies.
Computational tools like computational fluid dynamics (CFD) and process simulation software such as Aspen Plus offer a sophisticated means to study and optimize these processes (Dernbecher et al., 2019; Zhakupov et al., 2022). CFD is particularly useful in modeling the fluid flow and heat transfer phenomena occurring during biomass combustion, while Aspen Plus provides insights into the thermodynamic behavior of pyrolysis, including the prediction of product distribution based on the Gibbs free energy minimization method (Liu et al., 2022; Zhou, 2024). The use of Aspen Plus to model the pyrolysis stage offers a valuable approach to understanding the distribution of volatile and solid residues at different temperatures, which subsequently informs the CFD models to predict the behavior of these volatiles during combustion. This integrated modeling approach is vital for achieving high combustion efficiency and low emissions. Combining these tools allows for a more comprehensive analysis and optimization of biomass combustion processes.
This paper presents a novel study that combines CFD and Aspen Plus simulation tools to optimize the combustion process of sugarcane bagasse in a grate-fired furnace. By integrating detailed predictions of pyrolysis product distribution from Aspen Plus into the CFD analysis, this research provides a comprehensive understanding of the impact of various operational conditions on combustion efficiency and emissions. This integrated modeling approach leverages the strengths of both tools, i.e., Aspen Plus provides equilibrium-based insights into product distribution across varying pyrolysis conditions, while CFD captures the complex flow behavior, temperature gradients, and chemical reactions within the combustion chamber. Linking the thermodynamic outputs of Aspen Plus as boundary conditions and source terms in CFD enables realistic prediction of flame stability, pollutant formation, and thermal performance. Such a holistic simulation framework allows for process optimization that balances energy recovery and environmental control. The validation of simulation results against experimental data from a lab-scale grate-fired furnace confirms the accuracy and reliability of this integrated modeling approach, contributing to the advancement of efficient and low-emission biomass combustion technologies.
Materials and Methods
Material Product Distribution
The prediction of pyrolysis product distribution was conducted using Aspen Plus® software (AspenTech, USA), which has been proven effective in simulating biomass conversion into gaseous products (Aghaalikhani et al., 2019; Cahyono et al., 2025; Mehdi et al., 2023). Non-conventional methods were employed due to the complexity of feedstocks that could not be modeled using pure chemical compounds. The definition of non-conventional was established by inputting the proximate and ultimate compositions obtained from the analysis results, as summarized in Table 1. Subsequently, the physical and chemical properties of solids were calculated through the component attributes DCOALIGHT and HCOALGEN in Aspen Plus. The drying process of the feedstock was modeled using the RStoic unit block. The amount of water dried in this stage was determined from the proximate analysis results. The main objective of this stage was to determine the total energy required for the drying process. After this step, it was assumed that water would be completely separated before being introduced to the gasifier.
| Parameter | Unit | Results |
|---|---|---|
| Proximate Analysis | ||
| Moisture | %adb | 7.6 |
| Ash Content | %adb | 1.6 |
| Volatile Matter | %adb | 79.7 |
| Fixed Carbon | %adb | 11.1 |
| Ultimate Analysis | ||
| Carbon (C) | %adb | 43.62 |
| Hydrogen (H) | %adb | 6.26 |
| Nitrogen (N) | %adb | 0.31 |
| Oxygen (O) | %adb | 48.01 |
Table 1 Characterization of sugarcane bagasse.
The gasification reaction was modeled using the RGibbs block in Aspen Plus. The RGibbs reactor in Aspen Plus is a versatile tool for predicting chemical and phase equilibrium by minimizing Gibbs free energy under specified conditions, such as temperature () and pressure () without requiring detailed reaction mechanisms, as depicted in Eq. (1) and
(2). The total Gibbs free energy () was calculated as the summation of the product of the number of moles of each species () and its corresponding molar Gibbs free energy (), as shown in Eq. (1). The molar Gibbs free energy () was derived from the enthalpy (ℎ) minus the product of temperature () and entropy (), as represented in Eq. (2).
\[G = \sum_{i} n_i \cdot g_i(T, P) \tag{1}\]
\[g_i(T, P) = (h_i(T) - T \cdot s_i(T)\] (2)
In the minimization process, Aspen Plus adjusted the amounts of species (via the terms) such that the total Gibbs free energy of the system was minimized, subject to constraints like mass balance (stoichiometry) and phase equilibrium conditions. The system reached equilibrium when the Gibbs free energy was at its minimum for the given temperature and pressure, meaning no further spontaneous reactions would occur (González-Vázquez et al., 2021). The minimization is typically performed using numerical optimization algorithms built into Aspen Plus, such as the Newton-Raphson method or other gradient-based optimization techniques. These algorithms iteratively adjust the species compositions to find the point where the Gibbs free energy reaches its lowest value (Nugraha et al., 2025).
Inputs to the RGibbs block included the composition of the entering compounds, a list of desired outgoing compounds, and operating conditions within the reactor. RGibbs effectively handles multi-phase and multi-component systems, making it useful for complex reactions such as biomass pyrolysis and combustion. RGibbs predicts the distribution of products across gas, liquid, and solid phases, helping optimize combustion performance by modeling the behavior of volatile compounds, char, and ash. Its sensitivity to temperature and pressure changes allows for accurate simulations of various stages in processes like pyrolysis and combustion, facilitating improved efficiency and emission control.
Biomass Combustion Simulation
The combustion simulation was performed using the CFD software ANSYS Fluent® (ANSYS Inc., USA). The computational domain was modeled based on previous research conducted on a lab-scale grate-fired furnace (Nugraha et al., 2024), followed by mesh generation to discretize the domain into smaller cells, as illustrated in Figure 1. The computational domain was discretized using a structured mesh, ensuring high mesh quality where more than 98% of cells achieved an orthogonal quality higher than 0.2. To ensure accuracy, a mesh independence test was conducted, indicating that the use of 798,088 cells provides mesh-independent results.
(a) Computational domain. (b) Mesh generated.
In this simulation, the k-ω SST turbulence model was coupled with both the discrete ordinates radiation model and a volumetric reaction model. The eddy dissipation concept (EDC) was utilized to compute reaction rates, which had been validated to produce accurate predictions for biomass combustion (Habibi et al., 2024). The combustion process in the gas phase followed a two-step mechanism, described in Eqs. (3), (4), (5), (6), and (7). Initially, volatile compounds reacted with oxygen, yielding carbon monoxide and water vapor. Subsequently, carbon monoxide underwent oxidation with oxygen, forming carbon dioxide. Volatile compounds, H₂, CO, CO₂, CH₄, C₂H₄, and C₂H₆, were released from the biomass and assigned as source terms. The composition of each volatile compound was determined by pyrolysis product distribution calculations in Aspen Plus software at a pyrolysis temperature of 500°C. This temperature was based on observations at the grate plate, which provided the aforementioned average temperature. Additionally, energy release from char combustion was modeled within the biomass layer, along with oxygen consumption and CO₂ production, following the reaction mechanism depicted in Eq. (8). In addition, source term of water vapor was included in the biomass bed to allow more accurate prediction of combustion phenomena due to the influence of the initial moisture
Both the biomass and grate were modeled as porous media, permitting airflow through these structures. The porosity for biomass was set at 0.5, while the grate's porosity, determined as 0.125, was calculated based on the ratio of the void volume to the total volume (including solid and void portions). The grate also accounted for pressure drop due to inertial losses, calculated using the van Winkle correlation (Nugraha et al., 2023). The boundary conditions for the walls were set as no-slip. Heat loss from the walls was accounted for using experimental data, with an emissivity value of 0.9. Turbulence intensity at the inlet was set at 5%, calculated based on the hydraulic diameter of the air inlet from experimental measurements. Two different air mass flow rate levels were supplied to create various levels of excess air, i.e., 1.1 x 10³ and 1.6 x 10³kg/s, which corresponded to 100% and 200% of excess air, respectively. The air mass flow rate was distributed equally to six different air inlets, i.e., two primary air inlets and four secondary air inlets. An outflow boundary condition was applied at the outlet.
\[H_2 + \frac{1}{2}O_2 \to H_2O\] (3)
\[CH_4 + \frac{3}{2}O_2 \to CO + 2H_2O\] (4)
\[C_2H_4 + 2O_2 \rightarrow 2CO + 2H_2O\] (5)
content of the biomass.
\[C_2H_6 + \frac{5}{2}O_2 \rightarrow 2CO + 3H_2O\] (6)
\[CO + \frac{1}{2}O_2 \to CO_2 \tag{7}\]
\[C + O_2 \to CO_2 \tag{8}\]
The pressure-velocity coupling was handled using the SIMPLEC scheme with Rhie-Chow distance-based interpolation to enhance pressure-velocity stability. Spatial discretization employed second-order upwind schemes for momentum, pressure, turbulent kinetic energy, specific dissipation rate, and species transport to ensure high solution accuracy. Gradient calculations used a least-squares cell-based method. The convergence criteria were set to an absolute residual of 10-6 for energy and 10−3 for continuity, velocity components, turbulence parameters (k and ω), and all species.
Results
Pyrolisis Product Distribution
The pyrolysis process plays a crucial role in biomass combustion by breaking down the biomass structure into volatile compounds, char, and gases, which subsequently participate in combustion (Nugraha et al., 2023). In this study, Aspen Plus was employed to simulate the pyrolysis of sugarcane bagasse under different temperatures, with the flowsheet depicted in Figure 2a. This analysis provides insights into the distribution of key products such as H₂, CO, CO₂, CH₄, and longer hydrocarbon chains. The simulation results show a significant variation in product distribution as a function of pyrolysis temperature, as illustrated in Figure 2b. At lower pyrolysis temperatures, the majority of the product appeared in the form of volatiles, with a high concentration of water vapor and light hydrocarbons such as methane (CH₄) and carbon dioxide (CO₂). As the temperature increased, a shift was observed in the product distribution, with more significant quantities of CO and hydrogen gas (H₂) being released.
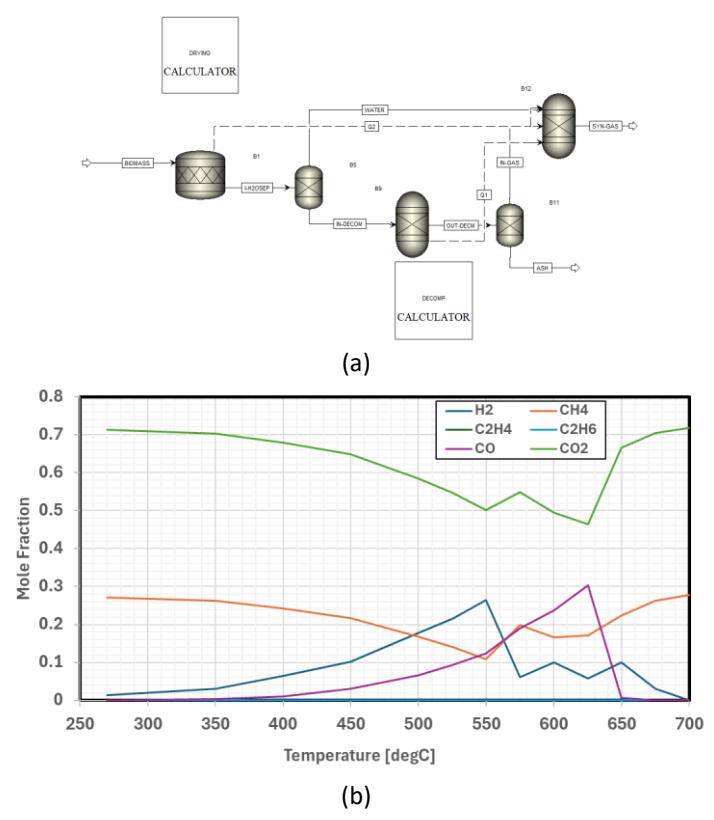
(a) Flowsheet in Aspen Plus. (b) Pyrolysis product distribution results at various pyrolysis temperatures.
Influence of Excess Air to Biomass Combustion
The influence of excess air on biomass combustion is critical for optimizing combustion efficiency and minimizing emissions. In this study, two different levels of excess air (100% and 200%) were supplied to the combustion process, and their impact on combustion parameters was thoroughly investigated. The data in Table 2 reveal that varying the excess air ratio significantly influences the combustion characteristics, such as CO₂ concentrations and temperature profiles above the grate. As excess air increases, the concentration of CO₂ in the exhaust gases decreases, while the freeboard temperature shows a moderate decline. These trends are consistent with previous findings, suggesting that excessive air can reduce combustion efficiency by lowering temperatures and increasing dilution of combustion gases.
The validation of simulation results with experimental data, as shown in Table 2, indicates a reasonable agreement between the two. For 100% excess air, the simulation predicted a CO₂ concentration of 9.15% mol, which was close to the experimental value of 8.2% mol (±2.8). Similarly, for 200% excess air, the simulation results closely matched the experimental values within the error margins. This validation confirms the reliability of the CFD and Aspen Plus models used in this study for predicting combustion behavior under varying excess air conditions. The observed deviations are likely due to inherent experimental uncertainties or slight variations in biomass feed properties; nonetheless, the results provide a solid basis for analyzing the impact of excess air on biomass combustion.
Table 2 Comparison of simulation result with experiment observation
| Parameter | Simulation | Experiments |
|---|---|---|
| %mol CO2 | ||
| 100% excess air | 9.15 | 8.2±2.8 |
| 200% excess air | 6.46 | 7.2±2.2 |
| Temperature at 25 cm above the grate | ||
| 100% excess air | 520.8 | 506.8±32.5 |
| 200% excess air | 502.1 | 492±48.2 |
| Average freeboard temperature | ||
| 100% excess air | 405.23 | 361.7±22.5 |
| 200% excess air | 397.85 | 351.8±31 |
Biomass Combustion Hydrodynamics
The CFD simulation results provide detailed visualizations of the combustion hydrodynamics within the grate-fired furnace, particularly under varying excess air conditions. These results focus on key parameters such as temperature distribution, CO₂ and CH₄ concentrations, and airflow patterns represented by velocity vectors. Figures 3 through 5 compare the simulation outputs under 100% and 200% excess air conditions. As shown in the temperature contours (Figure 3), the region near the grate, where combustion initiates, displays higher temperatures for the 100% excess air case. The flame temperature is more concentrated and uniform in this case, indicating more efficient heat release. In contrast, the temperature field at 200% excess air shows a noticeable reduction in peak temperatures and greater dispersion, reflecting the cooling and dilution effects introduced by the excess air.
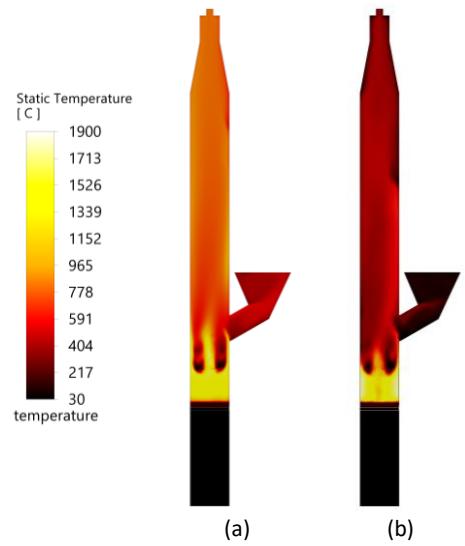
Contour plots of temperature from CFD simulation result for (a) 100% excess air and (b) 200% excess air.
Figure 4 presents the contours of CO₂ mole fraction. Under 100% excess air, the CO₂ distribution is more localized and concentrated near the combustion zone, suggesting effective oxidation of carbon-based species and better combustion completeness. Conversely, the 200% excess air case shows a more diffused CO₂ distribution, with lower mole fractions, further indicating that excess air reduces combustion efficiency due to gas dilution and flame quenching effects. The airflow dynamics visualized in Figure 5 reinforce these findings. At 100% excess air, the velocity vectors indicate a focused and streamlined airflow, ensuring optimal oxygen delivery through the grate and into the combustion zone. In contrast, the airflow under 200% excess air becomes more chaotic, characterized by turbulent patterns that disrupt the uniform combustion environment.
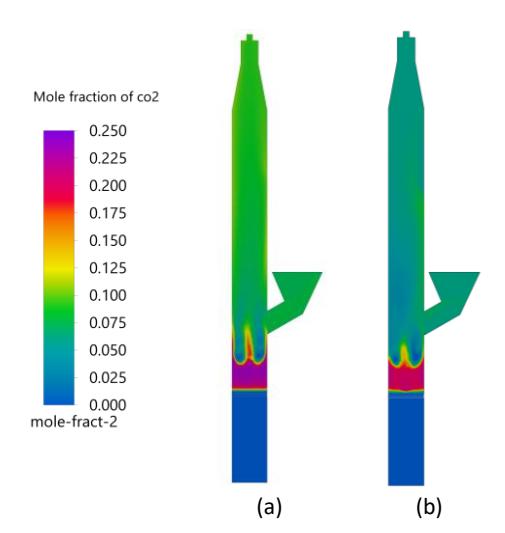
Contour plots of CO2 mole fraction from CFD simulation result for (a) 100% excess air and (b) 200% excess air.
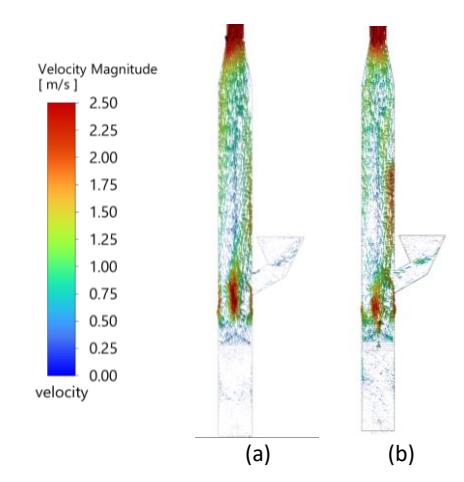
Vector plots of CO2 velocity from CFD simulation result for (a) 100% excess air and (b) 200% excess air.
Discussion
Pyrolisis Product Distribution
One key trend observed base on Figure 2b was the relationship between increasing pyrolysis temperature and the release of combustible gases, particularly CO and H₂. At temperatures below 400°C, the volatile fraction predominantly consisted of CO₂ and light hydrocarbons such as CH₄ and C₂H₄, reflecting the early stages of pyrolysis, where dehydration and devolatilization of the biomass occurred. As the temperature exceeded 500°C, the concentration of CO increased, along with a marked rise in H₂ production. This behavior indicates the progression toward more complete thermal decomposition of biomass, where higher temperatures promote secondary cracking reactions, breaking down heavier hydrocarbons into lighter gases (Chatterjee et al., 2020). The increasing release of H₂ at higher temperatures is particularly beneficial for combustion, as hydrogen-rich gases contribute to higher flame temperatures and improve overall combustion efficiency.
The production of CO also reveals a distinct trend with increasing pyrolysis temperature. At temperatures around 300- 400°C, CO production was relatively low due to the incomplete breakdown of cellulose, hemicellulose, and lignin structures. However, as the temperature approached 600°C and beyond, a sharp increase in CO was observed. This rise is attributed to the enhanced oxidation of carbon-rich residues in the biomass, alongside the decomposition of oxygencontaining functional groups present in the bagasse structure. This trend highlights the importance of controlling pyrolysis temperature to balance the production of CO and CO₂, as excessive CO₂ generation can reduce combustion efficiency by lowering the calorific value of the volatile gas mixture.
The pyrolysis product distribution trends captured in the Aspen Plus simulation provide valuable insights for optimizing combustion conditions. By understanding how temperature affects the release of volatile species, operators can finetune the combustion environment to maximize energy output and minimize harmful emissions. For example, operating at temperatures that favor the production of CO and H₂, while minimizing CO₂ formation, could enhance the combustion efficiency and reduce the amount of unburnt volatiles. Additionally, the information on volatile composition at various temperatures is crucial for accurately setting up CFD simulations to model the subsequent combustion process, ensuring a comprehensive understanding of the overall biomass combustion behavior.
Influence of Excess Air to Biomass Combustion
Based on the data presented in Table 2, an inverse relationship is observed between excess air and CO₂ concentration. As the excess air increased from 100% to 200%, the CO₂ concentration decreased from 9.15% mol to 6.46% mol. This can be explained by the dilution effect, where additional air lowers the concentration of combustion gases, including CO₂. However, the decrease in CO₂ concentration is not necessarily indicative of improved combustion efficiency. In fact, higher excess air can lead to incomplete combustion of volatiles and char, as evidenced by the reduction in freeboard temperatures. For instance, the temperature at 25 cm above the grate dropped from 498.4°C with 100% excess air to 351.6°C with 250% excess air. This suggests that higher air supply reduces the local flame temperature, leading to lower combustion efficiency and increased heat losses.
Another important parameter affected by excess air is the temperature profile within the combustion chamber. The simulation shows a decline in freeboard temperatures with increasing excess air, consistent with the trend captured in the experimental data. At 100% excess air, the average freeboard temperature is 405.23°C, while it decreases to 397.85°C at 200% excess air. This drop in temperature can negatively impact the combustion of volatiles and char, leading to higher emissions of unburnt hydrocarbons and reduced thermal efficiency. Optimizing the air-to-fuel ratio is therefore essential to ensure complete combustion while minimizing the dilution effect caused by excess air. By finetuning the excess air levels, the combustion process can be made more efficient, as higher temperatures favor complete combustion and lower emissions of harmful pollutants.
Biomass Combustion Hydrodynamics
The combustion hydrodynamics observed in the CFD simulation demonstrate that increasing excess air beyond stoichiometric requirements can adversely affect combustion efficiency. The higher turbulence and dilution introduced by excess air lead to a significant reduction in flame temperature, as shown in the temperature contours. This thermal reduction, in turn, impairs the complete oxidation of carbon-rich species, as evidenced by the lower CO₂ concentrations at 200% excess air. These conditions suggest a trade-off between ensuring sufficient oxygen availability and maintaining optimal combustion temperature. Although excess air is traditionally used to improve combustion stability and reduce certain pollutants, the simulation highlights diminishing returns when the excess becomes too high.
Furthermore, the CH₄ concentration trends, though not visually presented, are inferred to increase with higher excess air due to incomplete combustion. This is compounded by the airflow patterns observed in the velocity vector plots, where high turbulence under 200% excess air shortens the residence time of volatiles in the combustion zone. This prevents full oxidation and may contribute to the emission of unburnt hydrocarbons. The simulation findings emphasize the importance of optimizing excess air to achieve a balance between efficient heat release and emissions control. These insights are valuable for the design and operation of biomass grate-fired furnaces, particularly in improving thermal efficiency and reducing environmental impact through better air-fuel management strategies.
Conclusion
This study presents an integrated approach using CFD and Aspen Plus simulations to optimize the combustion of sugarcane bagasse, a renewable biomass resource, in a grate-fired furnace. The research investigated the impact of operating conditions, particularly the influence of excess air, on combustion performance and emission characteristics. Through a combination of pyrolysis product distribution modeling and combustion hydrodynamics simulations, the study provides valuable insights into the behavior of biomass combustion under varying air-fuel ratios.
The results demonstrate that controlling the excess air supply is critical for optimizing combustion efficiency and minimizing emissions. At 100% excess air, the combustion process achieves higher flame temperatures, more efficient oxidation of volatiles and char, and lower emissions of unburnt hydrocarbons such as methane. The simulation results, validated by experimental data, show that increasing excess air to 200% leads to a significant reduction in flame temperature and combustion efficiency. This is reflected in the higher concentrations of unburnt volatiles, particularly methane, and the reduced concentrations of CO₂, which indicate incomplete combustion.
The hydrodynamic analysis, visualized through velocity vector plots, further underscores the importance of air distribution in the combustion process. While 100% excess air results in a well-structured airflow pattern that effectively supplies oxygen to the combustion zone, 200% excess air creates turbulent and dispersed flow, which disrupts the combustion process and leads to lower efficiency. These findings suggest that optimizing the air-fuel ratio is essential to maintaining a balance between providing sufficient oxygen for combustion and avoiding excessive air that dilutes the combustion gases and cools the flame.
The study also highlights the robustness of the combined CFD and Aspen Plus modeling approach in predicting the thermal and fluid dynamic behavior of biomass combustion. The integration of pyrolysis product distribution into the CFD model allows for a detailed analysis of the combustion process, offering a comprehensive understanding of how temperature, gas composition, and air distribution affect combustion efficiency. This approach proves to be an effective tool for designing and optimizing biomass combustion systems, providing valuable data for enhancing the performance of renewable energy technologies.
In conclusion, the findings of this study contribute to the advancement of biomass combustion technologies by providing a deeper understanding of the role of excess air in controlling combustion efficiency and emissions. The integrated simulation approach offers a reliable method for optimizing combustion processes, helping to achieve the dual goals of maximizing energy output and minimizing environmental impact. Future work could focus on further refining the air distribution strategies and exploring the application of this methodology to other types of biomass and combustion systems to enhance its versatility and broader applicability.
Acknowledgments
This research was supported by the Research Assistance Grant year 2025 with contract number 4588/UN1.P4/Dit-Lit/PT.01.03/2025 from Universitas Gadjah Mada. The authors would like to express their gratitude for the financial support provided, which has been instrumental in conducting the process simulations and analysis presented in this study. We also extend our appreciation to the Department of Chemical Engineering and Department of Mechanical and Industrial Engineering, Universitas Gadjah Mada, for providing the necessary facilities and resources.
Compliance with ethics guidelines
The authors declare they have no conflict of interest or financial conflicts to disclose.
This article contains no studies with human or animal subjects performed by authors.