
Introduction
The development of renewable energy storage devices that are sustainable, efficient, and environmentally friendly is essential (Wenten et al., 2024) . Lithium batteries are widely used due to their high energy density and thermal stability (Diantoro et al., 2022). However, lithium is a toxic material that poses environmental hazards. Currently, supercapacitors are a promising alternative as they offer a longer cycle life, faster charging, higher power density, and improved environmental compatibility compared to batteries (Rustamaji et al., 2022; Xu et al., 2020). A supercapacitor consists of two electrodes (anode and cathode), a separator, and an electrolyte (Hubert et al., 2022). The separator functions to prevent direct contact between the cathode and anode while allowing ion mobility during the charge-discharge process (Ahankari et al., 2022). Therefore, the separator is a crucial component that directly influences the safety of the supercapacitor. It must possess high porosity, good chemical and thermal stability, excellent electrolyte absorption, and a pore size larger than the ion size of the electrolyte used (Barbosa et al., 2018; X. Zhang, Fu, et al., 2021)
The main materials that can be used for separator membranes are polymers (Liang et al., 2019). The polymers used in supercapacitors can significantly influence the morphology and properties of the separator membrane. Polymer-based membranes are generally preferred as separators in supercapacitors due to their wide electrochemical stability window (Arthi et al., 2022). Several polymers that have been developed for separator membranes are polyvinylidene fluoride (PVDF), polypropylene (PP), polyvinyl alcohol (PVA), and polyacrylonitrile (PAN) (Yanilmaz, 2020; Y. Zheng et al., 2022) There are several methods to produce nanofibers, including chemical vapor deposition, self-assembly, wet chemical synthesis, and electrospinning (Kailasa et al., 2021). However, chemical vapor deposition requires complex equipment and cannot be used with polymers due to the extremely high temperatures involved (Che et al., 1998). Self-assembly is limited by slow processing and difficult-to-control parameters (Z. Zheng et al., 2016). Wet chemical synthesis often produces discontinuous and non-uniform nanofibers (Van Hong Thien et al., 2015). Due to these limitations, electrospinning is the most widely used method for producing membranes from polymer solutions. It is simple, efficient, cost-effective, and produces nanofibers with a large specific surface area, uniform diameter, and good pore interconnectivity (Nasikhudin et al., 2017). When a high voltage is applied, the polymer solution becomes highly charged, and the droplet at the tip of the needle experiences two main types of electrolytic forces: the repulsion between surface charges and the Coulomb force exerted by the external electric field. Nanofibers produced by electrospinning are suitable for supercapacitor separators due to their large surface area and high porosity (Figen, 2020).
PAN is a polymer composed of a long chain of acrylonitrile monomers (-CH2-CH(CN)-) has and is known for its good mechanical, electrical, and optical properties, as well as excellent electrospinnability (Xie et al., 2023). The nitrile groups in PAN generate strong intermolecular forces, contributing to good chemical stability and resistance in interactions (Dong et al., 2020). However, using a single polymer limits the overall properties of the membrane. PAN's hydrophobic nature restricts its interactions with electrolytes, which can increase ionic resistance and reduce the performance of the supercapacitor. Yang et al. and Cao et al. conducted research on separators made from single polymers and reported low specific capacitance values, with retention rates reaching 94% and 93% after 10,000 cycles, respectively (Cao et al., 2022; Yang et al., 2020) . Composite membranes, which consist of two or more materials, typically comprise a very thin dense layer and a porous support layer (B. Li et al., 2023). Therefore, incorporating other materials as composites can enhance the properties of the membrane. In a previous study, we used PAN polymer composite and another polymer, PVDF, and achieved a gravimetric capacitance of up to 54.104 F/g (Azizah et al., 2023).
In recent years, several studies have been carried out to improve the performance of supercapacitors by compositing polymers with metal oxide as separator materials (Arthi et al., 2021). The addition of metal oxide nanoparticles aims to enhance the thermal stability and ionic conductivity for application as separators in supercapacitors. This is important because polymers are typically insulating materials, and incorporating metal oxides helps to improve conductivity. Increased conductivity facilitates smoother electron transport (J. Il Kim et al., 2017). Several metal oxides that can be used as composites for separator materials are titanium dioxide (TiO2), zinc oxide (ZnO), and silicon dioxide (SiO2) (Y. Li et al., 2024). Mu et al. conducted a study on PAN/ZnO separators, and found that the retention reduced by 4.4% after 120 cycles (Mu et al., 2025). Although this reduction may seem relatively small, it is considered significant in the context of separator performance. Yanilmaz et al. conducted a study on PAN/SiO2 separators and reported an interfacial resistance value of up to 300 ohm (Yanilmaz et al., 2015). A high resistance value inhibits the movement of ions between the electrolyte and electrodes, thereby reducing ion mobility during charge storage (J. Zheng et al., 2017). TiO2 is commonly added to modified fibers due to its high absorption capacity, which increases electrolyte uptake. In addition, TiO2 has several advantages, including non-toxicity, high chemical stability, and low cost (Tang et al., 2023). TiO2 has three phases: anatase, rutile, and brookite. The anatase phase has a more open crystal structure, providing better ion diffusion paths (Khassi et al., 2020). Additionally, the anatase phase has a higher bandgap, which can reduce the possibility of electronic interactions between the electrode and separator.
To optimize the characteristics of TiO2, it is essential to determine its ideal composition when used as a composite with PAN. In this study, we varied the TiO2 content at 0, 5, 10, 15, and 20 wt%. This range was chosen to evaluate the progressive impact of TiO2 on the structural, physical, and electrochemical properties, while also avoiding excessive agglomeration that may occur at higher concentrations. The fabrication of symmetric supercapacitors in coin cells is well-suited for powering small devices due to their practicality, stability, long service life, and high energy capacity (Babu et al., 2023). We used a PAN/TiO2 separator, AC-CB electrode, and Et4NBF4 electrolyte to assemble the symmetric supercapacitor.
Materials and Methods
Materials
Polyacrylonitrile (PAN with Mw 150,000 g/mol, Sigma Aldrich), titanium dioxide anatase phase (TiO2, Sigma Aldrich), N,N-dimethylformamide (DMF, Sigma Aldrich), and Polyvinylpyrrolidone (PVP with Mw 1,300,000 g/mol, Sigma Aldrich), aluminum foil (Klinpak, Indonesia), Activated Carbon (AC, CGC, Thailand), Carbon Black (CB, Imerys, Belgium), binder LA133 (Imerys, Belgium), Deionized Water (Onemed, Indonesia), Tetraethylammonium tetrafluoroborate (Et4NBF4, Gelon, China), and set coin cell type LIR2032 (TOB Machine, China).
Methods
Preparation of PAN/TiO2 Nanofiber Membrane
The electrospinning solution was prepared using a total volume of 7.5 ml, consisting of 8 wt% PAN+TiO2 dissolved in 92 wt% DMF. First, PAN with various masses was dissolved in 6.9 ml of DMF and stirred at 80°C for 90 minutes. Subsequently, TiO2 in varying amounts (0, 5, 10, 15, and 20 wt%) and PVP as a surfactant were added, and the mixture was stirred at the same temperature for an additional 120 minutes. After complete dispersion, the solution was sonicated for 60 minutes, followed by stirring at room temperature for 20 hours., The resulting PAN/TiO₂ solution was then electrospun to obtain a nanofiber membrane. The electrospinning parameters were as follows: applied voltage of 27 kV, flow rate of 6 mL/h, needle and collector distance of 12 cm, and an aluminium foil substrate measuring 18 × 18 cm. Finally, the fibers were annealed in an oven at 75°C for 5 hours. For simplicity, the samples were labelled as esPAN, esPT5, esPT10, esPT15, and esPT20, corresponding to 0, 5, 10, 15, and 20 wt% TiO2, respectively.
Preparation of AC-CB Electrode
The preparation of the AC-CB electrode paste began by dissolving 1 g of LA133 binder in 2 ml of DI water and stirring at 200 rpm for 30 minutes. Then, 0.1 g of carbon black (CB) was added and stirred at 200 rpm for another 30 minutes. Subsequently, 0.9 g of activated carbon (AC) was added and stirred at 200 rpm for an additional 30 minutes. The resulting mixture was then stirred using a magnetic stirrer at 300 rpm for 24 hours. The paste was deposited on aluminium foil using a doctor blade with a thickness of 20 μm. Finally, the electrode was dried in an oven at 80°C for 2 hours.
Assembly of the supercapacitor
The nanofiber membrane and AC-CB electrode were cut into circular shapes with a diameter of 1.5 cm. They were then assembled in a coin cell of type LIR2032 using 1 M Et4NBF4 as the electrolyte, as illustrated in Figure 1. The coin cell was compressed using a pressing machine. All supercapacitors were assembled symmetrically, using same material for both the cathode and anode
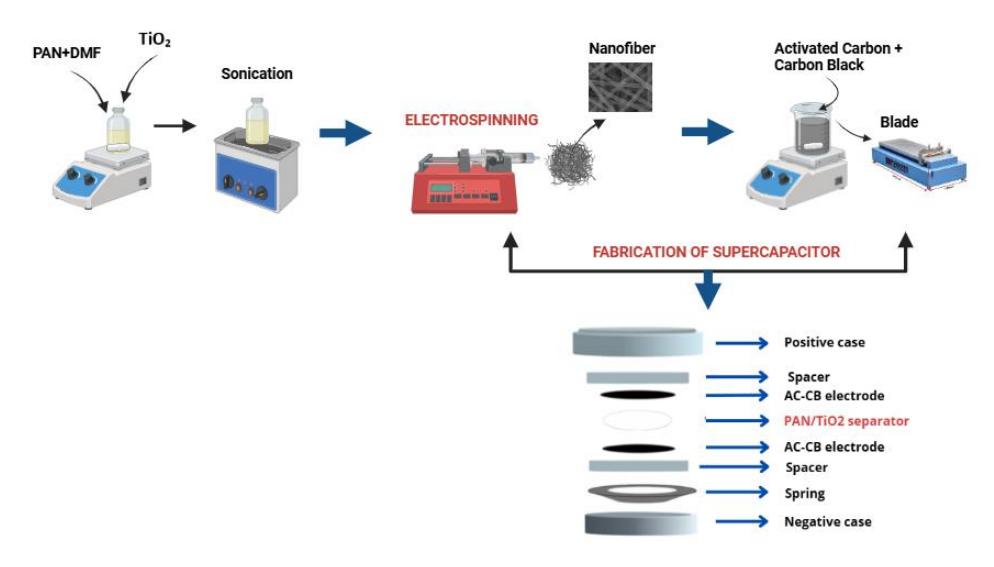
Supercapacitor device assembled in this study.
Characterization
The morphology and porosity of the membrane were characterized using Scanning Electron Microscopy (SEM, FEI Inspect-S50) at 2000x magnification, 20.000 kV accelerating voltage, and a 2.5 spot size. The structural properties of the materials were analyzed using X-Ray Diffraction (XRD, PANalytical X'Pert PRO) with Cu-Kα radiation (λ = 1.540598 Å) over a 2θ range of 10-90° and a step size of 0.02°. Fourier Transform Infrared Spectroscopy (FTIR, Shimadzu IR Prestige 21) was performed in the wavenumber range of 4000-500 cm-1 . Thermogravimetric Analysis (TGA, Linseiss STA PT 1600) was carried out up to 1000°C. To determine electrolyte uptake (%), the nanofiber membranes were immersed in 5 mL of Et4NBF4 electrolyte for 1 hour. The mass before and after immersion was recorded to calculate the percentage of electrolyte uptake, as shown in Eq. (1).
Electrolyte Uptake (%) = \[\frac{W-Wo}{Wo} \times 100\] (1)
where W is the mass before immersion and Wo is the mass after immersion.
The electrochemical performance was characterized using galvanostatic charge–discharge (GCD, Solarton 1286). GCD cycles were conducted at a current density of 0.1 mA.g-1 . Based on the GCD data, the energy density, power density, and specific capacitance were calculated using Eqs. (2), (3), and (4), respectively.
\[E = \frac{1}{8} \frac{C\Delta V^2}{3.6} \tag{2}\]
\[P = \frac{3600E}{\Delta t} \tag{3}\]
\[C = \frac{4I\Delta t}{m\Delta V} \tag{4}\]
Where C is the specific capacitance, V is the voltage, t is the time, and m is the mass of the active material.
In addition, electrochemical performance was characterized using cyclic voltammetry (CV, CorrTest) and electrochemical impedance spectroscopy (EIS, CorrTest). CV measurements were performed within a voltage window of 0 to 1 V, with scan rates ranging from 10 to 100 mV/s. From the EIS data, the ionic conductivity value was determined using Eq. (5).
\[\sigma = \frac{d}{Rct \times A} \tag{5}\] where d is the thickness of the separator, Rct is the charge transfer resistance, and A is the nanofiber membrane area.
Results
Characteristics of PAN/TiO2 membrane
Separator is a crucial component that directly influences the safety of the supercapacitor. It must possess high porosity, good chemical and thermal stability, excellent electrolyte uptake ability, and a pore size larger than the ion size of the electrolyte used (Barbosa et al., 2018; X. Zhang, Wang, et al., 2021). Therefore, characterization of membrane PAN/TiO2 were analyzed with XRD, FTIR, SEM-EDX, electrolyte uptake, and TGA. XRD results in Figure 2 shows when the mass of TiO2 increases, the peaks become sharper, indicating an increase in crystallinity with higher concentration of TiO2. FTIR results in Figure 3 shows that an absorption peak shifts to a lower wavenumber at ~2248.99 cm-1 , also the absorption peak shifts to a higher wavenumber at ~1670.35 cm-1 with increasing TiO2 concentration. Table 1 shows the characteristic of absorption peak for pure PAN and PAN/TiO2 composites.
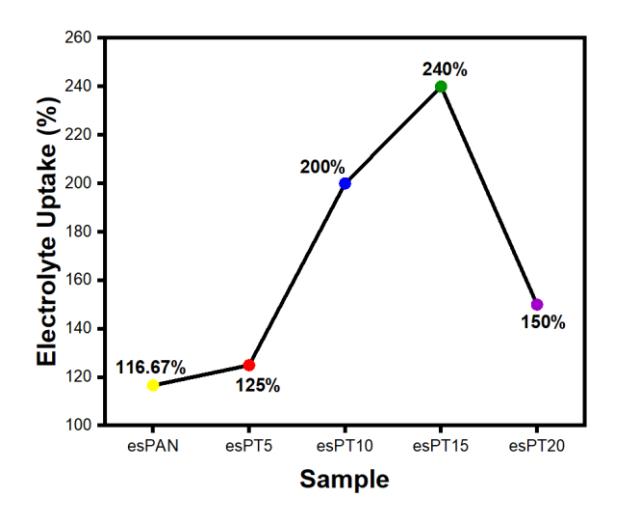
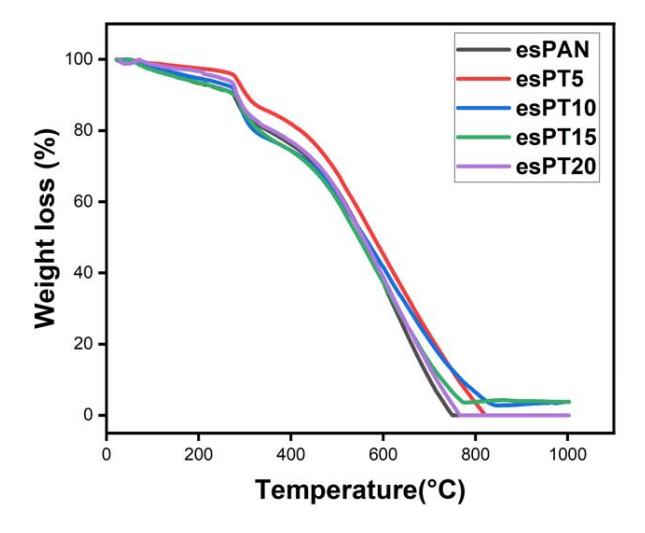
SEM-EDX results in Figure 4a-f shows that the presence of beads, indicating agglomeration at higher TiO2 concentrations. The fiber diameters range from 219.79 nm to 312.88 nm, which is consistent with the typical nanofiber diameter of less than 1 μm and the pore sizes range from 108.60 nm to 160.98 nm. Electrolyte uptake ability results in Figure 5 shows the value is more than 100%. Compared to pure PAN, the PAN/TiO2 membranes show an increased electrolyte uptake. The percentage of electrolyte uptake increased with increasing TiO2 concentration, but it decreased in esPT20. The optimum electrolyte uptake was obtained in esPT15, reaching 240%. TGA results in Figure 6 shows that esPT15 has the highest decomposition temperature at 282° C, with the smallest weight loss and a remaining mass of 3.94% up to 1000° C. All data characterization of PAN/TiO2 membrane are presented in Table 2.
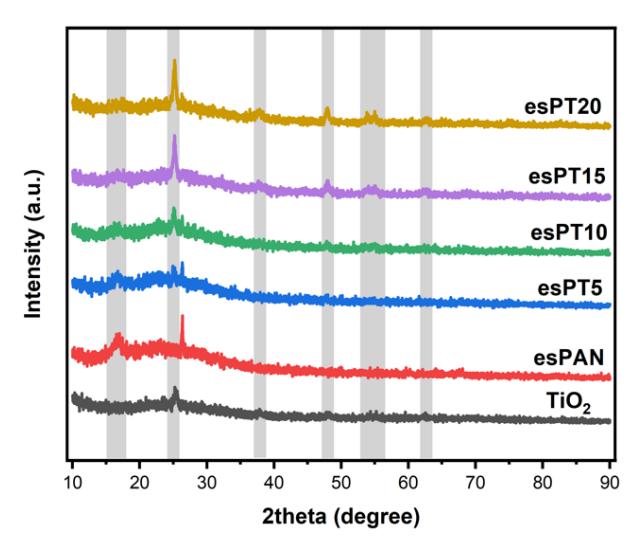
X-ray diffraction patterns of PAN/TiO2 separator membranes.
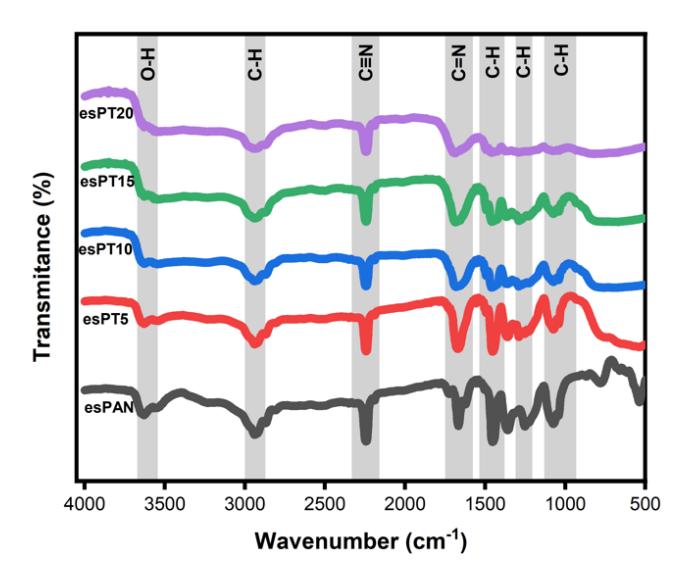
IR spectra of PAN/TiO2 membranes with various composition.
Table 1 Compararison of IR spectra of PAN/TiO2 membranes.
| Wavenumber (cm-1 ) | ||||
|---|---|---|---|---|
| PAN | PAN/TiO2 | Reference | Characteristics | |
| 1074.35 | ~1070-1064 | ~1070-1390 | Methylene (C-H) group (Karim et al., 2018) | |
| 1251.80 | 1288.38 | ~1220-1290 | Aliphatic C-H group vibration (Mohamed et al., 2017) | |
| 1454.32 | 1460.11 | ~1450-1560 | Aliphatic C-H group vibration (Mohamed et al., 2017) | |
| 1670.35 | ~1678-1701 | ~1635-1700 | C=N stretching vibration (Q. Liu et al., 2020) | |
| 2248.99 | ~2247-2237 | ~2253-2361 | C≡N nitrile group stretching vibration (Hua et al., 2021) | |
| 2939.51 | ~2941.44-2945.3 | ~2870-2940 | C-H stretching vibration (Khan et al., 2023) | |
| 3630.03 | ~3606-3649 | ~3200-3700 | O-H stretching vibration (X. Y. Li et al., 2021) | |
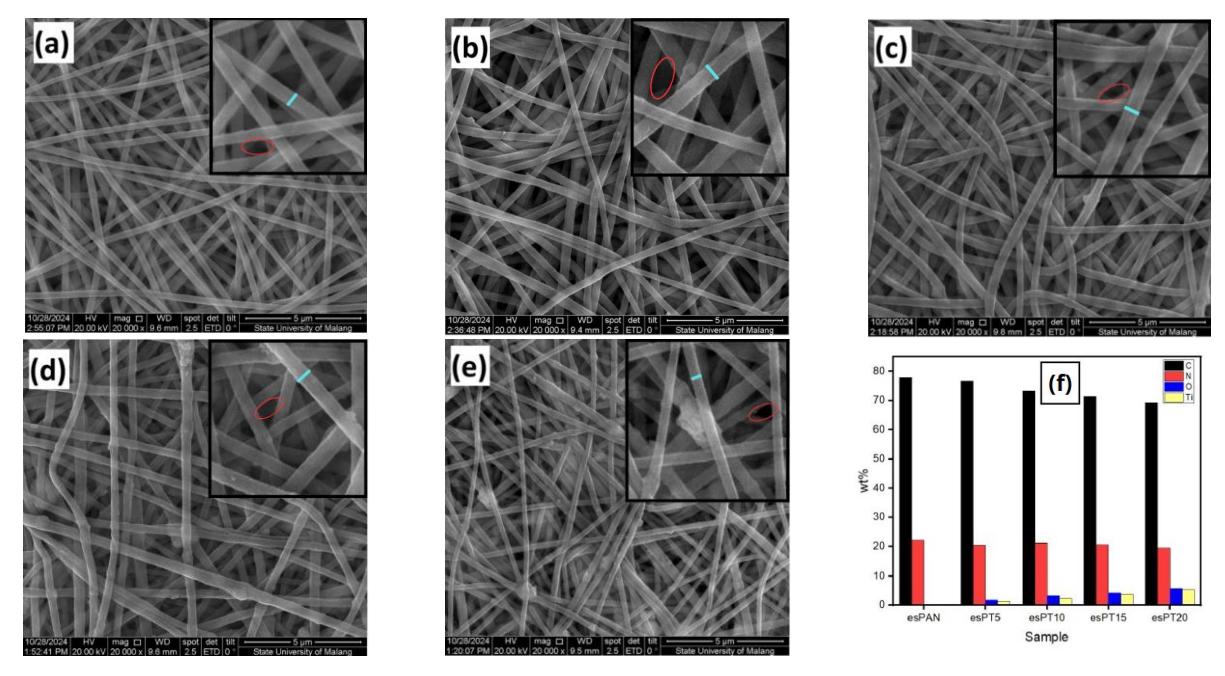
Morphology from SEM images: (a) esPAN, (b) esPT5, (c) esPT10, (d) esPT15, (e) esPT20 (f) EDX.
Electrolyte uptake ability for PAN/TiO2 separator membranes.
Thermogravimetric analysis of PAN/TiO2 separator membranes.
| Sample | Average fiber diameter (nm) | Average pore size (nm) | Porosity (%) | Electrolyte uptake (%) | Thermal Stability (°C) | Remaining mass after 1000° (%) | Crystallinity (%) |
|---|---|---|---|---|---|---|---|
| esPAN | 312.88 ± 3.24 | 160.98 | 54.64 | 116.57 | 273.2 | 0 | 19.72 |
| esPT5 | 295.79 ± 3.22 | 149.66 | 60.30 | 125 | 277.1 | 0 | 22.43 |
| esPT10 | 276.89 ± 1.90 | 147.18 | 64.80 | 200 | 278.5 | 3.83 | 25.12 |
| esPT15 | 244.73 ± 2.13 | 138.98 | 66.50 | 240 | 282 | 3.94 | 29.48 |
| esPT20 | 219.79 ± 3.30 | 108.60 | 62.90 | 150 | 273.6 | 0 | 35.83 |
Table 2 Performance comparison of PAN/TiO<sub>2</sub> separator membranes.
Electrochemical Performance of the Supercapacitor
Supercapacitor performance was characterized by Cyclic Voltammetry (CV), Electrochemical Impedance Spectroscopy (EIS), and Galvanostatic Charge Discharged (GCD) using two electrode system. The performance of good supercapacitor evaluated based on several key electrochemical parameters. These include a high specific capacitance, energy density, power density, also the high capacity retention over multiple cycles indicates the robustness and stability of the supercapacitor. A large curve area under the CV curve suggest excellent capacitive behavior. Furthermore, high ionic conductivity is essential to ensure the efficient ion transport which can affect the performance of supercapacitor.
CV results in Figure 7(a) shows that all curves exhibit a similar semi-rectangular shape and esPT15 has largest curve area. EIS results in Figure 8(a) shows that the smallest diameter is observed in esPT15, indicating the Rct values is smallest too. Figure 8(b) shows the fitting curve for esPT15, where the fitting errors for Rs and Rct are 0.95% and 0.54%, respectively. Table 3 shows the Rs, Rct, and ionic conductivity value after fitting, the highest ionic conductivity was obtained by esPT15 at \(4.4 \times 10^{-4}\) S/cm. GCD results in Figure 9(a) shows a triangular shape, also the longest charge discharge time and smallest IR drop value is observed in esPT15. Table 4 shows the specific capacitance, energy density, power density, and IR drop value for supercapacitor with PAN/TiO<sub>2</sub> membranes. esPT15 shows the highest supercapacitor performance with a gravimetric capacitance of 57.77 F.g<sup>-1</sup>, energy density of 7.105 Wh.kg<sup>-1</sup>, power density of 188.086 W.kg<sup>-1</sup>, and IR drop of 0.043 V. Figure 9(c) shows the capacity retention esPT15 after 1000 test cycles is 94.22%.
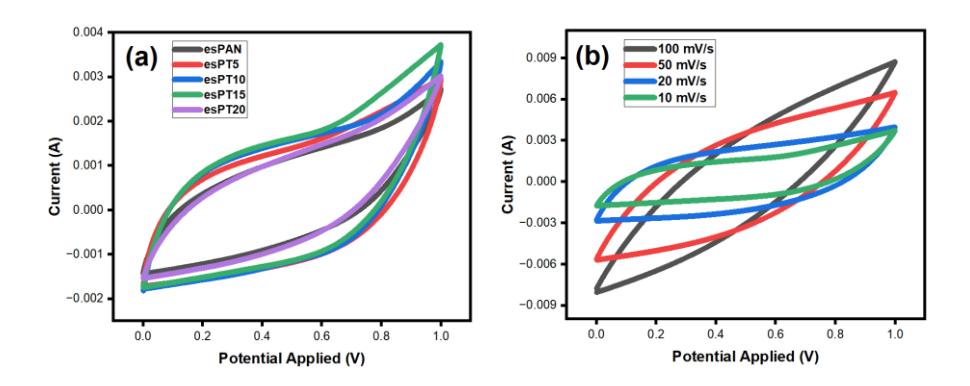
Figure 7 Cyclic voltammograms of (a) PAN/TiO<sub>2</sub> separator membranes at scan rate 10 mV/s, (b) esPT15 sample at scan rate of 10-100 mV/s.
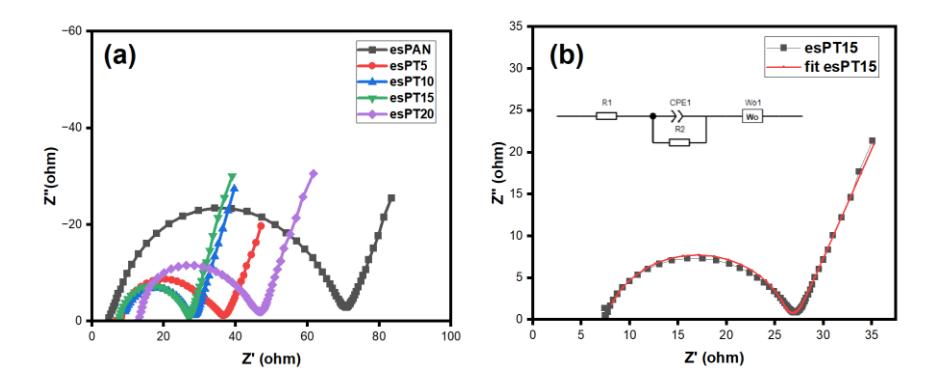
Figure 8 Nyquist plot of (a) PAN/TiO<sub>2</sub> separator membranes (b) fitting plot of esPT15 sample.
Table 3 Fitting parameters from EIS and ionic conductivity of PAN/TiO2 separator membranes.
| Sampel | Rs (ohm) | Rct (ohm) | Ionic Conductivity (S/cm) |
|---|---|---|---|
| esPAN | 4.97 | 61.11 | 1.32 × 10⁻⁴ |
| esPT5 | 8.02 | 25.30 | \(3.21 \times 10^{-4}\) |
| esPT10 | 8.18 | 19.13 | \(4.24 \times 10^{-4}\) |
| esPT15 | 7.57 | 18.44 | \(4.4 \times 10^{-4}\) |
| esPT20 | 12.46 | 31.47 | \(2.58 \times 10^{-4}\) |
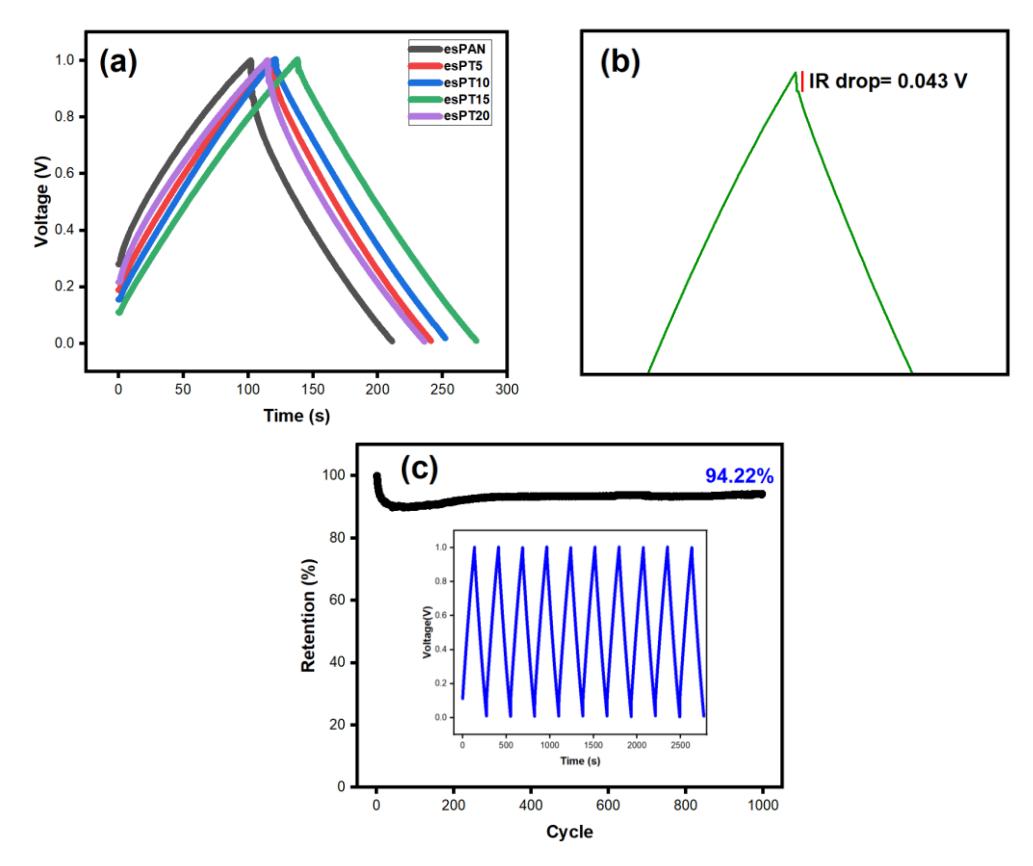
Figure 9 Electrochemical performance based on GCD test of (a) PAN/TiO2 separator membranes (b) IR drop of esPT15 (c) Retention of esPT15.
Table 4 Energy discharge comparison of PAN/TiO<sub>2</sub> separator membranes.
| Sample | Cs (F.g-1) | E (Wh.kg-1) | P (W.kg-1) | IR drop |
|---|---|---|---|---|
| esPAN | 46.848 | 4.271 | 161.037 | 0.135 |
| esPT5 | 48.798 | 5.319 | 173.222 | 0.083 |
| esPT10 | 55.761 | 5.809 | 176.336 | 0.046 |
| esPT15 | 57.770 | 7.105 | 188.086 | 0.043 |
| esPT20 | 48.595 | 5.090 | 172.818 | 0.082 |
Discussion
Characteristics of PAN/TiO<sub>2</sub> membrane
From Figure 2, it can be observed that pure PAN exhibits peaks at \(16.53^{\circ}\) and \(26.35^{\circ}\) (B. Liu et al., 2018). The peak at \(16.53^{\circ}\) corresponds to the PAN molecular chain, which has a semi-crystalline structure. The peak at \(26.35^{\circ}\) indicates a regular molecular orientation and stronger molecular interactions. This peak becomes smaller when concentration of \(TiO_2\) increases. This reduction is attributed to the interaction between \(TiO_2\) and the polymer chains, which disrupts the crystalline domains and leads to the reduction or disappearance of PAN's characteristic peaks (Rajakani & Vedhi, 2015).
For PAN/TiO2 composite membranes, new peaks appear at 25.21°, 37.79°, 47.87°, 53.89°, 54.91°, and 62.59°. These peaks indicate the presence of the anatase phase of TiO2, with no detectable peaks for impurities (Fu et al., 2020). As the mass of TiO2 increases, the peaks become sharper, indicating an increase in crystallinity with higher concentrations of TiO2. Based on the analysis, the crystallinity values were found to be 19.72%, 22.43%, 25.12%, 29.48%, and 35.83% for esPAN, esPT5, esPT10, esPT15, and esPT20, respectively, as shown in Table 2. The crystallinity of the separator should be within an optimal range. Excessively high crystallinity can result in a more rigid and less porous structure, which may restrict ion diffusion pathways (F. Liu & Chuan, 2021). Additionally, higher crystallinity can reduce electrolyte uptake, thereby decreasing ion transport efficiency.
There is almost no significant difference between pure PAN and PAN composited with TiO2, as shown in Figure 3, likely due to the relatively low percentage of TiO2 compared to PAN. High-intensity absorptions are observed at ~1074.35 and 2248.99 cm-1 , corresponding to the C-H and C≡N nitrile group stretching vibrations, respectively. A decrease in absorption intensity at both wavenumbers is observed as the TiO2 concentration increases, indicating a reduction in PAN polymer concentration. Additionally, a shift to a lower wavenumber at ~2248.99 cm-1 occurs with increasing TiO2 concentration, suggesting an interaction between the PAN nitrile groups and the surface of TiO2 nanoparticles, which may weaken the C≡N bond. At ~1670.35 cm-1 , the absorption peak shifts to a higher wavenumber with increasing TiO2 concentration. This shift may result from the enhanced bond strength of TiO2, which shortens the bond length and requires higher energy. Stronger interactions between PAN and TiO2 can change the pore structure and charge distribution of the membrane (Hartati et al., 2022).
Figure 4a-e shows the morphology of PAN/TiO2 fiber membranes with varying masses of TiO2. The SEM images reveal the presence of beads, indicating agglomeration at higher TiO2 concentrations. This is attributed to the excessive addition of TiO2, as shown in Figure 4f. When the amount of TiO2 exceeds a certain threshold, the polymer in the solution cannot distribute the particles evenly, resulting in bead formation (Mirmohammad Sadeghi et al., 2018). Additionally, it was observed that the diameter of the fiber decreases as the concentration of TiO2 increases. The fiber diameters range from 219.79 nm to 312.88 nm, which is consistent with the typical nanofiber diameter of less than 1 μm. TiO2 can increase the conductivity of the electrospinning solution, thereby enhancing the electrostatic force and pulling the solution more strongly (Nkabinde et al., 2020). A stronger pull during the electrospinning process leads to the formation of fibers with smaller diameters. Furthermore, the decrease in fiber diameter may also result from interactions between TiO2 and the polymer chains, making the fibers easier to stretch during the electrospinning process (Song et al., 2022).
The resulting pore sizes range from 108.60 nm to 160.98 nm and are related to the fiber diameter. As the concentration of TiO2 increases, both the fiber diameter and pore size decrease due to the formation of finer fibers. The ideal pore size for a separator is less than 1 μm and larger than the size of the electrolyte ions used (Das et al., 2023). In this research, we used Et4NBF4 electrolyte, which contains Et4N + and BF4 ion with diameters of 0.343 and 0.229 nm, respectively (T.R Jow, K.Xu, 1999). The results pore sizes larger than the diameters of the Et4NBF4 electrolyte ions allow for smooth ion transport during the charge-discharge process in supercapacitors. Based on SEM analysis, the porosity percentages of the separator membranes were also determined. A high percentage of porosity can result when the pore sizes are small, evenly distributed, and numerous (Zhou et al., 2014). Good porosity enhances the surface area of the membrane, which improves the electrolyte uptake of the nanofiber membrane (Sethupathy et al., 2013). The highest porosity was observed in esPT15 (66.50%) and slightly decreased to 62.90% in esPT20.
A good separator must exhibit excellent electrolyte uptake ability to ensure complete and rapid wetting upon contact with the electrolyte (Shekarian et al., 2019). If the electrolyte and separator have poor compatibility, the separator may become unstable, leading to inconsistent supercapacitor performance. Therefore, high porosity and electrolyte uptake can increase ionic conductivity, thereby facilitating fast ion transport in supercapacitors (Wu et al., 2023). The percentage of electrolyte uptake is shown in Figure 5. The electrolyte uptake on PAN/TiO2 membranes is more than 100%, which indicates that electrolyte ions of Et4NBF4 are well absorbed. Compared to pure PAN, the PAN/TiO2 membranes show an increased electrolyte uptake. This is attributed to the high affinity of TiO2 for water and organic solvents, which increases the hydrophilicity of the composite and thereby increases electrolyte uptake (Yamauchi et al., 2022). This improvement is also related to the porosity observed in the SEM results. The pores in the nanofiber membrane act as pathways for the movement of electrolyte ions. Therefore, higher porosity provides a greater volume of space to accommodate the electrolyte (He et al., 2017).
The percentage of electrolyte uptake increased with increasing TiO2 concentration, but it decreased in esPT20. The optimum electrolyte uptake was obtained in esPT15, reaching 240%. The decrease in electrolyte uptake observed in esPT20 can be attributed to the morphology revealed by the SEM results. The morphology of esPT20 shows
agglomeration, which reduces the specific surface area available for interaction with the electrolyte (X. Chen et al., 2022). A smaller specific surface area leads to a lower electrolyte absorption capacity (Abdelmaoula et al., 2021).
Figure 6 shows the TGA curves of PAN/TiO2 separator membranes. EsPT15 has the highest decomposition temperature at 282° C, with the smallest weight loss and a remaining mass of 3.94% up to 1000° C. This indicates that the esPT15 contributes to enhanced thermal stability of the membrane compared to the other samples. The thermal stability of pure PAN and membranes containing 5, 10, 15, and 20 wt% TiO2 are 273.2, 277.1, 278.5, 282, and 273.6°C, respectively, as shown in Table 2. These results demonstrate that PAN membranes with TiO2 composites exhibit higher thermal stability than pure PAN membranes. The addition of TiO2 increases the stiffness of the membrane, leading to higher thermal stability (Maqsood et al., 2023). However, in the membrane with highest TiO2 concentration, thermal stability decreases, likely due to the relatively less dense fiber structure and lower porosity. As shown in Figure 6, the decomposition rate of the esPT15 membrane is slower in the 600 - 1000°C range compared to the other membranes. EsPT15 also shows the highest remaining mass, as TiO2 is stable at high temperatures, and a higher TiO2 concentration generally results in greater residual mass after decomposition at 1000°C. However, esPT20 sample shows no remaining mass after 1000°C, which may be attributed to its agglomerated morphology that reduces the specific surface area and affects heat propagation (Z. Q. Zhang et al., 2019).Therefore, based on the TGA results, the esPT15 membrane exhibits good thermal stability, making it suitable for efficient supercapacitor applications.
Electrochemical Performance of the Supercapacitor
The cyclic voltammetry test was conducted using a two-electrode system to evaluate the electrochemical performance of the supercapacitor. A voltage range of 0-1 V was applied, with scan rates of 100, 50, 20, and 10 mVs-1 . All curves exhibit a similar semi-rectangular shape, indicating electric double-layer capacitor (EDLC) behaviour due to the use of a carbon-based electrode. Figure 7a shows that the curve area of the esPAN sample is the smallest compared to PAN/TiO2 composite samples. The EsPT15 sample displays the largest curve area, suggesting that the separator membrane with 15 wt% of TiO2 provides optimum charge-discharge cycles with minimal degradation. This also indicates that electrolyte ions can move more freely, enabling greater charge storage and release by the electrode. Figure 7b shows the CV curves of esPT15 at various scan rates. An uninterrupted curve shape is obtained, indicating that the charge diffusion is good and the supercapacitor performance is stable. However, there is a change in the shape of the curve, with a slight peak at the end at scan rates of 50 and 100 mV.s-1 . This is caused by insufficient diffusion of electrolyte ions, which restricts their free movement across the separator (M. Chen et al., 2020)
Electrochemical impedance spectroscopy was conducted to obtain information on ion diffusion and charge transfer processes (Mei et al., 2018). Figure 8a shows the Nyquist plots for all samples, characterized by a semicircle followed by a tail inclined at approximately 45 degrees. The diameter of the semicircle represents the charge transfer resistance (Rct), which reflects the resistance to electron transfer at the electrode and electrolyte interface (Sunil et al., 2020). The starting point of the impedance spectrum, referred to as Rs, indicates the electrolyte resistance between the electrode and the separator (Ertekin et al., 2021).
Figure 8a also shows that the diameter of the semicircle for pure PAN is larger than that of PAN with TiO2 composites. The smallest diameter is observed in esPT15, with an Rct value of 18.44 ohm, while Rct increases to 31.47 ohm in esPT20. A lower Rct value indicates more efficient electron transfer and faster electrochemical reactions thereby enhancing capacitive performance (Singh et al., 2021). The lowest Rs value is also obtained in esPT15, at 7.57 ohm. Lower Rs and Rct values are favorable for improving supercapacitor performance. Specifically, a lower Rs indicates higher ionic conductivity of the electrolyte and a faster charge-discharge process (Wang et al., 2023). Figure 8b shows the fitting curve for esPT15, where the fitting errors for Rs and Rct are 0.95% and 0.53%, respectively. These very small percentage errors indicate the suitability of the fitting circuit in representing the results of the Nyquist plot.
Table 5 Comparison ionic conductivity values with previous studies.
| Sample | Rs (ohm) | Rct (ohm) | Ionic Conductivity (S/cm) | Reference |
|---|---|---|---|---|
| esPT15 | 7.57 | 18.44 | 4.4 × 10⁻⁴ | This work |
| PP | - | - | 0.11 × 10⁻⁴ | (Sun et al., 2014) |
| Alg/NH4NO3 | - | - | 0.56 × 10⁻⁴ | (Mazuki et al., 2020) |
Based on calculations using Eq. (5), the ionic conductivity values of the PAN/TiO2 separator membranes are presented in Table 3. The ionic conductivity value of PAN/TiO2 composite is greater than pure PAN. This improvement can be attributed to of the membrane's porosity and electrolyte uptake. Membranes with high porosity and good electrolyte
absorption allows ions to move freely, thereby increasing ionic conductivity (Zhao et al., 2022). The ionic conductivity increases with the addition of \(TiO_2\) mass, but decreases in the sample with highest \(TiO_2\) mass. The highest ionic conductivity was obtained in esPT15 at \(4.4 \times 10^{-4}\) S/cm. A comparison of the results of this study with previous studies is summarized in Table 5. Among all the studies listed, the ionic conductivity obtained in this study remains higher, indicating that the PAN/\(TiO_2\) separator was successfully applied in supercapacitors.
The charge-discharge curve in Figure 9a shows a triangular shape, indicating that the charge and discharge processes do not involve complex reaction kinetics, resulting in similar charge and discharge times. The longest discharge time is observed in esPT15, reaching 276 seconds. This is due to a reduction in the transfer resistance of electrolyte ions in esPT15, as confirmed by the EIS test. The graph also shows a slight voltage drop when switching from the charge process to the discharge process, known as the IR drop (Biradar et al., 2021). IR drop is the voltage loss that occurs in an electrical device due to the flow of current through the system's internal resistance. When the IR drop value is too large, it results in suboptimal device performance. EsPT15 has the smallest IR drop at 0.043 V, as shown in Figure 9b, indicating good electrochemical performance and electrical conductivity due to rapid ion transfer. Table 4 shows the gravimetric capacitance, energy density, and power density of the supercapacitor with PAN/TiO<sub>2</sub> membranes. EsPT15 exhibits the best supercapacitor performance with a gravimetric capacitance of 57.77 F.g<sup>-1</sup>, which decreases in esPT20 due to the agglomeration of the separator membrane that reduces the supercapacitor performance.
Separator Electrolyte Electrode Cs (F/g) E (Wh.kg-1) P (W.kg-1) Retention Reference (K. M. Kim et al., 2017) PAN KOH AC 27.5 PVDF TEABF<sub>4</sub> Graphene 28.46 35.58 7500 (Sahoo et al., 2019) PAN/PVDF Et<sub>4</sub>NBF<sub>4</sub> AC-CB 54.104 1.143 38.827 (Azizah et al., 2023) 188.086 94.22% (1000) PAN/TiO<sub>2</sub> Et<sub>4</sub>NBF<sub>4</sub> AC-CB 57.770 7.105 This work
Table 1 Comparison electrochemical performance with previous studies.
The esPT15 sample shows a retention of 94.22% after 1000 test cycles, as shown in Figure 9c. This impressive capacity retention is attributed to its high porosity, which result in the highest electrolyte uptake of 240%. Good porosity and electrolyte uptake allows ions to move freely and reduce ionic resistance (Song et al., 2022). Additionally, based on the TGA results, the esPT15 sample exhibits the longest decomposition time, indicating greater durability when applied in devices. A comparison of this study's results with previous studies is summarized in Table 6. Among all the studies listed, the specific capacitance in this study remains higher, indicating that the PAN/TiO<sub>2</sub> separator was successfully applied in supercapacitors.
Conclusion
Separator membranes based on PAN and composite \(TiO_2\) with various masses were successfully synthesized using the electrospinning technique. The SEM analysis showed that the average nanofiber diameter ranged from 219.79 nm to 312.88 nm, and the pore size ranged from 108.60 nm to 160.98 nm. At the highest concentration of \(TiO_2\) (esPT20), bead formation was observed, indicating agglomeration due to poor dispersion of particles in the polymer solution. PAN/\(TiO_2\) composite membranes demonstrated better performance than pure PAN membranes. The EsPT15 sample exhibited the highest porosity of 66.50%, electrolyte uptake of 240%, and thermal stability of 282°C. The separator with 15 wt% \(TiO_2\) showed the optimum electrochemical performance, with an ionic conductivity of \(4.4 \times 10^{-4}\) S/cm, energy density of 7.105 Wh.kg<sup>-1</sup>, power density of 188.086 W.kg<sup>-1</sup>, gravimetric capacitance of 57.770 F.g<sup>-1</sup> and a retention rate of 94.22% after 1000 cycles. These results indicate that the PAN/\(TiO_2\) separator was successfully applied in supercapacitors.
Acknowledgement
The authors gratefully acknowledge the financial support from the DRTPM Research grant PFR scheme for the 2024 implementation year. The authors also thank the UNS Integrated Laboratory for providing the electrospinning equipment.
Compliance with ethics guidelines
The authors declare they have no conflict of interest or financial conflicts to disclose.
This article contains no studies with human or animal subjects performed by authors.