
Introduction
Electrochemiluminescence sensor is a device based on electrochemical principles that detects the concentration or properties of specific substances by measuring changes in electrical signals. It has near zero background noise, good robustness, low cost, and good temporal and spatial robustness (Xing et al. 2024; Luo et al., 2022). It has been largely applied in environmental monitoring, biomedicine, food safety, and industrial engineering control (Li et al. 2024; Li et al. 2022; Li et al. 2025). In recent years, driven by science and technology, the continuous emergence of new nanomaterials has provided an opportunity for the development of electrochemiluminescence sensors (Tang et al., 2022). Graphene acetylene is a new type of 2D carbon material, which is a new type of carbon allotrope formed by hybridization of sp and sp2. It is a fully carbon material with a 2D planar network structure formed by conjugation of benzene rings with 1 and 3-diyne bonds. It has rich carbon chemical bonds, large conjugated systems, wide interplanar spacing, porosity, excellent chemical properties, thermal stability, semiconductor properties, as well as mechanical, catalytic, and magnetic properties. It is known as the most stable artificially synthesized allotrope of diyne carbon (Zhu et al., 2022; Li et al., 2023). Graphdiyne Oxide Quantum Dots (GDYO-QD) are a derivative of graphene, which inherits the excellent properties of graphene and has broad application prospects in electronics, semiconductors, and new energy (Zhang et al., 2022). Zinc Oxide Derived from Metal Organic Frameworks (M-ZnO) refers to ZnO materials prepared by thermal decomposition of metal organic framework precursors. The metal organic framework is a coordination polymer with a 3D network structure formed by self-assembly of metal ions or metal cluster compound ions as coordination centers with organic ligands, and has multifunctionality (Lu et al., 2022; Li et al., 2022). By pyrolyzing metal organic framework precursors, ZnO materials with high purity and specific morphology can be obtained, which have wide applications in fields such as photocatalysis, gas adsorption, and separation (Feng et al., 2022). In this context, this study prepares a GDYO-QD@M-ZnO-based electrochemiluminescence sensor by adsorbing GDYO-QD onto M-ZnO to enhance the performance of the electrochemiluminescence sensor. The innovation of the research lies in realizing the composite structure of GDYO-QD and M-ZnO, which retains the excellent properties of GDYO-QD and M-ZnO, and improves the interface charge transfer efficiency, providing ideas for new electrochemiluminescence sensors and promoting the development of related technologies.
Experimental materials and methods
Experimental materials
The materials and reagents used in the experiment include graphdiyne, 2-Methylimidazole (\(C_4H_6N_2\)), zinc nitrate hexahydrate (\(Zn(NO_3)_2 \cdot 6H_2O\)), potassium permanganate (\(XMnO_4\)), hydrogen peroxide (\(H_2O_2\)), concentrated nitric acid (\(H_2O_3\)), concentrated sulfuric acid (\(H_2SO_4\)), methanol (\(C_3O_4\)), aluminum oxide (\(A_2O_3\)), distilled water, and ethyl alcohol (\(C_2H_3O_4\)). The relevant information is shown in Table 1.
Experimental instruments
The experimental instruments used in the experiment mainly include electrochemiluminescence detector, electrochemical workstation, Scanning Electron Microscope (SEM), Transmission Electron Microscope (TEM), Fourier Transform Infrared Spectrometer (FTIR), X-Ray powder Diffractometer (XRD), Raman spectrometer, X-ray Photoelectron Spectroscopy (XPS), ultraviolet visible near-infrared spectrophotometer, fluorescence spectrophotometer, ultraviolet visible near-infrared spectrophotometer, nanoparticle size and Zeta potential analyzer, refrigerated centrifuge, electric heating air-blowing drier, pH meter, chamber electric furnace, vacuum oven, ion sputtering apparatus, glassy carbon electrode, platinum wire electrode, and silver chloride/silver oxide electrode. The specific details of these instruments are shown in Table 2.
Preparation of GDYO-QD@M-Zno-based electronichemiluminescence sensor
GDYO-QD was prepared using acid oxidation method. 10 mg of KMnO4 powder was placed into a mixed solution of 1 ml of HNO3 and 3 ml of H2SO4, 10 mg of powdered graphdiyne was added, and the mixture was stirred evenly. The mixed solution was heated in a water bath at 80 °C for 1 day, cooled down, and the pH value was adjusted to 8.0. The mixed solution was centrifuged in a freeze centrifuge at 8,000r/min for 10 minutes. The product obtained after centrifugation is passed through a dialysis bag with a cut-off flow rate of 3500 Daltons for 3 days, and the water in the dialysis bag is replaced once a day. After dialysis, the dialysis product is concentrated by rotary evaporation and sonicated for 1 day. Heat the product in a 100 °C oil bath for 6 hours, centrifuge to obtain the supernatant, and concentrate to obtain a 0.8 mg/mL GDYO-QD solution. 0.3 g of Zn(NO3)2·6H2O and 0.66 g of C4H6N2 were added to 5 mL of CH3OH, and the mixture was stirred evenly. It was left to stand for 1 day. The mixed solution was centrifuged at 6,000r/min for 10 minutes. The centrifuged product was washed in CH3OH to remove impurities and dried at 80°C to obtain solid 2-methylimidazolium zinc. 2-methylimidazolium zinc was placed into a magnetic boat, and the temperature was adjusted to 550°C. It was calcined for 3 hours to obtain M-ZnO powder. GDYO-QD solution was mixed with M-ZnO, the mixture was stirred evenly, and the mixed solution was left overnight to obtain GDYO-QD@M-ZnO solution. The glassy carbon electrode was polished using Al2O3 and sequentially cleaned in HNO3, C2H5OH, and distilled water. 5 μL of GDYO-QD@M-ZnO solution was evenly applied onto the glassy carbon electrode. After drying, the electrochemiluminescence sensor was prepared. The preparation process of the GDYO-QD@M-ZnO-based electrochemiluminescence sensor is shown in Figure 1.
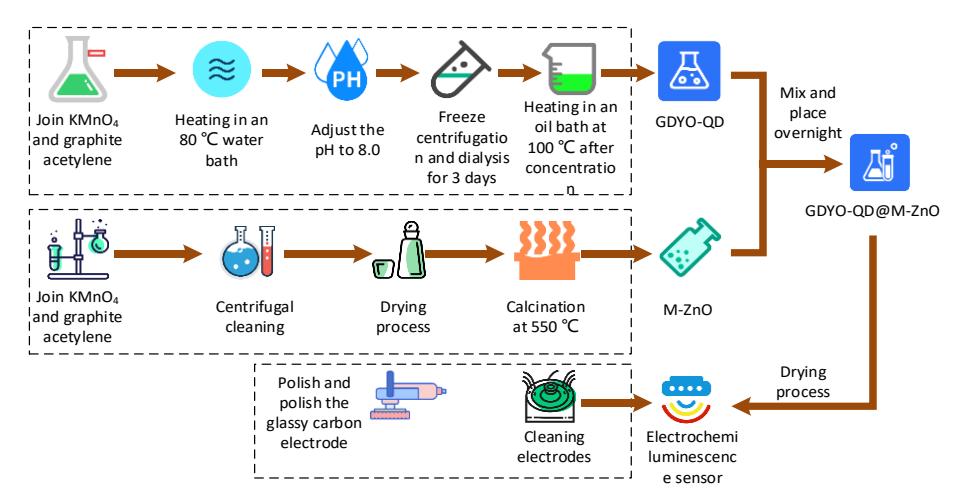
Figure 1 Preparation process of electrochemiluminescence sensor based on GDYO-QD@M-ZnO
Performance testing of GDYO-QD@M-ZnO-based electronichemiluminescence sensor
Material characterization testing
SEM and TEM are used to characterize the morphology of GDYO-QD@M-ZnO-based electrochemiluminescence sensors. Firstly, SEM is used for observation, and the prepared GDYO-QD@M-ZnO is uniformly applied onto the conductive adhesive and fixed on the sample stage. An ion sputtering instrument is used to coat a thin gold film on the sample surface. The gold plated sample is placed in the SEM sample bin, and the acceleration voltage is adjusted to 5 kV-15 kV. The surface morphology of the material is obtained (Li et al., 2022; Bushira et al., 2022). Then, TEM is used for observation. A small amount of GDYO-QD@M-ZnO solution is injected into C2H5OH and sonicated for 30 minutes. A copper mesh is picked up with tweezers and immersed in the sample solution. It is left to stand for 1 minute to allow the sample to be evenly adsorbed onto the copper mesh. The copper mesh is taken out for drying and placed in the TEM sample bin. The accelerating voltage is adjusted to 200 kV, and the microstructure of the sample is observed (Shang etal., 2022; Sun et al., 2024).
GDYO-QD@M-ZnO spectral testing
The spectrum of GDYO-QD@M-ZnO is obtained using XRD, Raman spectrometer, and FTIR. Firstly, XRD analysis is conducted by placing the M-ZnO sample on a sample stage. The XRD scanning range is set to 10°-80°, the scanning rate to 5°/min, the tube voltage to 40 kV, and the tube current to 40 mA. XRD is started, the XRD diffraction pattern is recorded, and the crystal structure of M-ZnO is analyzed. Then, a Raman spectrometer is used to analyze the characteristic peaks of GDYO-QD@M-ZnO. The laser wavelength of the Raman spectrometer is set to 532 nm, the integration time is set to 10 s, and the scanning frequency is 3 times. The instrument is started, the Raman spectrum is recorded, and the characteristic Raman peaks of the sample are analyzed. Finally, FTIR is used to analyze the molecular characteristics of GDYO-QD@M-ZnO. An appropriate sample is taken and placed on the FTIR sample holder. The scanning range is set to 400 cm⁻¹ - 4,000 cm⁻¹, the resolution to 4 cm⁻¹, and the scanning frequency to 32 times. FTIR is started, the FTIR spectrum is recorded, and the characteristic absorption peaks of the sample are analyzed (Dong et al., 2023; Hao et al., 2023).
GDYO-QD@M-ZnO element composition testing
The elemental composition of GDYO-QD@M-ZnO is analyzed by XPS. The prepared GDYO-QD@M-ZnO solution is applied evenly onto the conductive adhesive. The conductive adhesive is placed in the XPS sample chamber, and the chamber is evacuated to a vacuum state using a vacuum pump to prevent photoelectrons from colliding and scattering with gas molecules during transmission (Qi et al., 2023). The X-ray source is opened, the sample surface is irradiated, the escape of photoelectrons is induced, and the escaped photoelectrons are focused into an energy analyzer through an electron lens system to measure their kinetic energy distribution. The scanning range is set to 0 eV-1,500 eV, and the characteristic photoelectron peaks of the surface elements of the sample are recorded.
Semiconductor property testing of GDYO-QD@M-ZnO material
Ultraviolet visible near-infrared spectrophotometer is used to test the semiconductor properties of GDYO-QD@M-ZnO. An appropriate amount of GDYO-QD@M-ZnO sample is taken, sonicated in C2H5OH solution for 30 minutes, filled into a solid sample chamber, and the sample chamber is installed into an ultraviolet visible near-infrared spectrophotometer. The wavelength range is set to 190 nm - 850 nm, the scanning range to 200 nm - 1,100 nm, and the resolution to 1 nm. The photon energy and absorption coefficient are calculated based on the absorption spectrum data. The Tauc formula is used to draw the Tauc graph. The Tauc is shown in Eq. (1).
\[(\alpha h v)^2 = A (h v - E_g) \tag{1}\]
In equation (1), presents the absorption coefficient. ℎ represents photon energy. represents the bandgap. is a constant (Bushira et al., 2023). Mott-Schottky is used to evaluate the carrier concentration and flat band potential of GDYO-QD@M-ZnO. GDYO-QD@M-ZnO droplets are applied onto conductive glass and left to dry to prepare the sample electrode. Three electrodes are used for the experiment, with silver chloride/silver oxide electrode selected as the reference electrode, platinum wire electrode selected as the counter electrode, the prepared sample electrode used as the working electrode, and pH=7.0 PBS solution used as the electrolyte. The potential range is set to -1.0 V to 1.0 V, the amplitude of the alternating current signal is set to 10 mV, and the frequency is set to 1,000 Hz. A potential scan is performed, the impedance data of the electrode is recorded, and the collected data is converted into a graph showing the relationship between 1/C² and potential (E). The Mott-Schottky is shown in Eq (2).
\[\frac{1}{C^2} = \frac{2}{\partial \hat{\sigma} \varepsilon_0 eN} (V - V_{fb}) \tag{2}\]
In Eq. (2), V represents the applied potential. Vfb signifies the flat band potential. signifies the dielectric constant of a semiconductor. signifies the vacuum dielectric constant. e represents electronic charge. N represents the carrier concentration (Elmoghazy et al., 2023).
Electrochemical properties testing of electrochemiluminescence sensor
Cyclic voltammetry is used to test the electrochemical properties of electrochemiluminescence sensors. The GDYO-QD@M-ZnO-modified electrode is cleaned thoroughly to ensure that the surface is free of impurities. The working electrode, counter electrode, and reference electrode are connected to the corresponding interfaces. The potential scanning range is set to -1.0 V - 1.0 V, the scan rate is set to 10 mV/s – 100 mV/s, and the cycle is set to 3-5 times. The electrochemical workstation software is opened, the cyclic voltammetry testing mode is selected, a potential scan is performed, and the current response is recorded. Moreover, in the electrochemical workstation software, the mode is switched to the electrochemical impedance spectroscopy testing mode, and the frequency range of the alternating current signal is set to 0.01 Hz to 100 kHz with an amplitude of 10 mV. During testing, impedance data at different frequencies are recorded, and a Nyquist plot is drawn. The charge transfer resistance is determined through the semicircle diameter in the Nyquist plot. A large semicircle diameter signifies a high charge transfer resistance. The electron transfer speed is slower (Firoozbakhtian et al., 2023).
Free radical detection of electrochemiluminescence sensor
Free radical solutions of different concentrations are prepared separately. The GDYO-QD@M-ZnO-modified electrodes are immersed in electrolytes containing different concentrations of free radicals and left to stand for 10 minutes to ensure full contact between the electrode and the electrolyte. The electrode immersed in the free radical solution is connected to an electrochemiluminescence detector, the appropriate potential range and scanning speed are set, and the electrochemiluminescence intensity of the electrode at different free radical concentrations is recorded. The changes in electrochemiluminescence intensity of electrodes under different concentrations of free radicals are compared, and the influence of free radicals on the electrochemiluminescence signal is explored.
Stability testing of electrochemiluminescence sensor
The prepared GDYO-QD@M-ZnO-modified electrode is placed in a free radical solution. The continuous scanning test is performed using an electrochemiluminescence detector. The electrochemiluminescence intensity of the electrode at different time points is recorded, and the changes in luminescence intensity during the continuous testing process are analyzed. If the luminescence intensity remains basically unchanged during the testing period, it indicates that the electrode has good short-term stability. If the luminescence intensity of the electrode can still maintain a high level for a long time without significant changes, it indicates that the electrode has good long-term stability (Shelash et al., 2024).
Reproducibility testing of electrochemiluminescence sensor
Under the same conditions, multiple GDYO-QD@M-ZnO-modified electrodes are prepared and tested in three different solutions with the same concentrations of vitamin C, metformin hydrochloride, and troxerutin. Each electrode is subjected to electrochemiluminescence intensity testing under the same testing conditions. The electrochemiluminescence intensity of each electrode is recorded, and the changes are recorded. Small changes indicate better reproducibility of the sensor.
Interference experiment of electrochemiluminescence sensor
A solution of troxerutin and metformin hydrochloride with the same concentration as the target substance solution is prepared. A fusion of vitamin C, starch, magnesium stearate, dextrin, hydroxypropyl methylcellulose, ethylenediaminetetraacetic acid, silica, talcum powder, glucose, and polysorbate with a concentration 100 times that of the target substance is prepared. A blank control group without any excipients is set up. The GDYO-QD@M-ZnOmodified electrode is immersed into the target solution, the electrochemiluminescence signal is recorded, auxiliary materials are added separately to the target solution, and the signal is recorded again.
Photochromic property test
The Canon EOS 5D Mark IV digital camera is used to record the initial appearance of the material in natural light. Celhxf300 monochromatic light sources with 254 nm, 300 nm, 365 nm and 500 nm wavelengths are used to irradiate the samples, with the light source power fixed at 100 mw/cm2 , and the appearance changes after different irradiation times are recorded. The U-3310 UV VIS spectrophotometer and dxr3 Raman spectrometer are used to test the position and intensity change of characteristic absorption peak of the material before irradiation, after irradiation and after being placed in the dark for different times, and calculate the percentage change of peak intensity. After irradiation, the sample is placed in the dark, and the time for its appearance and spectrum to return to their original state is recorded. The test is repeated and the retention rate of characteristic peak intensity after the n-th cycle is recorded.
Result
GDYO-QD@M-ZnO material characterization
Figure 2 (a) shows the SEM image of GDYO-QD@M-ZnO. Figure 2 (b) shows the TEM image of GDYO-QD@M-ZnO. From Figure 2 (a), GDYO-QD is relatively dispersed, because the surface of GDYO-QD is rich in a large number of hydrophilic groups, which make GDYO-QD have good dispersibility in solution. From Figure 2 (b), M-ZnO had a diameter of about 50 nm, with relatively large specific surface area, which improved the catalytic performance and electrochemical activity of the material.
GDYO-QD@M-ZnO material characterization.
Spectral diagram of GDYO-QD@M-ZnO material
Figure 3(a) shows the XRD diagram of GDYO-QD@M-ZnO. Figure 3 b) displays the Raman spectrum of GDYO-QD@M-ZnO, and Figure 3(c) displays the infrared spectrum of GDYO-QD@M-ZnO. From Figure 3(a), as the wavelength increased from 200 nm to 700 nm, the absorption coefficient of GDYO-QD decreased from 2.03 a.u. to 0.39 a.u., while the absorption coefficient of M-ZnO varied between 0.71 a.u. and 0.89 a.u. The absorption coefficient of GDYO-QD@M-ZnO varied between 0.70 a.u. and 1.32 a.u. This indicates that GDYO-QD@M-ZnO absorbed GDYO-QD and M-ZnO, and only mixes with each other without any reaction. From Figure 3(b), GDYO-QD exhibited peaks at wavelengths of approximately 1,350 nm and 1,600 nm, M-ZnO exhibited peaks at wavelengths of approximately 100 nm, 440 nm, and 1,150 nm, and FD exhibited peaks at wavelengths of approximately 100 nm, 440 nm, 1,150 nm, 1,350 nm, and 1,600 nm. This indicates that GDYO-QD@M-ZnO possesses the characteristics of two sub-substances simultaneously. From Figure 3(c), the curves of GDYO-QD and graphdiyne were similar. Compared with C4H6N2, there was no peak at a wavelength of about 440 nm, indicating that C4H6N2 was completely converted to M-ZnO, and GDYO-QD@M-ZnO had both the characteristics of M-ZnO and GDYO-QD, proving its effectiveness.
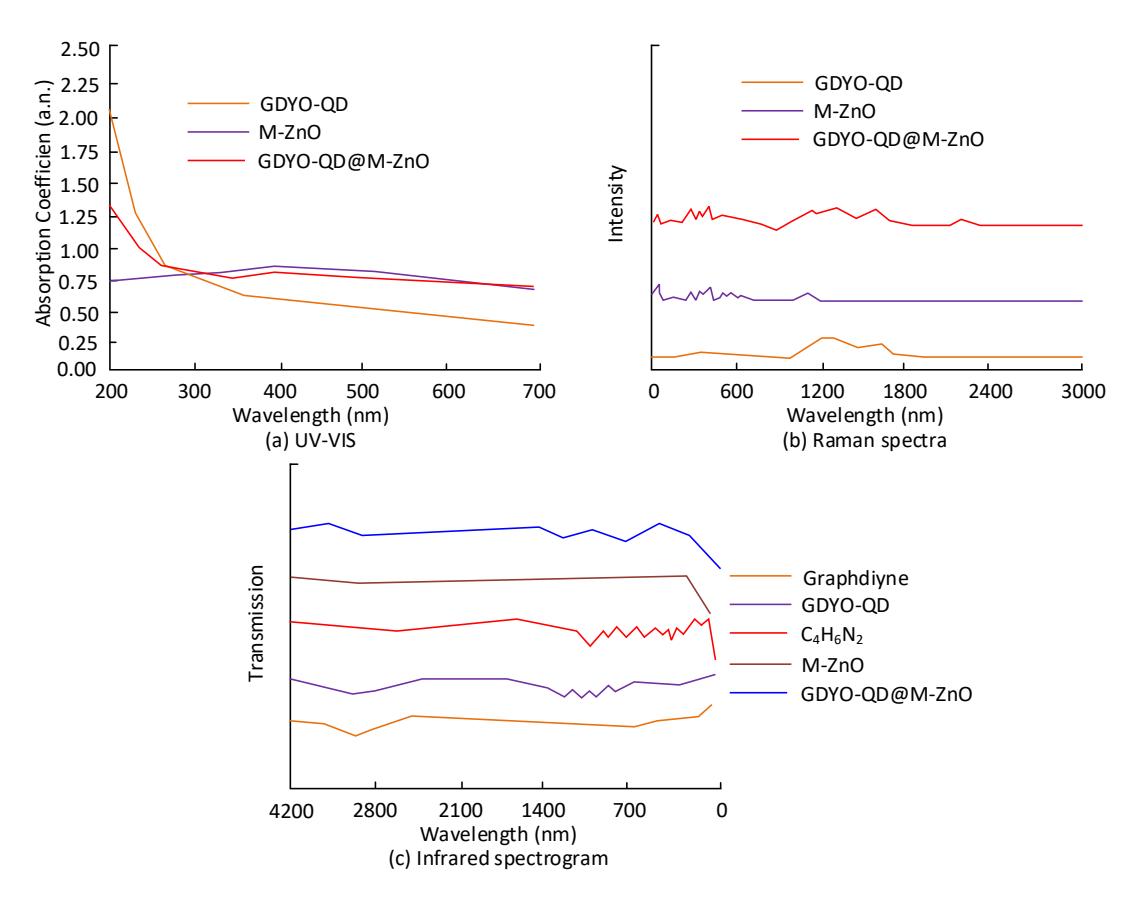
Figure 3 The spectral diagram of GDYO-QD@M-ZnO material.
XPS image of GDYO-QD@M-ZnO material
Figure 4 shows the XPS image of GDYO-QD@M-ZnO. From Figure 4, in GDYO-QD@M-ZnO, it mainly contains one C 1s peak, one O 1s peak, one Zn \(2p_{3/2}\) peak, and one Zn \(2p_{1/2}\) peak, indicating that it was mainly composed of carbon, oxygen, and zinc. The binding energy position of the C 1s peak was approximately 284.6 eV, which coincided with the characteristic binding energy of \(sp^2\) and sp hybrid bonds of carbon in graphdiyne. This indicates that GDYO-QD maintains its carbon framework structure in the composite material and does not undergo significant chemical bond breakage or reconstruction. The binding energy position of the O 1s peak was approximately 530.0 eV, which was consistent with the characteristic binding energy of oxygen in ZnO, and the peak shape of the O 1s peak was relatively symmetrical. The Zn \(2p_{3/2}\) peak was approximately 1,021.8 eV, while the Zn \(2p_{1/2}\) peak was approximately 1,044.8 eV, which was consistent with the binding energy of zinc in standard ZnO. The chemical environment of oxygen and oxygen is relatively uniform, with no obvious oxygen defects or impurities introduced.
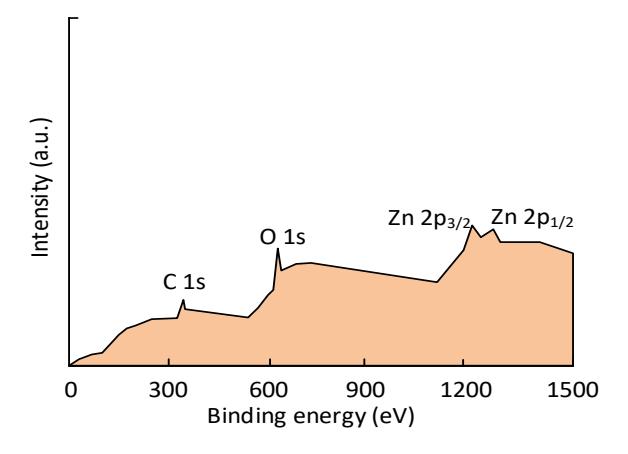
Figure 4 The XPS image of GDYO-QD@M-ZnO
Semiconductor properties of GDYO-QD@M-ZnO material
Figure 5 (a) shows the Tauc diagram of GDYO-QD@M-ZnO, and Figure 5 (b) shows the Mott-Schottky diagram of GDYO-QD@M-ZnO. According to Figure 5 (a), the optical bandgap of GDYO-QD was 1.35 eV, and the optical bandgap of M-ZnO was 3.13 eV. The narrow bandgap of GDYO-QD indicates its good absorption ability for visible light, while the wide bandgap of M-ZnO indicates its high absorption efficiency for ultraviolet light. Because in a narrow bandgap, the energy required to excite electrons from the valence band to the conduction band is lower. At a wider bandgap, electrons require higher energy to transition. From Figure 5 (b), the flat band potential of GDYO-QD was 0.18 V, and the M-ZnO was 0.24 V, indicating that there was a certain complementarity between the two, which improved the charge transfer efficiency of GDYO-QD@M-ZnO, thereby enhancing the electrochemiluminescence performance. The reason is that when GDYO-QD is combined with M-ZnO, the separation and transport of electrons and holes are more efficient.
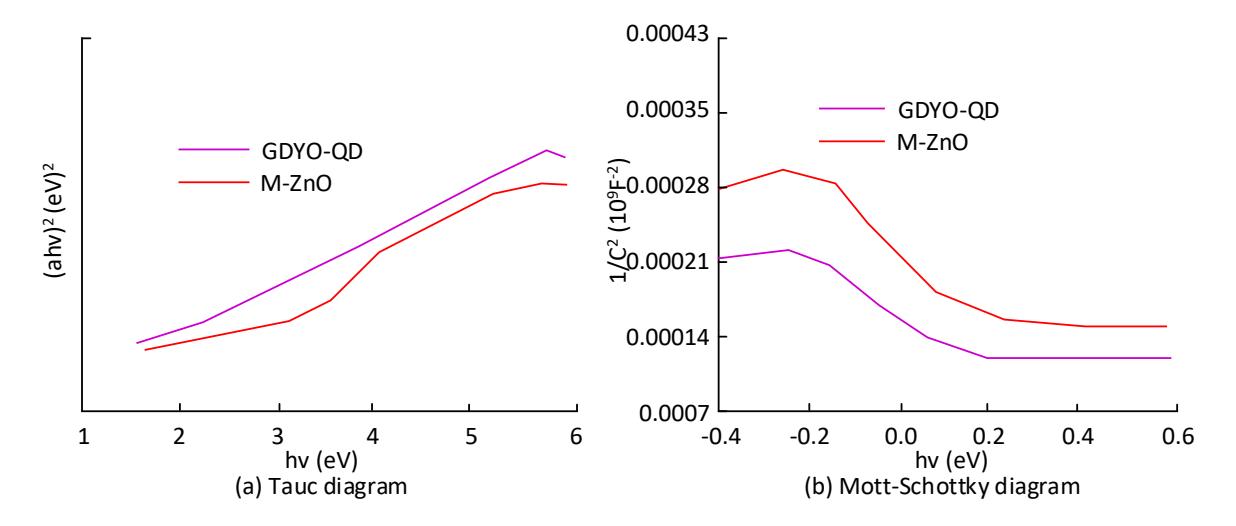
Figure 5 Semiconductor performance test results of GDYO-QD@M-ZnO material.
Electrochemical properties of electrochemiluminescence sensors
Figure 6 (a) shows the cyclic voltammetry test results of the electrochemiluminescence sensor, and Figure 6 (b) shows the electrochemical impedance spectrum of the electrochemiluminescence sensor. From Figure 6 (a), with the change of potential, the currents under GDYO-QD, M-ZnO, and GDYO-QD@M-ZnO-modified electrodes all showed an initial increase followed by a decrease. The peak current under GDYO-QD-modified electrode was 13.8 μA, under M-ZnO-modified electrode was 10.3 μA, and under GDYO-QD@M-ZnO-modified electrode was 29.6 μA. The peak current under the GDYO-QD@M-ZnO-modified electrode was significantly higher than that under the other two modified electrodes, indicating that the electron transport capability of the GDYO-QD@M-ZnO-based electrochemiluminescence sensor is strong. This is because the charges under GDYO-QD@M-ZnO-modified electrodes have lower charge transfer impedance, making electron transfer on the electrode surface smoother, thereby improving the response speed and sensitivity of the sensor. From Figure 6 (b), the charge transfer resistance was highest under the M-ZnO-modified electrode, followed by the GDYO-QD-modified electrode, and lowest under the GDYO-QD@M-ZnO-modified electrode. This further proves that the charge transfer process of GDYO-QD@M-ZnO-based electrochemiluminescence sensors is more efficient. The reason is that there is a synergistic effect between GDYO-QD and M-ZnO, which optimizes the electron transfer path and enables electrons to transfer more quickly.
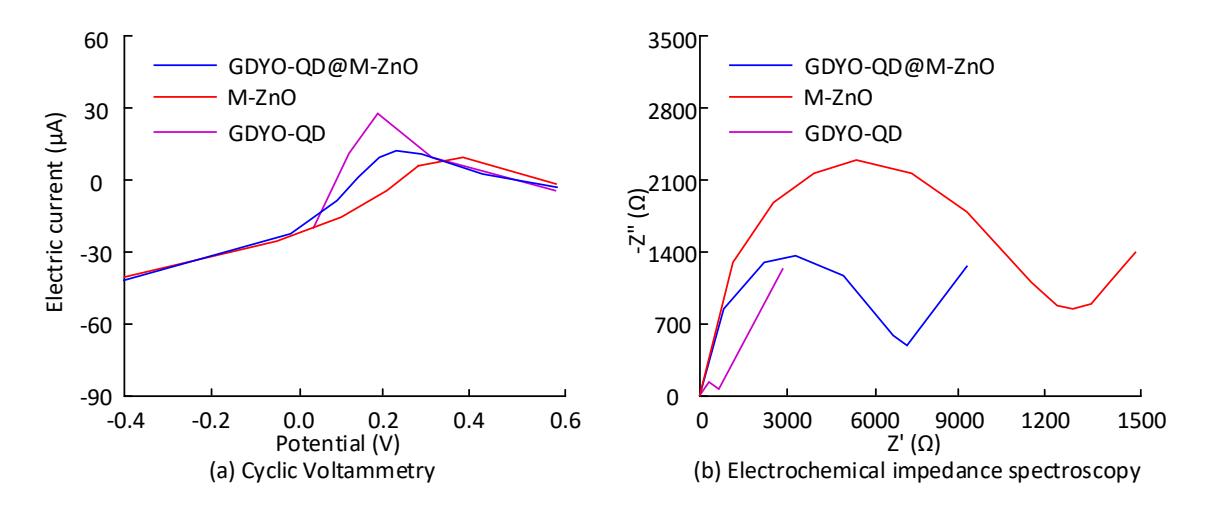
Figure 6 Electrochemical properties of electrochemiluminescence sensors
Free radical detection results of electrochemiluminescence sensor
Figure 7 shows the electrochemiluminescence response of the prepared electrochemiluminescence sensor under two modified electrodes, GDYO-QD and GDYO-QD@M-ZnO, and three solutions of vitamin C, troxerutin, and metformin hydrochloride. All experiments are repeated three times. The data are expressed as mean ± standard deviation. The significance of the difference was tested by one-way analysis of variance (ANOVA), with the significance level set at 0.05. If p<0.05, the difference was statistically significant. Under the GDYO-QD-modified electrode, the electrochemiluminescence response was about 2500±120 a.u. After adding M-ZnO, the electrochemiluminescence response under GDYO-QD@M-ZnO-modified electrode was about 10,000±350 a.u., significantly higher than that before the addition of M-ZnO (p<0.05). In these three solutions, the electrochemiluminescence responses were approximately 3,700 a.u., 3,800 a.u., and 3,900 a.u., respectively, which were all significantly lower than the response of GDYO-QD@M-ZnO in free radical solution (p<0.05). Under the GDYO-QD@M-ZnO-modified electrode, the electrochemiluminescence response was significantly higher than that in these three solutions, which was three times higher than before adding M-ZnO. This proves that the signal of the GDYO-QD@M-ZnO-based electrochemiluminescence sensor is significantly improved. This is because adding M-ZnO as a metal oxide semiconductor has abundant oxygen vacancies and active sites on its surface, which can catalyze free radicals and REDOX reactions in the solution, providing more energy transfer intermediates for the ECL reaction of GDYO-QD and further enhancing the electrochemiluminescence signal. Moreover, GDYO-QD@M-ZnO composite materials significantly improve the interface charge transfer efficiency by forming heterostructures, enabling more efficient separation and transfer of charges between GDYO-QD and M-ZnO, thereby improving the electrochemiluminescence signal.
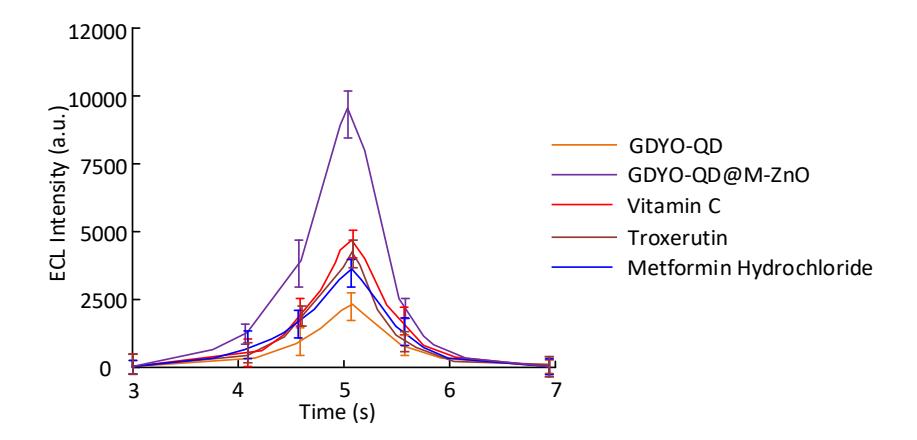
Figure 7 Free radical detection of electrochemiluminescence sensor
Stability of Electrochemiluminescence Sensor
Figure 8 (a) shows the short-term stability of the GDYO-QD@M-ZnO-based electrochemiluminescence sensor, and Figure 8 (b) shows the long-term stability of the GDYO-QD@M-ZnO-based electrochemiluminescence sensor. From Figure 8 (a), the electroluminescence intensity under GDYO-QD-modified electrode varied around 5,500 a.u., under M-ZnO-modified electrode around 5,300 a.u., and under GDYO-QD@M-ZnO-modified electrode around 4,500 a.u. The change is relatively small. The short-term stability of the GDYO-QD@M-ZnO-based electrochemiluminescence sensor is good. From Figure 8 (b), the electrochemiluminescence intensity under these three modified electrodes showed an increasing trend over time, indicating poor long-term stability of the GDYO-QD@M-ZnO-based electrochemiluminescence sensor. This may be due to photochemical degradation or surface oxidation that occurs during long-term exposure to light and electrochemical reactions, leading to a decrease in the active sites on the electrode surface and reducing the stability of the electrochemiluminescence sensor.
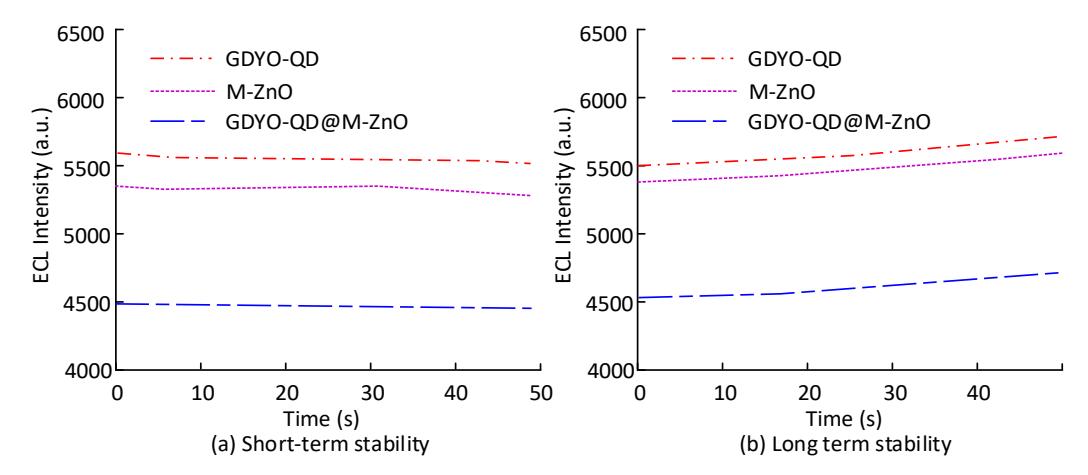
Figure 8 Stability test results of electrochemiluminescence sensor
Reproducibility of electrochemiluminescence sensors
Figure 9 shows the reproducibility experimental results of the GDYO-QD@M-ZnO-based electrochemiluminescence sensor. According to Figure 9, as the number of experiments added, the electroluminescence intensity of the chemiluminescence sensor fluctuated under these three solutions, including vitamin C, troxerutin, and metformin hydrochloride. In vitamin C solution, the electrochemiluminescence intensity of the sensor varied between 5,300 a.u. and 5,410 a.u. The electrochemiluminescence intensity of the sensor under the troxerutin solution was [5,180 a.u., 5,230 a.u.]. Under the metformin hydrochloride solution, the electrochemiluminescence intensity of the sensor varied between 4,500 a.u. and 4,600 a.u. It can be observed that the change in the electrochemiluminescence intensity of the sensors under these three solutions is relatively small, indicating that the GDYO-QD@M-ZnO-based electrochemiluminescence sensor has good reproducibility.

Figure 9 Repeatability test results of electrochemiluminescence sensor.
Interference experiment of electrochemiluminescence sensor
Figure 10 shows the results the interference experiment results of the electrochemiluminescence sensor based on GDYO-QD@M-ZnO. From Figure 10, under 10 excipients including vitamin C, starch, magnesium stearate, dextrin, hydroxypropyl methylcellulose, ethylenediaminetetraacetic acid, silica, talcum powder, glucose, and polysorbate, the electrochemiluminescence intensity of the sensor was approximately 5,900 a.u., 6,900 a.u., 6,800 a.u., 7,200 a.u., 6,700 a.u., 6,800 a.u., 7,000 a.u., 6,600 a.u., 7,000 a.u., and 6,600 a.u., respectively. The electrochemiluminescence intensity of the blank control group was approximately 9,200 a.u. It can be observed that the electroluminescence intensity of the sensors is below that of the blank control group, indicating that these excipients have caused varying degrees of interference to the luminescence signal of the sensor. Among them, starch and dextrin have the most significant interference, but these two excipients can be removed through filtration operation. The reason for this conclusion is that some excipients can undergo quenching reactions with the free radicals generated during the electrochemiluminescence process, consuming the free radicals and reducing the luminescence signal.
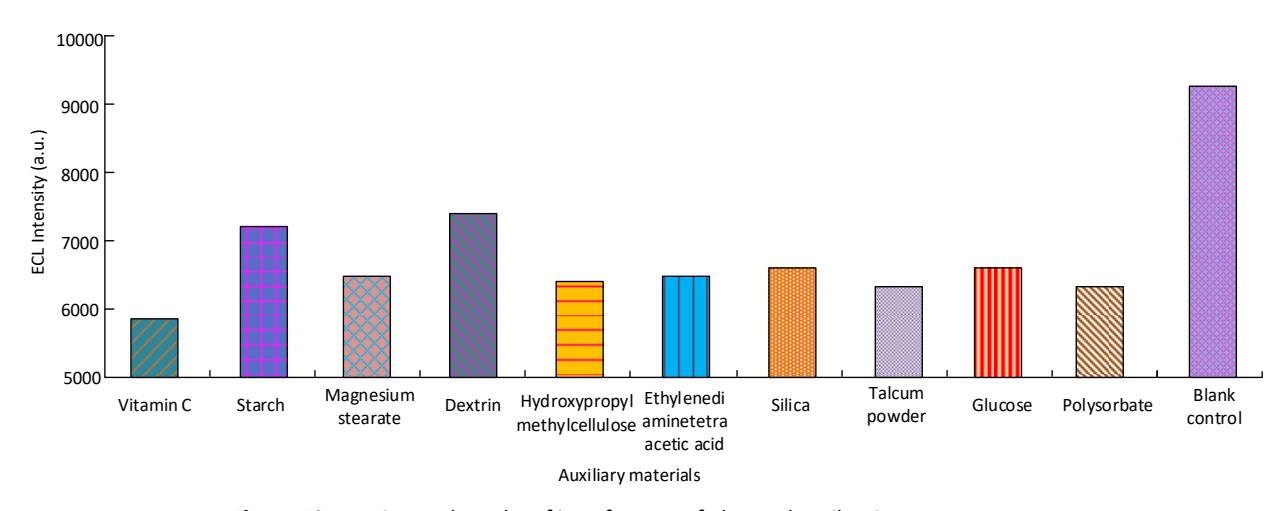
\(\textbf{Figure 10} \ \textbf{Experimental results of interference of electrochemilum in escence sensor.}\)
Test results of photochromic properties
Table 3 shows the GDYO-QD@M-ZnO Photochromic properties of the electrochemiluminescence sensor. From table 11, GDYO-QD was light yellow under natural light, and turned light brown after being irradiated by 365 nm ultraviolet light for 0.5 min. M-zno was white under natural light, and turned light gray after being irradiated by 254 nm ultraviolet light for 2.0 min. GDYO-QD@M-ZnO was light brown under natural light, and turned dark brown after 1.0 min of 365 nm UV irradiation. The color change range was significantly greater than that of the other two groups, indicating that the composite structure enhanced the light induced color response.
| Material | GDYO-QD | M-ZnO | GDYO-QD@M-ZnO |
| Color in natural light | Light yellow | White | Light brown |
| Irradiation wavelength (nm) | 365 | 254 | 365 |
| Irradiation time (min) | 0.5 | 2.0 | 1.0 |
| Color after discoloration | Light brown | Light grey | Dark brown |
| Characteristic peak position (nm) | 450 | 550 | 550 |
| Peak intensity change (%) | +15 | +10 | +30 |
| Recovery time (min) | 30 | 10 | 10 |
| Retention rate of peak intensity (%) | 95 | 97 | 92 |
Table 1 Photochromic properties.
GDYO-QD@M-ZnO performance comparison of ECL sensors
To further highlight the superiority of this study, the proposed GDYO-QD@M-ZnO ECL sensor is compared with other sensors. The results are shown in Table 4. From Table 4, the GDYO-QD@M-ZnO sensor had a detection limit of 0.05 \(\mu\)M for free radicals, a sensitivity of 2.1 \(\mu\)A·\(\mu\)M<sup>-1</sup>·cm<sup>-2</sup>, and a response time of 3s, all of which were superior to other sensors.
This proves that this composite structure ensures trace identification capability while achieving faster electron transport and higher current gain. The comprehensive performance is outstanding.
Sensing material Target object Detection limit (μM) Sensitivity (μA·μM⁻¹·cm⁻²) Response time (s) GDYO-QD@M-ZnO Free radicals 0.05 2.1 3 GDY-QDs/SnO2 Hydroxyl radical 0.12 1.3 5 GDY-NH₂/Cu₂O Ascorbic acid 0.08 1.8 4 Zif-8-derived ZnO/GDY Superoxide anion 0.10 1.5 6
g-C₃N₄/GDY QDs Vitamin C 0.09 1.4 7
Table 2 Performance comparison of GDYO-QD@M-ZnO ECL sensors
Discussion
In this study, an ECL sensor based on GDYO-QD@M-ZnO composite material is constructed and characterized, and its performance is significantly superior to that of the sensor modified with a single component. The combination of GDYO-QD and M-ZnO simultaneously retains the characteristic structure and chemical properties of both, thereby significantly improving the performance of the sensor. The results showed that the band gap of GDYO-QD was 1.35 eV, which was narrower than that of M-ZnO. GDYO-QD has a good absorption capacity for the visible light region, while M-ZnO is conducive to ultraviolet light absorption. Moreover, the flat-band potentials of the two were 0.18 V and 0.24 V, respectively, which promoted the efficient separation and rapid transfer of photogenerated electron-hole pairs at the interface. The GDYO-QD@M-ZnO modified electrode exhibited the highest peak current response at 29.6 μA, significantly superior to the single GDYO-QD or M-ZnO modified electrode, demonstrating that the composite material greatly optimized the electron transport kinetics at the electrode interface. In free radical detection, the ECL signal intensity generated by the GDYO-QD@M-ZnO sensor reached approximately three times that of a single GDYO-QD sensor. It is indicated that when GDYO-QD serves as an excellent ECL luminescent body. M-ZnO is introduced simultaneously. The high specific surface area of M-ZnO provides abundant active sites. The surface oxygen vacancies may effectively catalyze the core co-reactant process involving free radicals, providing more sufficient reactants or energy transfer pathways for the ECL reaction of GDYO-QD. Meanwhile, the heterojunction structure greatly accelerates the interfacial charge transfer efficiency and reduces the non-radiative recombination loss, thereby allowing more energy to be used for excited state generation and ECL emission. In addition, this sensor demonstrates significant competitiveness in terms of detection limit and sensitivity compared to various ECL sensors based on ZnO, graphdiyne or MOF-derived materials reported recently. Its response time is also at a relatively optimal level, verifying the effectiveness of the GDYO-QD and M-ZnO composite strategy in enhancing the comprehensive performance of ECL sensors. In conclusion, the proposed ECL sensor based on GDYO-QD@M-ZnO composite material has significant advantages over similar sensors, laying a foundation for the technological development of related fields. It is expected to promote the practical application of new sensors in environmental monitoring, biomedical, and other scenarios.
Conclusion
Electrochemiluminescence sensor is a new sensor based on quantum dots, which can detect and analyze gases and chemicals in the environment, and has high sensitivity and accuracy. To prepare a highly stable and efficient charge carrier transport electrochemiluminescence sensor, GDYO-QD was prepared by acid oxidation method, and M-ZnO was synthesized by high-temperature calcination method. These two were combined into the GDYO-QD@M-ZnO composite material to prepare an GDYO-QD@M-ZnO-based electrochemiluminescence sensor. The results showed that GDYO-QD had good dispersibility, with M-ZnO diameter of about 50nm, and no significant structural damage occurred after the two were combined. The optical bandgap of GDYO-QD was 1.35 eV, and the optical bandgap of M-ZnO was 3.13 eV. GDYO-QD had strong visible light absorption ability, while M-ZnO had high ultraviolet light absorption efficiency. The peak current of the GDYO-QD@M-ZnO-modified was 29.6 μA, indicating its strong electron transfer ability. Short-term stability tests showed that the electrochemiluminescence intensity of GDYO-QD@M-ZnO in three solutions of vitamin C, troxerutin, and metformin hydrochloride varied within the ranges of 5,300 - 5,410 a.u., 5,180-5,230 a.u., and 4,500- 4,600 a.u., demonstrating that the sensor had good reproducibility. The prepared electrochemiluminescence sensor has good performance. However, the long-term stability is poor, and there is interference from auxiliary materials on the luminescence signal. In future research, surface modification or doping with other elements will be attempted GDYO-QD@M-ZnO to further improve stability and anti-interference ability.
Compliance with ethics guidelines
The authors declare they have no conflict of interest or financial conflicts to disclose.
This article contains no studies with human or animal subjects performed by authors.
Funding
The research is supported by: Postgraduate Education Reform and Quality Improvement Project of Henan Province, An Engineering Practice-Oriented Teaching Case for the Green-Low-Carbon Transition of Core Nylon Chemical Materials under China's Dual-Carbon Goals, (No: YJS2026AL145); 2024 Henan Provincial Higher Education Teaching Reform Research and Practice Project, Innovation and Practice of a Project-Based Learning and Mentorship-Integrated Talent Cultivation Model, (No: 2024SJGLX0492).