
Introduction
Infrastructure development is a critical indicator of a nation's progress and shows consistent annual growth. Beyond its role in driving economic growth and job creation, civil infrastructure development requires efficient planning, innovative engineering solutions, and strategic integration of technology to ensure sustainable and resilient outcomes. However, environmental issues, particularly carbon emissions from the construction sector, are a major concern. Li et al. (2024) demonstrated that the construction industry is a significant source of pollution and a key driver of climate change. It generates a substantial amount of waste, accounting for 50%–70% of emissions in urban areas and 38% of global emissions. In 2020, the sector consumed 127 exajoules of energy, which is approximately 36% of the total energy used globally (Toth et al., 2021). Cement manufacturing contributes approximately 7% of worldwide anthropogenic carbon dioxide emissions (Zhong et al., 2024) and The combination of demographic growth and increasing urbanization has resulted in escalating cement demand through the years. Nevertheless, ordinary Portland cement production generates approximately 900 kg of CO2 per tonne manufactured, making the cement industry responsible for 5–7% of global carbon dioxide output (Feng et al., 2023). Hence, technological developments in construction, including the use of environmentally sustainable materials as a substitute for cement and in environmental protection, require a reduction in negative impacts. Various industrial waste materials are widely employed as partial or complete substitutes for Portland cement to reduce greenhouse gas emissions linked to cement production (Thomas et al., 2022). Geopolymer concrete (GC) is an alternative, sustainable, and composite material with the activation of an alkaline material that helps the construction industry reduce its carbon footprint by providing low-carbon cementitious options. This presents an appropriate solution to issues in the construction sector (Eltantawi et al., 2024; Karthik et al., 2024). Geopolymer concrete (GC) consists mainly of industrial waste materials like fly ash and provides multiple benefits, including reduced carbon footprint, improved longevity, and superior resistance to chemical attack (Rifkah et al., 2025).
Geopolymers are widely studied binders. They require the use of large amounts of solid waste, which has high silica and aluminum contents, such as fly ash, recycled concrete powder, ground granular furnace slag (GGBFS), and glass powder. These materials can produce geopolymers with excellent properties as full/partial precursors. Geopolymers can compact heavy metals, have been proven to bind aggregates better than conventional cement, and have a denser microstructure (Feng et al., 2024). Geopolymers are inorganic polymers, particularly alkali-activated materials (AAMs). They are created by alkali or acid activation to synthesize natural materials or waste products (Marathe et al., 2024). Geopolymers are produced by the polymerization of organic and inorganic materials. This material can be prepared from recycled silica-rich materials. The synthesis process involves a combination of silica and aluminum, resulting in chemical bonds similar to those found in natural stones (Saloma et al., 2017). GC is safe for processing potentially hazardous materials. Compared to the production of PC concrete, GC production can reduce CO2 emissions by approximately 22%–72% at the same cost (Orhan et al., 2023). Aluminosilicate minerals or industrial by-products (e.g., fly ash, slag, silica fume, metakaolin, and coal gangue) produce geopolymers (Zhang, 2024). GC has better properties than conventional concrete, such as a more significant slump, mechanical properties, freshness, and durability (Masoud et al., 2024). Research findings reveal that geopolymer concrete exhibits performance levels comparable to, and in certain aspects exceeding, those of conventional concrete. In particular, its compressive strength has been reported to be nearly the same as that of ordinary concrete (Indriyantho et al., 2025). The use of GC in structural elements still needs to be considered, considering the differences in shear and compression resistances. GC has a lower cracking torque than OPC, with a moderate 1.59%–1.96% total strengthening ratio (Zhou et al., 2024). Geopolymer cement is an alkali-activated binder made from alumina- and silica-rich materials that polymerize when combined with an alkaline activator (Manzoor et al., 2024). Geopolymer concrete not only provides comparable compressive strength to conventional concrete but also enhances durability by reducing chloride ion penetration and improving bond strength with reinforcement, thereby ensuring better long-term structural performance (Purwanto et al., 2023).
A typical approach involves adjusting the solution ratios to enhance the workability of GC. An alkaline activator-tobinder ratio of 0.4 yields the maximum compressive strength (Swathi & Vidjeapriya, 2023). Alkaline activators like sodium silicate (Na₂SiO₃), potassium silicate (K₂SiO₃), sodium hydroxide (NaOH), and potassium hydroxide (KOH) are utilized to activate aluminosilicate materials. Among these, NaOH is particularly effective in releasing aluminate and silicate monomers. GC is produced by mixing a prepared geopolymer paste with fine and coarse aggregates (Danish et al., 2024). Hence, GC holds great promise as an eco-friendly building material with better potential for sustainable development, fire resistance, and relatively high compressive strength (Tayeh et al., 2021). Beyond achieving structural performance equivalent to conventional concrete, geopolymer concrete is also recognized as a more sustainable and environmentally friendly material. It provides a viable alternative for retrofitting and repair works while significantly reducing carbon emissions (Purwanto et al., 2022).
Despite these advantages, the structural application of geopolymer concrete, particularly in deep beam elements, requires careful consideration due to differences in shear and compression behavior. The fundamental mechanisms underlying the behavioral differences between geopolymer concrete and traditional concrete in deep beams remain poorly understood, particularly regarding how their distinct microstructural characteristics Influence shear failure patterns and modes. While geopolymer concrete shows promise as a sustainable alternative to conventional concrete, the theoretical understanding of how its unique microstructure affects shear behavior in deep beams is inadequate, creating a critical knowledge gap. This relationship between microstructural differences and shear failure mechanisms is not well-established. It requires a comprehensive theoretical investigation to bridge this gap and advance the practical application of GC in structural elements. This research addresses this knowledge gap by investigating the shear behavior mechanisms of geopolymer concrete deep beams, providing essential theoretical groundwork for the broader adoption of this sustainable construction material in structural applications.
Research Significance
Studies related to GC, particularly those exploring various material properties, have been conducted and published. However, the potential of GC as a structural material has not yet been thoroughly investigated and requires further research. This study aims to evaluate the performance of a specific type of structural member, deep beams, with different shear reinforcement ratios for resisting shear forces under monotonic loads. The analysis focused on assessing the performance of deep beams through load-deflection curves, ductility ratios, stress contours, energy dissipation, deflection contours, shear resistance, and stiffness.
A deep beam is a structural member that carries loads applied to one surface and is supported on the opposite surface, creating compression struts between the load points and supports (ACI, 2022). A deep beam must have a clear span () equal to or less than four times its height (ℎ) or a concentrated load area. Structural members are primarily made of concrete, which is typically brittle and, therefore, less capable of resisting tensile forces. Deep beams generally have a shorter span than their depth and function as flexural members with an apparent span-to-depth ratio of less than 2 (Hamoda et al., 2024). One side of the deep beam bears the load, whereas the other side provides support, creating a compression zone between them. A narrower deep beam is more prone to shear failure and development of diagonal and bending cracks (Shyamala, 2022).
Shear reinforcement helps prevent cracking of structural members caused by excessive shear forces. There are two main approaches to resisting shear forces. The first involves no shear reinforcement, assuming that all forces, including shear, are resisted by the concrete alone. The second approach uses shear reinforcement in the beams, which transfers a portion of the shear forces to the concrete while the reinforcement resists the remaining shear forces. The dimensions of the deep beam, amount of shear reinforcement, and ratio of the load-support span to the adequate depth of the beam influence the type of failure that may occur, such as shear compression, shear tension, or shear failure after the yielding of the longitudinal reinforcement. Deep beams must be designed considering the nonlinear strain distribution along the beam length within a distance of 2ℎ from the supports (Saloma et al., 2024).
Critical infrastructures, such as high-rise buildings, bridges, and foundations, rely on deep beams for structural support. A significant concern is that these beams fail owing to brittle shear mechanisms rather than a more gradual flexural failure mode. As the depth of the deep beam increases, the effectiveness of the diagonal compression strut mechanism decreases, leading to higher shear forces within the beam. This can cause the shear stresses to surpass the concrete and shear reinforcement capacities, resulting in the formation of diagonal splitting cracks at mid-depths (Hamoda et al., 2024). Deep beams with higher ratios of transverse reinforcement () exhibit a more uniform distribution of cracks than those with lower shear reinforcement ratios. In previous studies, the stirrup (shear reinforcement) ratios were 0.157%, 0.314%, and 0.628% (Jin et al., 2023). This variation in the shear reinforcement ratio was intended to investigate the influence of reinforcement on the shear capacity of the structural element.
The shear contribution of stirrups () is determined and expressed by the quantity of shear reinforcement on an inclined-crack surface. The stirrup ratio can only be adjusted by the stirrup diameter Φ and the stirrup spacing S. The shear reinforcement ratio () is in Eq. (1).
\[\rho_{SV} = \frac{A_{SV}}{bS} = \frac{\pi\phi^2}{4bS} \tag{1}\]
Stress develops in an element as it adjusts to external conditions, including applied loads, leading to equilibrium between the shear and normal stresses at specific angles. Based on ACI code (ACI 2022), the nominal shear strength (Vn) was obtained using Eqs. (2) and (3):
\[V_n = V_c + V_s \tag{2}\]
\[V_n = \left(\frac{1}{6}\sqrt{f_c'}bd\right) + \left(\frac{A_v f_v d}{s}\right) \tag{3}\]
This study addresses a critical knowledge gap in sustainable structural engineering by investigating the shear behavior of geopolymer concrete deep beams through advanced Finite Element Method (FEM) simulation under monotonic loading conditions. While geopolymer concrete presents significant environmental benefits with potential CO2 emission reductions of 22%–72% compared to conventional concrete, its performance in deep beam applications remains largely unexplored experimentally. This research provides essential theoretical groundwork by employing validated FEM approaches adapted from conventional concrete deep beam analysis and incorporating established geopolymer material properties from existing literature to simulate various shear reinforcement ratios (0.157%, 0.314%, and 0.628%). The numerical methodology enables comprehensive parametric analysis and detailed stress distribution visualization that would be challenging to capture experimentally. At the same time, the results establish a fundamental understanding of load-deflection behavior, ductility ratios, energy dissipation, and failure mechanisms in geopolymer concrete deep beams. Although experimental validation on geopolymer deep beams specifically has not been conducted, this study builds upon well-established FEM validation from conventional concrete deep beam research. It integrates documented geopolymer material characteristics, positioning the findings as crucial preliminary data for future experimental investigations. The research significance extends beyond academic contribution by providing structural engineers with sustainable design alternatives for critical infrastructure applications, including high-rise buildings, bridges, and foundations, ultimately supporting the transition toward environmentally responsible construction practices while maintaining structural integrity and safety standards.
Materials and Methods
Materials Properties
Data on the deep beam dimensions, shear ratio, and normal concrete (NC) properties were obtained from previous experimental studies. NC material properties, including compressive strength and splitting tensile strength ( ′ and ) are 43.6 MPa and 2.6 MPa, respectively (Jin et al., 2023). The elastic modulus of NC was 31.034 MPa. This study aims to investigate six deep beam models using NC and GC materials. The deep beam width is specified for beam. The compressive strength of the GC was 68.36 MPa (Saloma et al., 2017), with an elastic modulus of 38.859 MPa. The longitudinal deformed steel bars had diameters of 36 mm and 12 mm, and the shear reinforcement plain steel bar diameter was 10 mm. The yield strength of the longitudinal steel bar was 408 MPa for the 12 mm diameter and 445 MPa for the 36 mm diameter, while the shear steel bar yield strength was 403 MPa. The ultimate strength of the longitudinal steel bar was 584 MPa for the 12 mm diameter and 586 MPa for the 36 mm diameter; the shear steel bar had an ultimate strength of 594 MPa. The monotonic vertical loads applied to the steel at the two points at the top of the deep beams were in accordance with ASTM C78-02., 2016. Figure 1 shows the schematics of the support, loading, and transducer placement. The details of the deep beams, stirrup spaces, and shear reinforcement ratios are listed in Table 1. The NC deep beams used NC material, and the G deep beams used GC material. The dimensions and variations in the spacing of shear reinforcement of the three types of deep beams are shown in Figure 2.
Table 1 Dimensions and properties deep beam material
| Type | Shear reinforcement 𝛒𝐬𝐰 (%) | Space 𝐒 (𝐦𝐦) |
|---|---|---|
| NC1 and G1 | 0.157 | 500 |
| NC2 and G2 | 0.314 | 250 |
| NC3 and G3 | 0.628 | 125 |
Finite Element Analysis
Finite element analysis (FEA) was used to model three types of deep beams: NC-test, NC-model, and GC-model. Each deep beam was divided into multiple elements: concrete, steel bars, and steel plates for the load application, represented by the SOLID65, LINK180, and SOLID45 elements, respectively. The SOLID65 element, with its eight nodes, can simulate the concrete behavior under cracking, strain, displacement, and nonlinear deformation (Manharawy et al., 2022). The LINK180 elements simulate the compressive and tensile forces of the steel bars, whereas the SOLID45 element represents the behavior of the steel plates in terms of strain, stress, deformation, and deflection. The nonlinear equations in the FEA were solved through preprocessing (data input), running, and postprocessing (data output) (Thompson et al., 2017). The beam dimensions (width, height, and thickness) were applied along the x-, y-, and z-axes in the finite element model. Restraints were placed at the bottom of the beams in the x-, y-, and z-directions to represent joints and rollers at the ends, preventing movement owing to the monotonic loads applied to the two points on top of the deep beams until they failed. The input parameters used in the analysis are GC material properties, Elastic modulus (E) 38.859 MPa, Poisson's ratio 0.3, Concrete Density 2400 kg/mm3 , GC Strain-stress, and Steel material properties, like steel modulus elastic (Es) 210000 MPa, steel Strain-stress. The boundary condition, fixed at bottom and load at top (two point load).
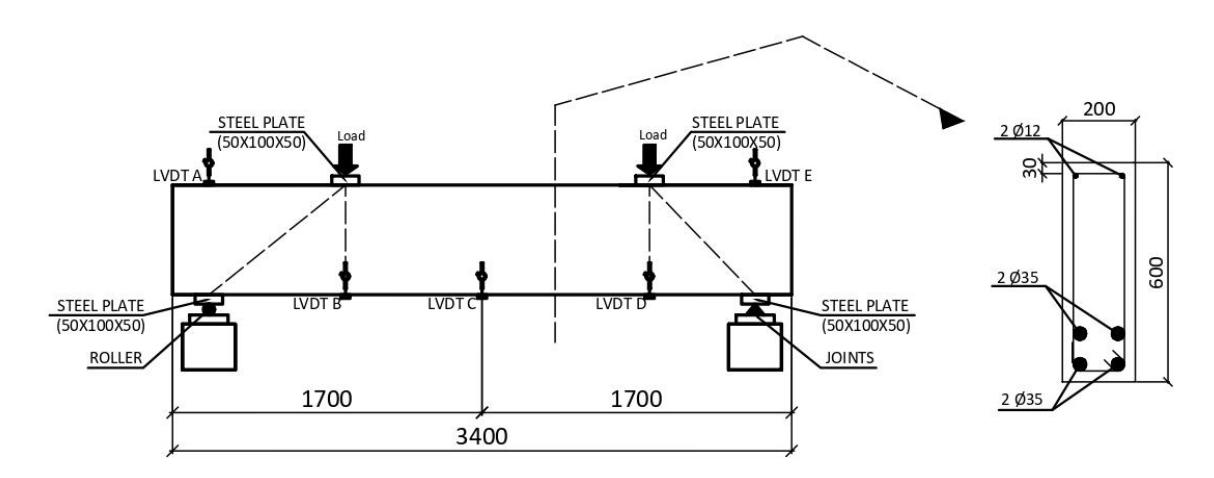
Support, load and transducer positions (redrawn).
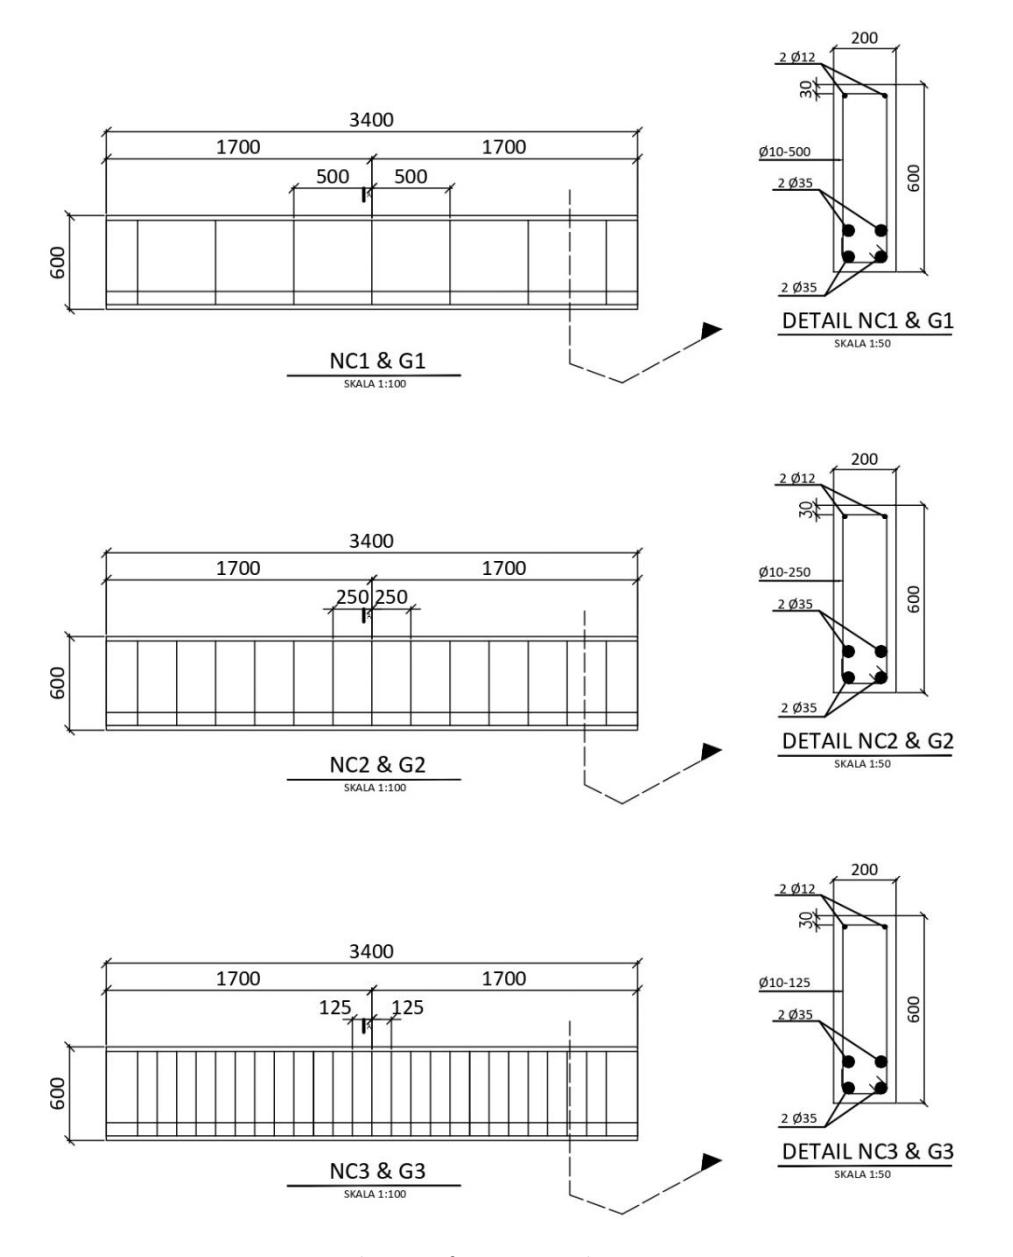
Shear reinforcement with variation space.
Results
Load and Deflection Correlation of NC Deep Beams
The deflection at the mid-span from the modeling output was verified against the test results measured by LVDT C, illustrated in Figure 1. Figures 3, 4, and 5 compare the experimental and modeling load-deflection curves for NC1, NC2, and NC3 deep beams, respectively. The maximum loads and deflections of the deep beam models and specimens are listed in Table 2, with maximum loads of 500 kN, 630 kN, and 742 kN. The deflections of the deep beam models and specimens differed by 0.35%, 0.10%, and 0.66% for NC1, NC2, and NC3. The load–load-displacement response obtained from the numerical simulation demonstrated a bi-linear behavior. The first linear segment corresponds to the elastic region, where deformation increases proportionally with load. The second segment, characterized by a reduced slope, indicates the onset of microcracking and progressive damage until ultimate failure. This bilinear pattern is consistent with the experimental observations, confirming the validity of the adopted material model. To further substantiate this agreement, Table 3 reports the displacement differences between the numerical deep beam models and the corresponding test specimens at a constant load of 500 kN, demonstrating a high level of consistency between both datasets.
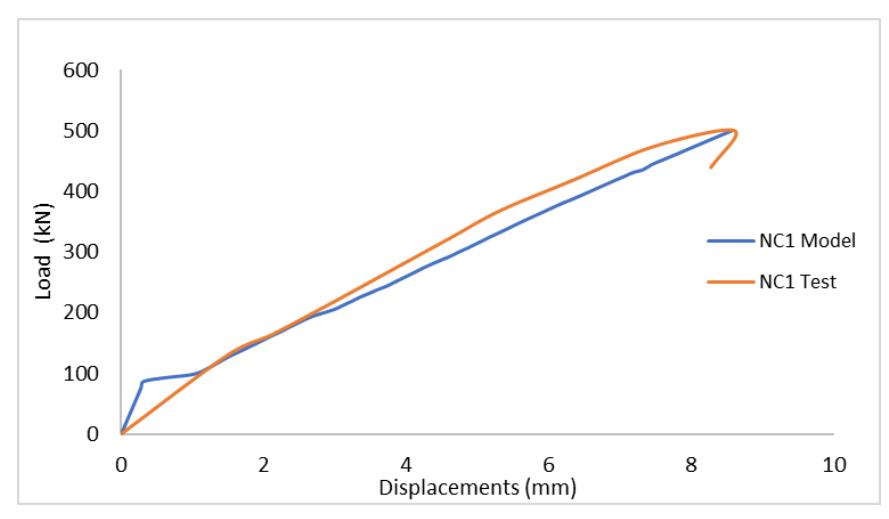
Load-displacement curve of NC1 deep beams.
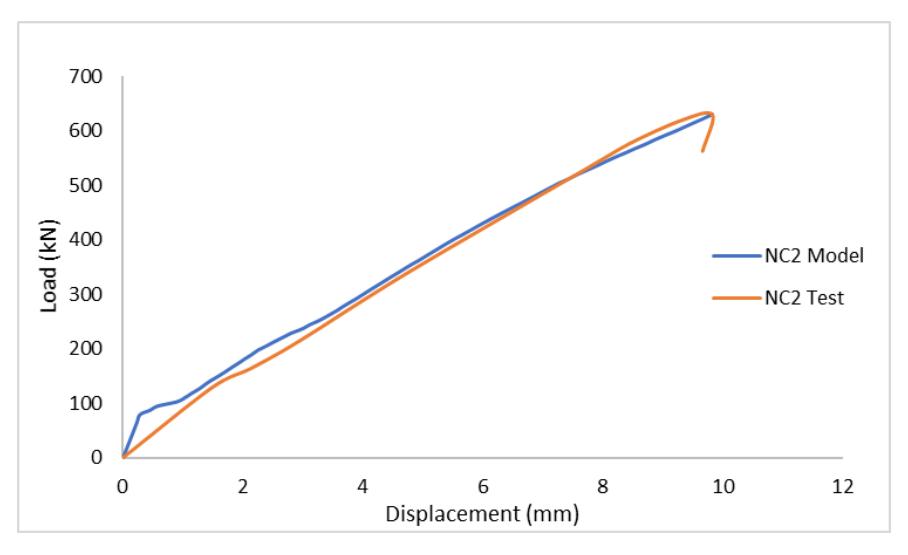
Load-displacement curve of NC2 deep beams.
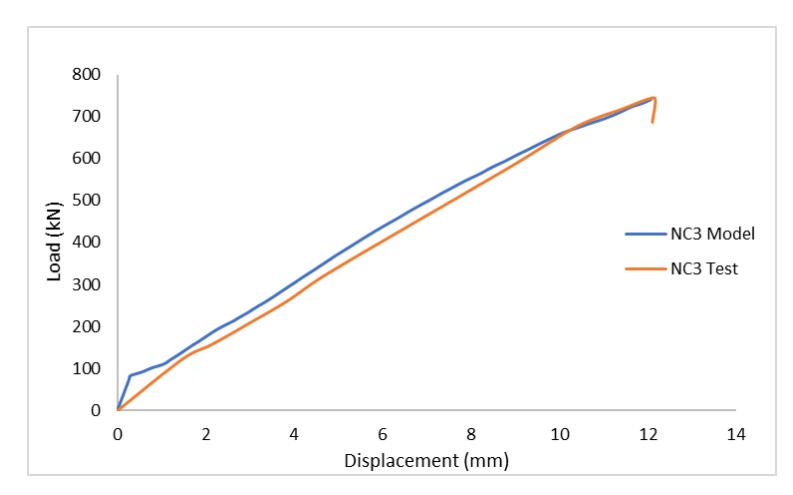
Load-displacement curve of NC3 deep beams.
Table 2 Deep beam models and test specimen difference in displacement under maximum loads.
| Test-specimens | Model | ||||
|---|---|---|---|---|---|
| Type | Max. load | Displ. | Max. load | Displ. | Different of displ. |
| NC1 | 500 | 8.60 | 500 | 8.57 | 0.35% |
| NC2 | 630 | 9.81 | 630 | 9.82 | 0.10% |
| NC3 | 742 | 12.16 | 742 | 12.08 | 0.66% |
Table 3 Deep beam models and test specimen different displacement values at a load of 500 kN.
| Test-specimens | Model | ||||
|---|---|---|---|---|---|
| Type | Max. load | Displ. | Max. load | Displ. | Different of displ. |
| NC1 | 500 | 8.60 | 500 | 8.57 | 0.35% |
| NC2 | 500 | 7.23 | 500 | 7.30 | 0.96% |
| NC3 | 500 | 7.00 | 500 | 6.90 | 1.45% |
Load and Deflection Correlation of GC Deep Beams
The maximum loads and displacements of the GC deep-beam models are listed in Table 4. The performance was shown by the G1, G2, and G3 deep beam models with shear reinforcement ratios of 0.157%, 0.314%, and 0.628%, which reached maximum loads of 700 kN, 882 kN, and 1038 kN, along with displacements of 11.57 mm, 13.15 mm, and 16.21 mm, respectively. Geopolymer concrete exhibits a stress–strain response similar to that of conventional concrete, with a nearly identical ascending branch and slightly more brittle post-peak behavior (Purwanto et al., 2022). Figure 6 shows the load-displacement curve of GC deep beams with a variation of shear reinforcement ratios
Table 4 GC deep beam models maximum load and displacement under maximum loads
| Models | ||||
|---|---|---|---|---|
| Type | Maximum load (kN) | Displacements (mm) | ||
| G1 | 700 | 11.57 | ||
| G2 | 882 | 13.15 | ||
| G3 | 1038 | 16.21 | ||
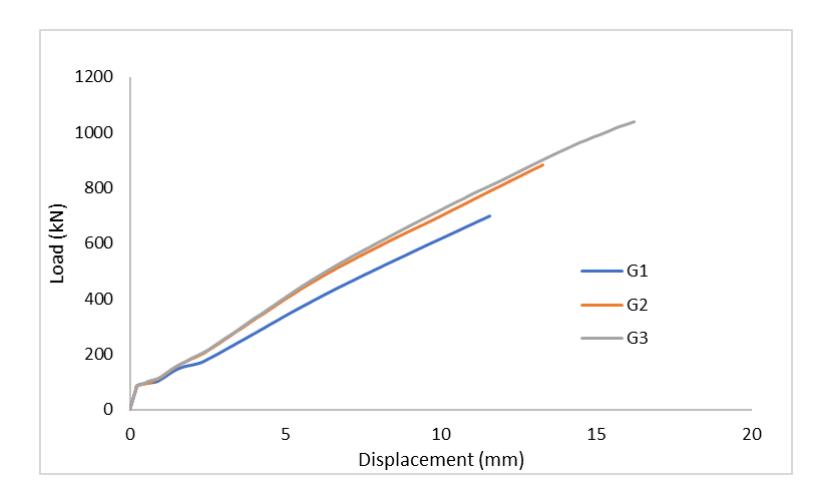
Load-displacement curve of GC deep beams with a variation of shear reinforcement ratios.
Ductility Rations of NC-Test Deep Beams
As shown in Table 5 and illustrated in Figure 7, the maximum displacements of the NC test deep beams ranged from 8.6 to 12.16 mm, with deep beams NC1, NC2, and NC3 achieving ductility ratios of 3.0, 4.37, and 4.65, respectively.
| Type | Max. load 𝐟𝐮 (kN) | Max. displ. 𝒅𝒖 (mm) | Yield load 𝐟𝐲 (kN) | Yield displ. 𝒅𝒚 (mm) | Different of displ. |
|---|---|---|---|---|---|
| (1) | (2) | (3) | (4) | (5)=(2)/(4) | |
| NC1 | 500 | 8.60 | 246 | 2.80 | 3.07 |
| NC2 | 630 | 9.81 | 200 | 2.24 | 4.37 |
| NC3 | 742 | 12.10 | 231 | 2.60 | 4.65 |
Table 5 Ductility ratio of NC-test deep beams
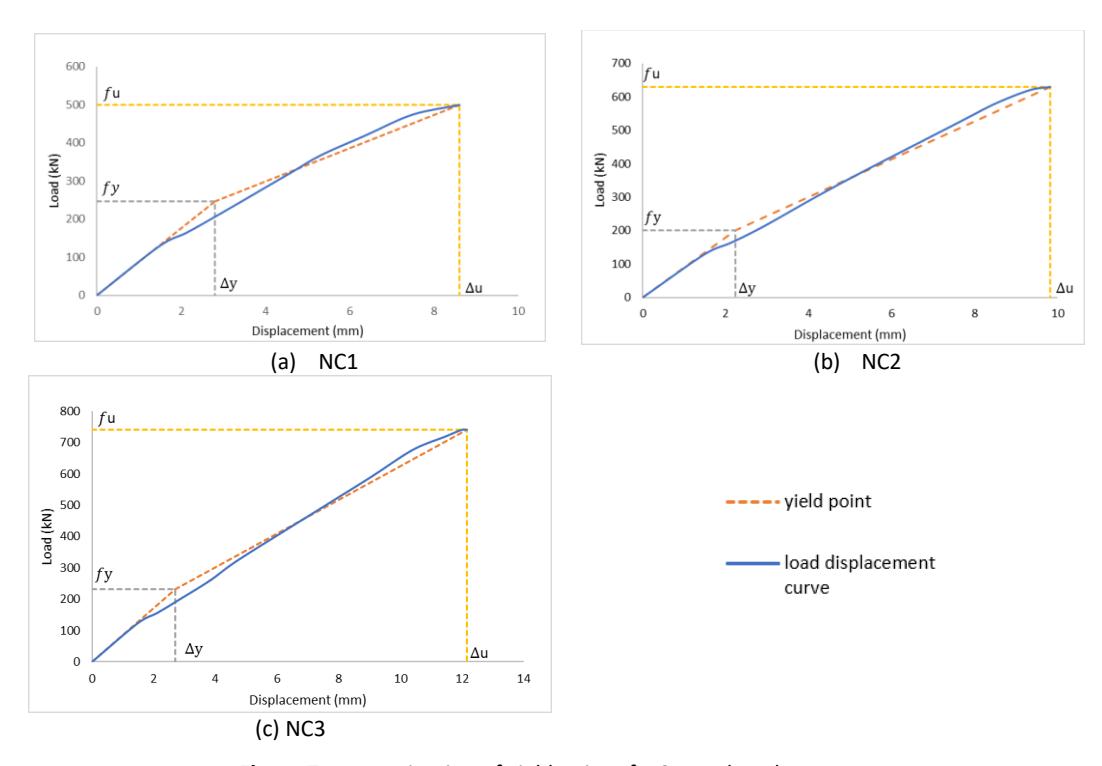
Determination of yield point of NC-test deep beam.
Ductility Rations of NC-Model Deep Beams
As shown in Table 6 and illustrated in Figure 7, the maximum displacements of the NC test deep beams ranged from 8.6 to 12.16 mm, with deep beams NC1, NC2, and NC3 achieving ductility ratios of 3.0, 4.37, and 4.65, respectively.
| Max. load | Max. displ. | Yield load | Yield displ. | Different of displ. | |
|---|---|---|---|---|---|
| Type | 𝐟𝐮 (kN) | 𝒅𝒖 (mm) | 𝐟𝐲 (kN) | 𝒅𝒚 (mm) | |
| (1) | (2) | (3) | (4) | (5)=(2)/(4) | |
| NC1 | 500 | 8.57 | 356 | 5.20 | 1.64 |
| NC2 | 630 | 9.81 | 457 | 5.66 | 1.73 |
| NC3 | 742 | 12.10 | 550 | 6.8 | 1.77 |
Table 6 Ductility ratio of NC-test deep beams
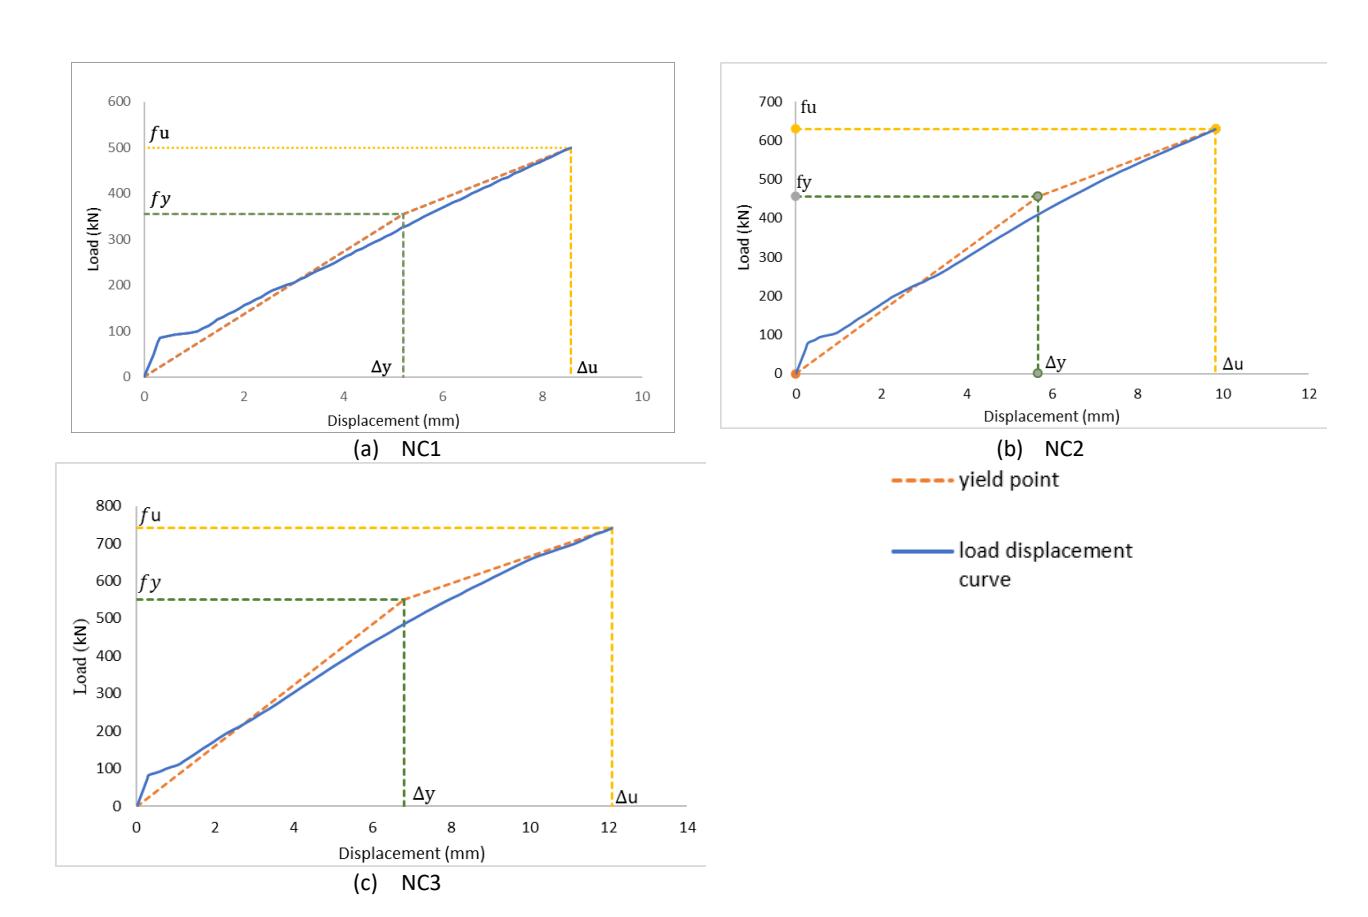
Determination of yield point of NC-model deep beam.
Ductility Rations of GC-Model Deep Beams
Table 7 and Figure 9 present the maximum (ultimate) and yield displacements of the GC deep beams G1, G2, and G3, which produced ductility ratios of 1.62, 1.70, and 2.10, respectively.
| Type | Max. load 𝐟𝐮 (kN) | Max. displ. 𝒅𝒖 (mm) | Yield load 𝐟𝐲 (kN) | Yield displ. 𝒅𝒚 (mm) | Different of displ. |
|---|---|---|---|---|---|
| (1) | (2) | (3) | (4) | (5)=(2)/(4) | |
| G1 | 700 | 11.57 | 510 | 7.10 | 1.62 |
| G2 | 882 | 13.29 | 620 | 7.80 | 1.70 |
| G3 | 1038 | 16.21 | 640 | 7.70 | 2.10 |
Table 7 Ductility ratio of GC-test deep beams
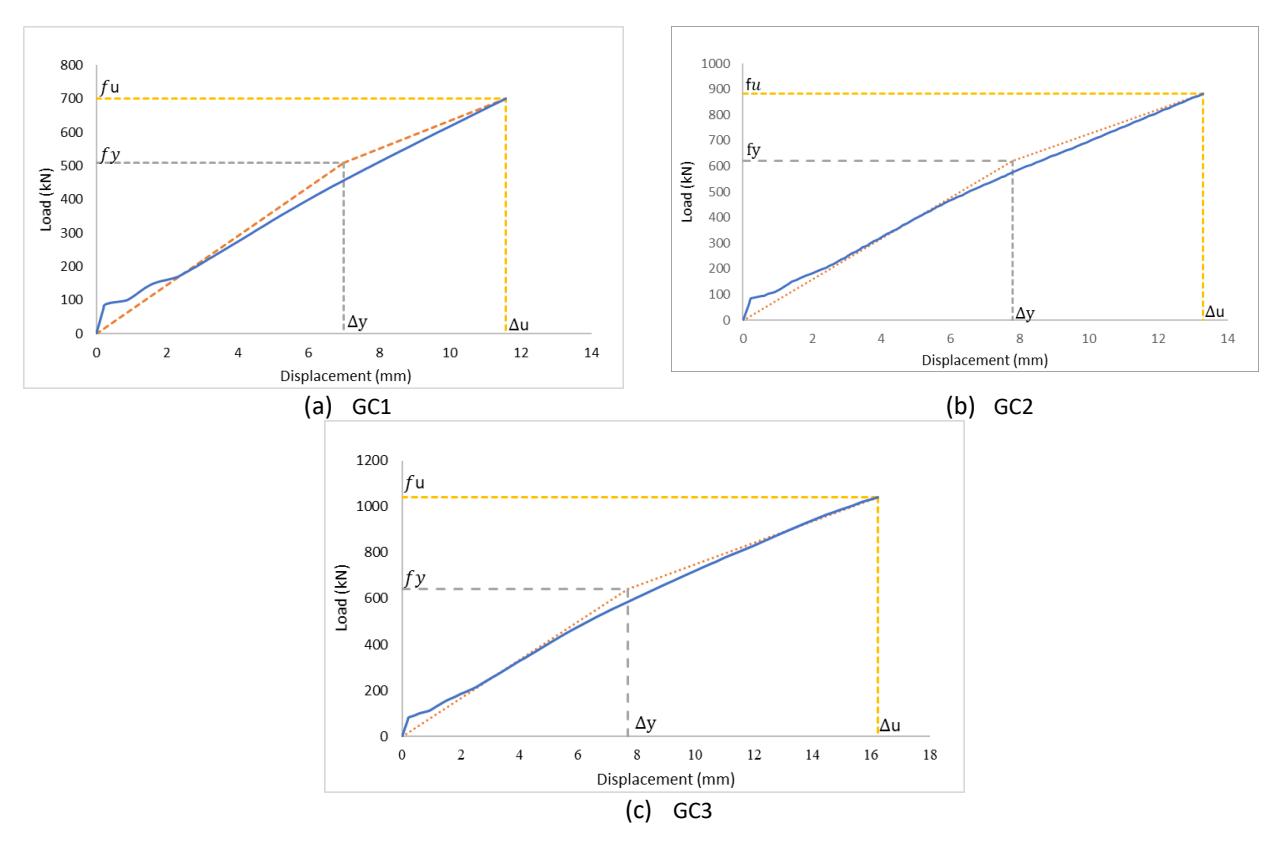
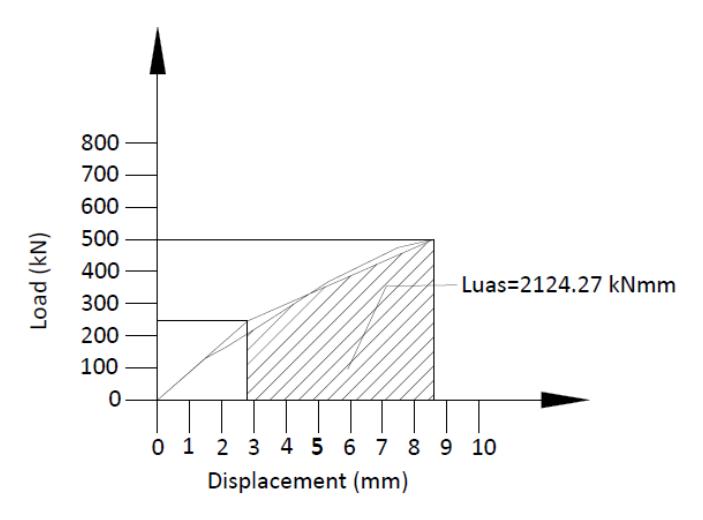
Determination of yield point of GC-model deep beam
Stress Contours of NC-Model Deep Beams
The stress contours of deep beams NC1, NC2, and NC3 are shown in Figure 10. NC had a compressive strength of 43.6 MPa. The dominant stresses, shown in red (-9.60 to +8.62), were observed throughout the deep beam regions. The compressive stresses, shown in orange (-27.82 to -9.60), are primarily found in the upper region of the deep beam near the loading area. The highest compressive stresses, shown in yellow (-46.05 to -27.82), are located around the monotonic loading steel plate.
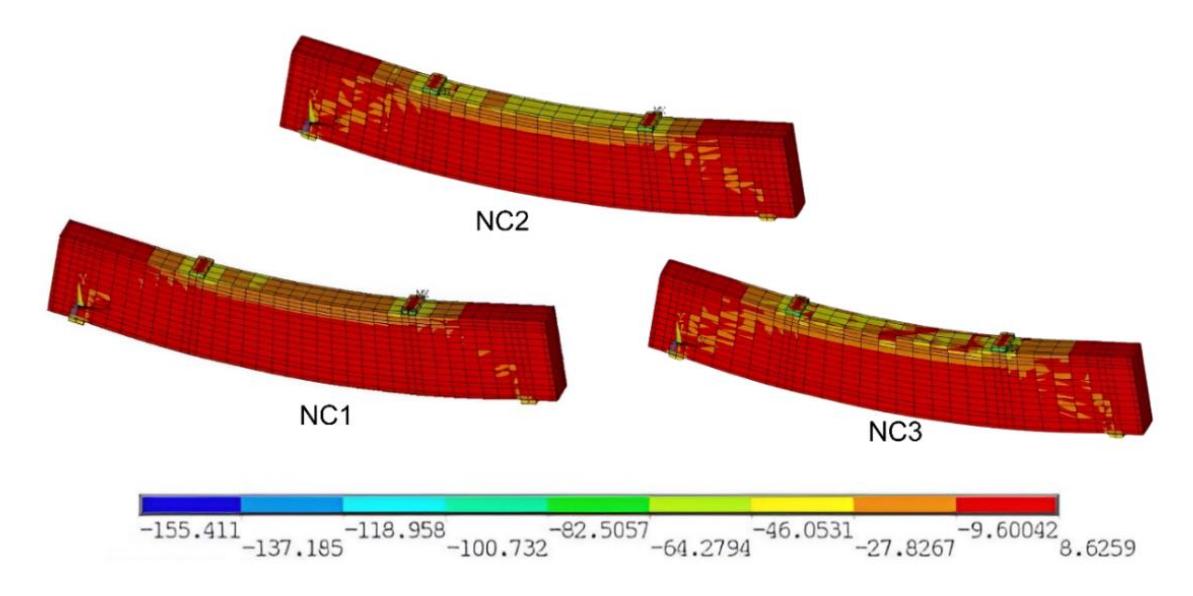
Stress contour of deep beams under maximum load of 500 kN for NC1, 630 kN for NC2, and 724 kN for NC3, respectively.
Stress Contours of GC-Model Deep Beams
The compressive strengths of the deep beams were 68.36 MPa. In deep beam G1, the dominant stresses are represented in red (-9.60 to 8.62). The stresses shown in orange (-27.82 to -9.60) are found in the strut-and-tie distribution area. The stresses depicted in yellow (-46.05 to -27.82) are primarily located on the upper part of the beam. The stress values represented in green (-82.50 to -64.27) indicate that the stress has exceeded the compressive strength in the area adjacent to the loading point.
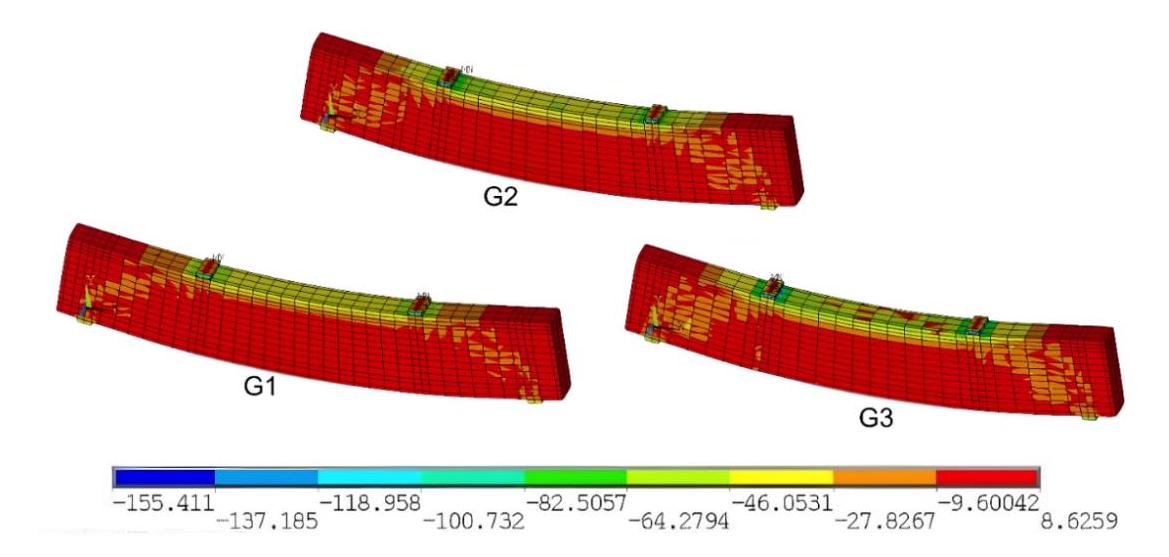
Stress contour of deep beams under maximum load of 700 kN for G1, 882 kN for NC2, and 1038 kN for NC3, respectively.
Displacement Contours of NC Deep Beams
The displacement contours of deep beams NC1, NC2, and NC3 are shown in Figure 12. The largest displacement was observed in beam NC3, followed by smaller displacements in beams NC1 and NC2. The dark blue indicates the range of the greatest displacement, from -12.0954 mm to -10.504 mm, in beam NC3 due to the maximum load of 742 kN.
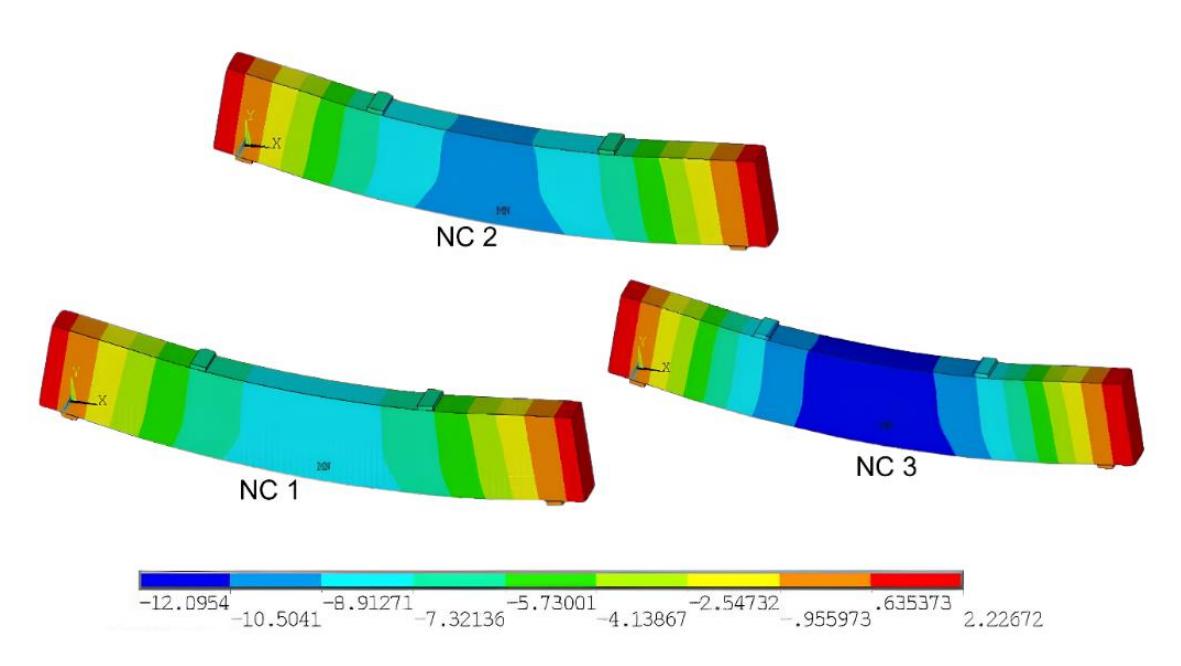
Displacement contour of deep beams under a maximum load of 700 kN for G1, 630 kN for NC2, and 724 kN for NC3, respectively.
Displacement Contours of GC Deep Beams
The displacement contours of deep beams G1, G2, and G3 are shown in Figure 13. The largest displacement in beam G3 ranges from -17 mm to -14.77 mm, represented by a dark blue color in the mid-span. Beam G1 does not show a dark blue compressive stress area and only experiences a displacement of -12.55 mm to -10.33 mm in the mid-span, with a maximum load of 700 kN.
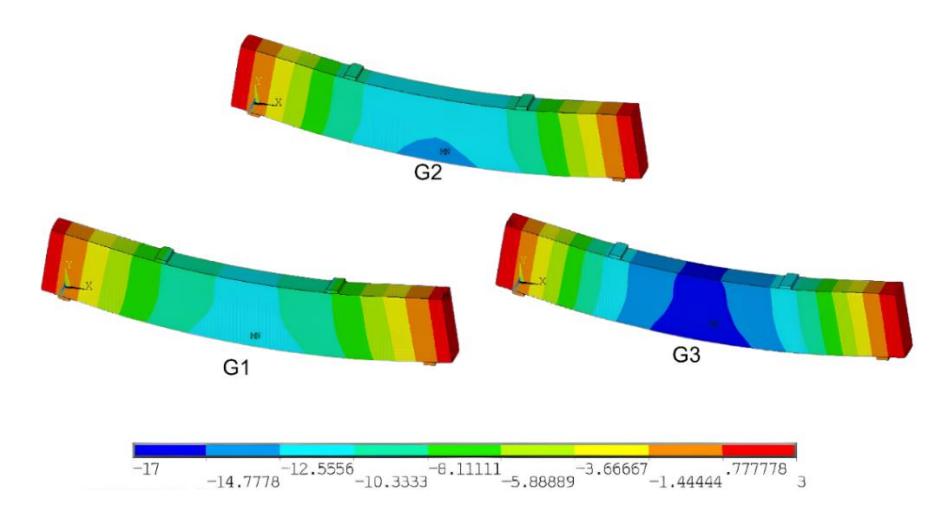
Displacement contour of deep beams under maximum loads of 700 kN for G1, 882 kN for NC2, and 1038 kN for NC3, respectively.
Energy Dissipation of NC-Test, NC-Model, and GC-Model Deep Beams
The energy dissipation for each of the tested and modelled NC deep beams NC1, NC2, and NC3 are listed in Table 8, while the energy dissipation of the GC deep beam models is presented in Table 9.
Displacement contour energy dissipation of NC1-test deep beam.
Table 8 Energy dissipation of the NC-deep beams
| Type | Energy Dissipation Nc test deep beams | Energy Dissipation Nc model deep beams | Δ Energy dissipation of testing and modeling | Δ Energy dissipation testing and modeling |
|---|---|---|---|---|
| (kN.mm) | (kN.mm) | (kN.mm) | (%) | |
| NC1 | 1340.96 | 2124.27 | 783.31 | 58.41 |
| NC2 | 1973.84 | 3104.67 | 1130.83 | 57.29 |
| NC3 | 2513.86 | 4505.65 | 1991.79 | 79.23 |
| Type | Energy Dissipation | Δ Energy dissipation of testing and modeling | Δ Energy dissipation testing and modeling | |
|---|---|---|---|---|
| (kN.mm) | (kN.mm) | (%) | ||
| G1 | 2897.54 | 1340.96 | 53.72 | |
| G2 | 3838.16 | 1973.84 | 48.57 | |
| G3 | 7212.62 | 2513.86 | 65.15 | |
Table 9 Energy dissipation of the GC-model deep beams.
Stiffness Degradation
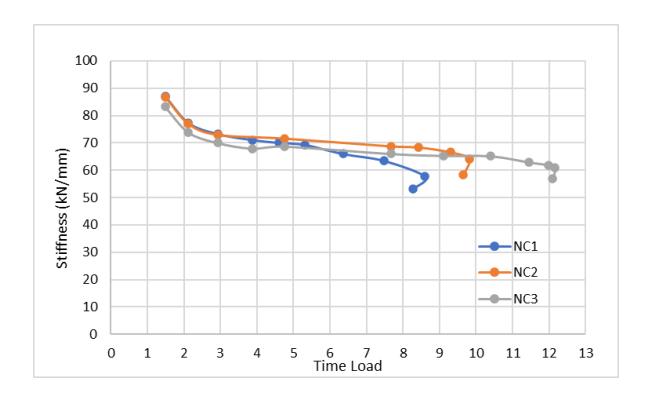
The curves illustrating the stiffness of the deep beams in tests N1, N2, and N3 are shown in Figure 15. During the initial loading phase, NC3 exhibited the highest stiffness, followed by NC1 and NC2. The stiffness values of deep beams NC1, NC2, and NC3 were nearly the same at loading times 1 and 2 for the model beams.
The stiffnesses-time loads correlation of the NC-test deep beams.
The stiffnesses-time loads correlation of the NC-model deep beams.
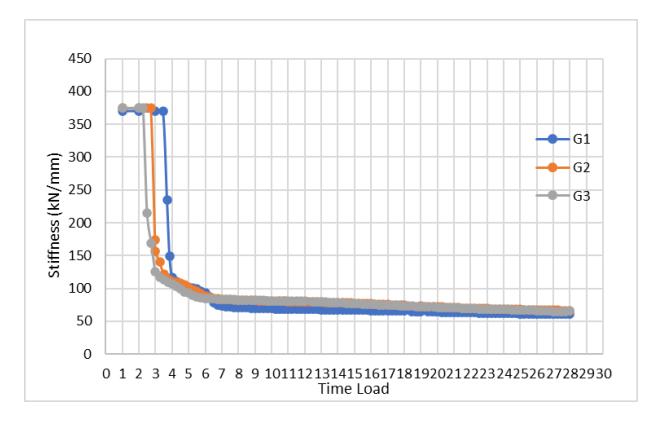
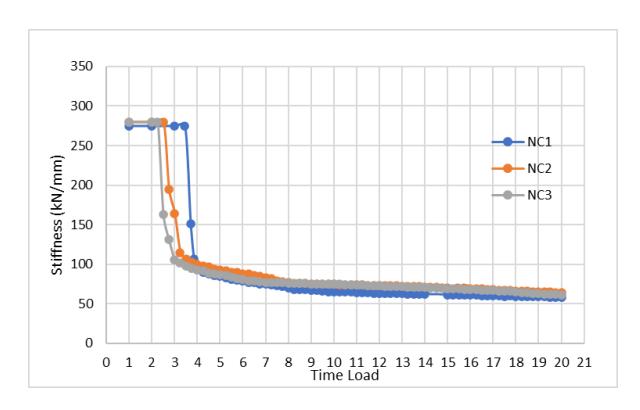
The stiffnesses-time loads correlation of the GC-model deep beams.
Effect of Shear Reinforcement Ratio Variation on Shear Capacity
Figure 18 shows the correlation between reinforcement ratio and shear strength in NC and GC deep beams. The graph shows an increasing trend of Vu/ΦVn values as the transverse reinforcement percentage increases from 0.157% to 0.628%. The GC model consistently performs better, with higher Vu /ϕV values at each level of shear reinforcement. The performance difference between NC and GC becomes more pronounced at higher transverse reinforcement percentages. At the 0.628% reinforcement point, the GC model achieves Vu /ϕV value of around 0.74, while the NC model and test only achieve 0.66. These findings are also supported by the quantitative summary presented in Table 10, which highlights the effect of varying shear reinforcement ratios on the resulting shear capacity.
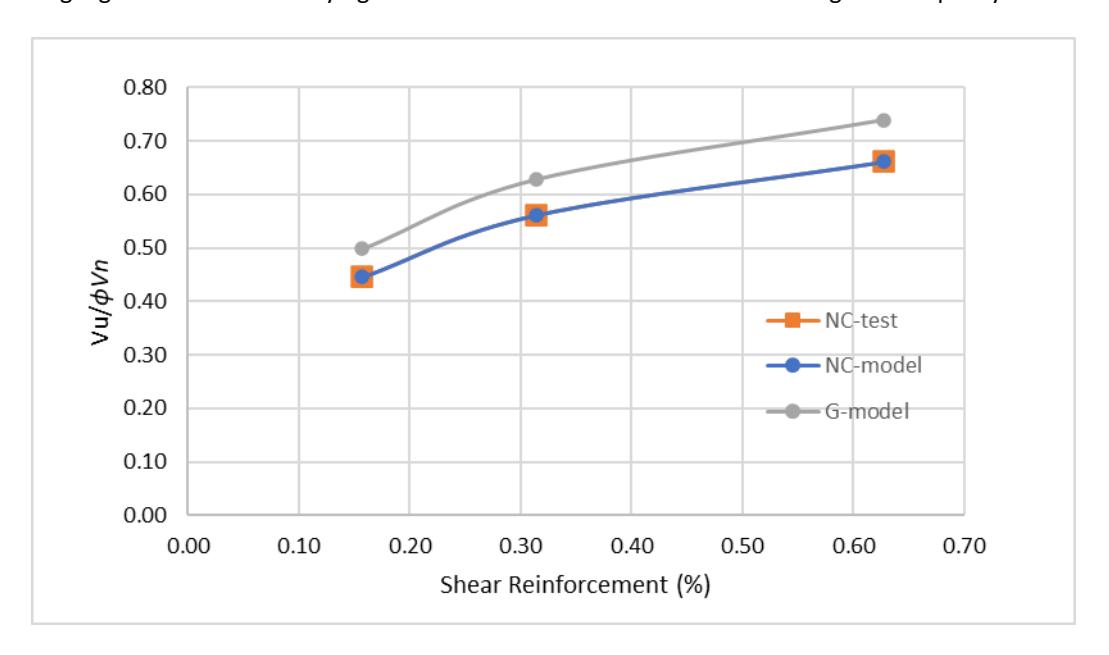
Shear capacity of NC and GC deep beams.
Table 10 Effect of shear reinforcement ratio variation on shear capacity
| Type | 𝛒𝐰𝐬 | 𝐕𝐮 = 𝛟𝐕𝐧 | 𝐕𝐧 [Eq. (10)] | Max. load | 𝐕𝐮/𝛟𝐕𝐧 |
|---|---|---|---|---|---|
| (1) | (2) | (3) | (4) | (6) = (5) /(2) | |
| (%) | (kN) | (kN) | (kN) | ||
| Test | |||||
| NC1 | 0.157 | 250 | 748.34 | 500 | 0.45 |
| NC2 | 0.314 | 315 | 748.34 | 630 | 0.56 |
| NC3 | 0.628 | 371 | 748.34 | 742 | 0.66 |
| Model | |||||
| NC1 | 0.157 | 250 | 748.34 | 500 | 0.45 |
| NC2 | 0.314 | 315 | 748.34 | 630 | 0.56 |
| NC3 | 0.628 | 371 | 748.34 | 742 | 0.66 |
| Model | |||||
| G1 | 0.157 | 350 | 937.04 | 700 | 0.50 |
| G2 | 0.314 | 441 | 937.04 | 882 | 0.63 |
| G3 | 0.628 | 519 | 937.04 | 1038 | 0.74 |
Discussion
The shear reinforcement deep beam model and specimen ratio decreased, thereby decreasing the maximum load. Higher maximum loads caused considerable deflections. The deflections of the deep beam models and specimens differed by 0.35%, 0.10%, and 0.66% for NC1, NC2, and NC3. The difference in displacement was categorized as a fulfilled accuracy of less than 10% (Badshah et al., 2020). Table 3 presents the different displacements of the six NC beams at the lowest load of 500 kN. The table indicates that the highest shear reinforcement ratio on the NC3 deep beam causes the highest shear strength, resulting in the lowest displacement. NC3, which exhibited the highest shear reinforcement ratio, demonstrated the highest shear strength, resulting in the lowest displacement under the given load. This indicates that increased shear reinforcement enhances the ability of the beam to resist deformation (Jin et al., 2023).
Variations in the shear reinforcement cause variations in the displacement. The GC deep beams had a higher maximum load than the NC deep beam model and test specimen. This was because the compressive strength of the GC material was higher. This aligns with the finding that GC has good potential, excellent properties, and increased environmental sustainability (Wu et al., 2022). GC is a promising material that can be improved under various conditions (Kisore, 2023). The largest displacement among the GC deep beams was observed for GC3, as shown in Figure 6. The higher the shear reinforcement ratio, the greater the maximum load that the deep beam can withstand owing to shear reinforcement, ensuring the effective height of the concrete shear zone (Harsha et al., 2021). Geopolymers are widely researched binders owing to their potential as sustainable alternatives to conventional Portland cement. The use of geopolymers encourages the utilization of large amounts of industrial solid waste, particularly fly ash and blast furnace slag, while offering superior structural performance compared to NC. This is evidenced by their ability to withstand higher loads with smaller displacements, which makes them an excellent choice for construction applications requiring high strength and minimal deformation.
The ductility ratios were classified as low (less than two), medium (two–four) and high (more than four). The performance points were determined using the equal-area method applied to the upper and lower portions of the loaddeflection curve (FEMA, 2000). NC3 had the highest ductility ratio and was categorized as high, followed by NC2. The NC1 ductility ratio is categorized as medium ductility. A higher ratio indicates excellent ductility, which suggests that a member can undergo more deformation before failure. Ductility plays a crucial role in ensuring the safety of a structure because its inadequacy can lead to sudden and brittle failure (Ling et al., 2023). The ductility ratios of NC1, NC2, and NC3 model beams are categorized as low (Arlan et al., 2024). The lowest shear reinforcement with the NC1 deep beam model exhibited the lowest ductility. NC3 had the highest ductility with the highest transverse shear ratio, resulting in a more significant maximum displacement and greater ductility than the other two models. This indicated that increasing the shear reinforcement ratio enhanced the ductility of the deep beam. The combined vertical and horizontal reinforcement contributes more significantly to the ultimate shear capacity, in addition to favoring ductility in deep beams (Fayyad et al., 2017). The ductility ratios of the GC beams fall into the low category for G1 and G2, and the high category for G3 (FEMA, 2000). The G3 beam exhibited the highest ductility ratio, followed by G2 and G1. The higher shear reinforcement ratio in G3 enhanced its ability to resist greater ultimate shear loads before failure compared to the G1 and G2 beams. This reinforcement improves the ductility of the deep beam member and increases the concrete compression bar's effective cross-sectional area and strength (Li et al., 2021).
Similar stress behavior was observed in deep beam NC2. The maximum compressive stress affects the area around the monotonic loading steel plate and causes the deep beam to fail. The stress distribution in deep beam NC2 was more complex because of the higher maximum load achieved than that in deep beam NC1. The ultimate load on deep beam NC3 was greater than that on the other beams. The area of crushed concrete is more significant and widespread compared to deep beams NC1 and NC2. The deep beam failed because of compression at its top surface. This failure initiated the development of diagonal compression struts, which extended downward from the top of the beam (under the steel plates) towards both the left and right supports, effectively creating a truss-like load-transfer system (Nurjannah et al., 2024). Deep beam G2 shows similar behavior, but there is a more extensive distribution of green stresses in the upper part of the beam between the loading points, resulting in more extensive damage. Deep beam G3 exhibited a more complex stress pattern because the maximum load capacity of G3 was greater than that of the other deep beams, and the deformation was more significant in G3. Overall, the stress distribution patterns in the GC models closely mirrored those of the NC models and aligned with the expected behavior predicted by the strut-and-tie model (Abbood, 2023).
As the shear reinforcement ratio increased, the maximum downward displacement at mid-span decreased. An increase in the shear reinforcement ratio generally increases the shear capacity of a beam (Zhang et al., 2020). The GC models generally displayed deflection contours, indicating greater and wider deflections throughout the beam compared to their NC counterparts. This behavior resulted from the GC models achieving higher ultimate loads and deflections than their NC counterparts. The area under the load-displacement curve between the yield displacement and the maximum (ultimate) displacement is referred to as the energy dissipation area for the NC1 deep beam owing to monotonic loading (Decanini et al., 2005). The shear reinforcement ratio was correlated with the energy dissipation area. Therefore, the energy dissipation of the NC3 deep beam was higher than those of the other deep beams, followed by those of NC2 and NC1. These energy-dissipation values indicate that the GC beam models had greater energy dissipation than the tested
NC beam models. This potential suggests that the GC material was highly significant and could dissipate energy as a structural material. Higher shear reinforcement allows the beam to withstand greater loads before failure. As indicated in the previous discussions, deep beams with high shear reinforcement ratios reached higher maximum loads. The beam maintains its integrity and dissipates energy through controlled deformation (Zhang et al., 2022).
A key factor in assessing the strength of a model or structure is the degradation in its stiffness (Eric et al., 2024). The ratio of the load to deflection over time represents the stiffness (Nurjannah et al., 2022). With increased load and time, all beams experienced reduced stiffness. The stiffness degradation in the NC1 beam was relatively low owing to its smaller shear reinforcement ratio compared to the other deep beams. These differences in stiffness degradation were due to variations in the shear reinforcement ratio in each deep beam, which affected the ability to resist shear forces. This reduction in stiffness continued until the end of the loading period because stiffness degradation is associated with the yield extension of the stirrups, and the stiffness of the beam is a key factor in calculating the bending moment. Stiffness directly affects how the load is distributed among the supports; a stiffer beam supports a greater proportion of the load (Zheng et al., 2023). Stiffness degradation occurred more slowly in all deep beams than in the NC test and NC model deep beams. Among all the deep beam stiffness results, the performance shows better than that of NC. Previous studies have reported that GC is a potentially suitable material for structural applications (Zhao et al., 2023).
The performance difference between NC and GC becomes more pronounced at higher transverse reinforcement percentages. These results indicate that GC has the potential to have better shear capacity than NC, especially when combined with adequate shear reinforcement. An increase in the shear reinforcement ratio enhanced the shear strength of the beam, although this was accompanied by a reduction in its amplitude. The NC3-test, NC3-model, and G3-model deep beams, with a shear reinforcement ratio of 0.628%, exhibited greater strength than the other deep beams.
The ultimate and nominal shear strengths ( and ) were obtained based on shear capacity analysis, considering the effects of the properties and dimensions of the deep beams. To simplify the analysis of the size effects, the peak load Vu of the RC beams is conventionally determined, as shown in Eqs. (4) and (5).
\[\tau_u = \frac{V_u}{\mathsf{bd}} \tag{4}\]
The nominal shear strength () for each beam in NC and GC is obtained using Eq. (1) with ϕ = 0.75
\[V_n = V_u / \Phi V_u\] (5)
Table 10 lists the variation in shear capacity for each deep beam, indicating the differences in the maximum loads achieved by the NC and GC deep beams. An increase in the shear reinforcement ratio enhanced the shear strength of the beam, although this was accompanied by a reduction in its amplitude. The NC3-test, NC3-model, and G3-model deep beams, with a shear reinforcement ratio of 0.628%, exhibited greater strength than the other deep beams. The nominal shear strength of these beams was higher owing to the increased shear reinforcement ratio, as shown in column (3). Column (5) shows the ultimate shear values under monotonic loading. A comparison of the reduced ultimate strength and nominal shear strength revealed that a value of less than one indicates that the deep beam had adequate and safe shear strength against failure. After multiplying by the reduction factor, the designed shear capacity still indicates that the load on the deep beam is more significant; hence, its value remains less than one. The NC3-test, NCmodel, and G3-model deep beams, with the lowest shear reinforcement ratio of 0.157%, exhibited lower shear strengths than the other deep beams. Deep beams G1, G2, and G3 had higher shear strengths than the NC deep beams, indicating that the GC deep beams performed better overall. Shear reinforcement inhibits the development of inclined cracks, ensuring an effective height of the concrete shear zone and maintaining the aggregate interlock along the inclined plane. This directly intercepts the inclined cracks and resists shear forces. Shear reinforcement also increased the stiffness of the deep beam. This demonstrates that an increase in the stirrup reinforcement ratio and beam height significantly improved the shear strength of deep beams (Jin et al., 2023, Nurjannah et al., 2024).
Problem and Further Research
After research and verification, the NC and GC deep-beam models met the accuracy requirements. The monotonic loads applied in this study were distributed symmetrically over the beams at two points along the span. The GC deep beams exhibited better results than the NC deep beams in terms of strength and resistance to maximum load, achieved displacement, ductility values, stress, energy dissipation, and shear capacity. This study identified the issue of deep beams with the lowest shear reinforcement ratio of 0.157%, which exhibited the lowest ductility values and a smaller
maximum load compared with other deep beams. The high-ductility behavior observed in beams with high reinforcement ratios presents an unresolved issue in this study, as deep beams with higher shear reinforcement ratios exhibit greater stiffness, leading to lower ductility.
This necessitates further research on the interaction between the reinforcement and materials, particularly GC, to understand the differences in behavior and determine the optimal shear reinforcement ratio for deep beams under various loading conditions. Further studies on investigate long-term durability under cyclic loading, different geopolymer mix designs and curing conditions, combined loading scenarios, the composition of GC materials for deep beams are necessary to ensure that they can withstand optimal and repeated loads, undergo deformation, and absorb energy, making them suitable for use in structural elements, and bond behavior optimization between GC and various reinforcement materials.
Conclusion
The research leads to several key conclusions. The finite element verification of both NC and GC deep beams achieved an excellent accuracy of less than 10%, validating the numerical modelling approach and demonstrating the reliability of the computational method for analysing deep beam behaviour under monotonic loading conditions. The NC1, NC2, and NC3 deep beams, as well as the G3 model with the highest reinforcement ratios, reached the highest maximum loads compared to other deep beams with lower shear reinforcement ratios. The shear reinforcement ratio significantly influenced the strength of deep beams in resisting monotonic loads, with superior performance observed in displacement, displacement contours, stress contours, energy dissipation, and stiffness degradation. The deflection differences between deep beam models and specimens were minimal, with variations of 0.35%, 0.10%, and 0.66% for NC1, NC2, and NC3 respectively, and at the standard load of 500 kN, the NC3 deep beam exhibited the lowest displacement, indicating enhanced deformation resistance.
High shear reinforcement ratios enabled deep beams to withstand higher maximum loads due to effective load distribution and prolonged load resistance, with significant plastic deformation before failure. The stress distribution patterns in GC models closely mirrored those of NC models and aligned with strut-and-tie behaviour, with failure mechanisms involving compression at the top surface and diagonal compression struts forming a truss-like load-transfer system. The NC3-test, NC3-model, and G3-model deep beams with a shear reinforcement ratio of 0.628% exhibited superior strengths compared to other specimens, with high nominal shear strengths directly attributed to the reinforcement ratio. All safety factor values were less than unity, indicating adequate and safe shear strength, and GC deep beams demonstrated superior shear resistance compared to NC beams. The load-bearing capacity and ultimate shear strength of GC materials were clearly superior to NC, with GC achieving higher maximum loads due to greater compressive strength and higher shear capacities across G1, G2, and G3. GC deep beams also exhibited higher ductility ratios and significant energy dissipation, with NC3 achieving the highest ductility ratio among NC specimens and G3 achieving the highest among GC beams. Energy dissipation was greater in GC beams than in NC beams, and stiffness degradation occurred more slowly in GC specimens, with their ability to withstand larger maximum loads, smaller displacements, and slower stiffness degradation providing strong evidence supporting the adoption of geopolymer concrete in structural applications requiring enhanced performance characteristics.
Nomenclature
a = Distance from support to the load in horizontal direction (mm)
Av = Shear reinforcement bar area (mm2 )
b = Width of a beam section (mm)
Bl = The width of the loading plate (mm)
B = The width of the supporting plate (mm)
c = The upper horizontal strut height (mm)
d = Effective depth of a beam (mm)
fc ′ = Concrete compressive strength (MPa)
fy = Yield strength of longitudinal reinforcement (MPa)
fv = Yield strength of transverse reinforcement (MPa)
fyw = Yield strength of transverse reinforcement (MPa)
P = Load (kN)
S = Space of transverse bar (mm)
Vc = Concrete shear strength (kN)
Vn = Nominal shear strength (kN)
- Vs = Shear strength provided by shear steel (kN)
- βs = Strut efficiency factor; 0.6 for beams without stirrups and 0.75 for beams with stirrups
- ϕ = Reduction factor for nominal strength
- ∅ = Longitudinal bar diameter (mm)
- ρs = Longitudinal tensile reinforcement ratio
- ρsw = Stirrup ratio
Acknowledgement
The authors acknowledge that all authors support this study are grateful to the financial support of the Ministry of Higher Education, Science, and Technology of the Republic of Indonesia via HIBAH PMDSU 2025 under contract number 109/C3/DT.05.00/PL/2025 and derivative contract number 0046.006/UN9/SB3.LPPM.PT/2025 as an additional output. In addition, all authors express appreciation to Universitas Sriwijaya for supporting this study.
Compliance with ethics guidelines
The authors declare they have no conflict of interest or financial conflicts to disclose.
This article contains no studies with human or animal subjects performed by the authors.