
Introduction
Fluid catalytic cracking (FCC) catalysts are integral to the catalytic cracking process. The growth of the population is leading to a higher demand for fuel, including fossil fuels, which, in turn, is causing an increase in fuel consumption. FCC catalysts are fundamental to secondary processing in the petrochemical industry and play a crucial role in producing diesel and high-octane gasoline (Zhang, Sun, Gao, & Xu, 2015). Typical FCC catalysts comprise a zeolite framework, kaolin, activated alumina, and silica, which are spray-dried into microspheres with a specific size distribution (Mavukwana, Burra, Sempuga, Castaldi, & Gupta, 2024). The widespread utilization of fossil fuels has stimulated the development of viable alternatives to diesel that address sustainability and environmental concerns. For instance, biodiesel functions as a renewable energy resource. Nonetheless, as biodiesel advances swiftly, the increasing generation of glycerol from its manufacturing impacts the economic feasibility of biodiesel within a demanding sector (Wang, Li, Lee, Mat Nanyan, & Tay, 2024). Glycerol is a reusable resource that is among the highest added-value chemicals applied to the production of glycerol monostearate (Gebremariam & Marchetti, 2018).
Glycerol monostearate is synthesized by mixing glycerol with stearic acid, utilizing a catalyst to reduce the activation energy required for the reaction, thereby enhancing the yield of glycerol monostearate. A certain type of catalyst employed in the production of glycerol monostearate is zeolite. The types of zeolites commonly used in FCC include type X, type Y, and ZSM-5. Studies by Doyle, Albayati, Abbas, and Alismaeel (2016) focusing on esterification with zeolite Y demonstrate that a conversion rate of 85% for the esterification process product can be attained. Therefore, the regeneration of the spent FCC catalyst can be implemented in esterification. Acidity catalysts are characterized by their ability to absorb bases. The stronger the adsorption capacity of the catalyst, the higher the acidity of the site, and the
Copyright by authors ©2026 Published by IRCS - ITB J. Eng. Technol. Sci. Vol. 58, No. 2, 2026, 227-242
2Research Center for Chemistry, National Research and Innovation Agency (BRIN), Building 452, K.S.T. BJ. Habibie PUSPIPTEK, Jalan Raya Serpong, South Tangerang 15341, Indonesia,
School of Chemical Engineering, College of Engineering, Universiti Teknologi MARA, Jalan Ilmu 1/1, 40450, Shah Alam, Selangor, Malaysia
better the esterification activity. Sun et al. (2017) reported that high active sites with a hydrophilic surface increase the success of esterification activity.
Thermal combustion in regenerator furnaces effectively removes coke; however, it often leads to phase transformations, pore collapse, and high emissions. High-temperature combustion can convert kaolinite into silicaalumina spinel, resulting in the collapse of small pores and changes in pore size distributions. Conversely, mixed O2/CO2 atmospheres mitigate but do not completely prevent this damage (Sumarno, Dzawilhijjah, Firmansyah, & Trisanti, 2019). Regeneration generates environmentally significant gas streams and exhibits preferential oxidation pathways, wherein coke-C oxidizes before coke-N, complicating the regulation of NOx emissions. Chemical regeneration facilitates the removal of poisons via reactions between the leaching solvent and the utilized catalyst. The two-stage leaching process involving sulfuric acid (Innocenzi, Ferella, de Michelis, & Vegliò, 2015), followed by the combination of two sulfuric acids with citric acid (Istadi et al., 2022), is ineffective in enhancing poison removal and results in significant acid consumption issues. Although conventional wet chemical leaching or extraction can eliminate surface deposits, it is frequently slow, inefficient within microspores, and poses risks of greater framework damage or loss of framework Al if not meticulously controlled. In contrast, chemical regeneration combined with mechanical agitation can significantly decrease processing time and maintain particle integrity (Wang et al., 2021).
For instance, employing ultrasound, the regeneration of the spent FCC catalysts is predominantly conducted through chemical regeneration treatments and magnetic extraction technology. Ultrasound serves as a mechanical waveform that generates physical cavitation and mechanical agitation. Physical cavitation produces transient microbubbles that implode, resulting in localized high temperatures, pressures, and strong microjets that effectively remove surface films and enhance mass transfer (Wang et al., 2019). It possesses attributes of robust penetrating capability, concentrated energy, and environmental safety (Chang et al., 2017). Marafi and Stanislaus's (2011) examination of the regeneration of spent hydrogenation catalysts using ultrasound revealed an increase in leaching rate by 11.1% compared to traditional stirring leaching following ultrasonic leaching for two hours at 60 °C. Moreover, Oza, Shah, and Patel (2011) found that the ultrasonic technique for recovering poisons—notably, nickel from spent catalysts—is far more efficient than the chelation method. Preservation of particles during ultrasonic acid leaching resulted in regenerated particles exhibiting a complete particle structure and an intact zeolite Y framework, in contrast to untreated spent catalysts, where conventional leaching compromised particle integrity. This indicates that ultrasonic processing more effectively preserves macroscopic morphology while facilitating the removal of Fe, V, and Ni, with minimal Al loss (approximately 7.9% reported) in regenerated zeolite Y, suggesting selective metal extraction without significant framework dealumination in the cited protocol (Wang et al., 2021). Jiang, Late, Jeromé, Amaniampong, and Mushrif (2024) examined the efficacy of ultrasound in removing adherent films, dispersed deposits, and surface contaminants, thereby enhancing external surface accessibility. This improvement was evidenced by SEM and XRF analyses of spent Ni/Mo catalysts, which demonstrated significant reductions in S, Fe, and As concentrations following brief ultrasonic treatments. Ultrasound-assisted acid treatments have been shown to enhance crystallinity or recover crystalline signatures in contrast to heavy thermal treatments, which can induce harmful transformations (Gogate, 2020). Moreover, ultrasound serves as one of the enhancement methods that can improve catalytic efficiency. In both homogeneous and heterogeneous systems, ultrasound can enhance the degradation of pollutants. Additionally, it promotes pollutant degradation within bimetallic catalyst systems. Thus, the benefits of ultrasound include being pollution-free, generating no residues, and exhibiting high efficiency. Furthermore, it can be easily integrated with other methods (Wei et al., 2017).
One of the causes of FCC catalyst deactivation is the presence of coke. The most common process for removing coke is thermal treatment or combustion, which is generally carried out with air or oxidative treatment using ozone. Richard, Julcour-Lebigue, and Manero (2017) regenerated the zeolite catalyst using ozone and were able to remove 74.3% of coke from the catalyst after 6.5 hours at a temperature of 150 °C and a flow rate of 9 L/h. The efficiency of ozone is consistently constrained by relatively low mass transfer, which results from limited solubility and equilibrium (Ben Fredj, Novakoski, Tizaoui, & Monser, 2017). Sonolytic chemistry, which generates H2O2 and hydroxyl radicals through the sonolysis of water, can be integrated with oxidants such as persulfate, PMS, H2O2 (Dey & Gogate, 2024), O2 (Zhang, Shen, Gong, & Liu, 2023) to produce •OH and sulfate radicals, which facilitate the oxidation of organic compounds and metal-bound residues. The effect of surface activation under ultrasound enhances particle hydrophilicity and surface energy, thereby improving wetting and facilitating oxidant access. Additionally, ultrasound reduces activation barriers in oxidant-driven leaching (Zhang, Shen, Gong, & Liu, 2023). Integration with classical advanced oxidation processes, such as Fenton/H2O2, produces •OH at moderate temperatures, capable of oxidizing occluded organics within micropores. Under optimized conditions, this process can restore activity and acidity without significant degradation of the framework (Yang et al., 2024). Nonetheless, the use of ultrasound combined with oxidation processes in the regeneration of the spent FCC catalysts is infrequently documented; however, the potential of this approach is noteworthy as it seeks to address the limitations associated with traditional high-temperature and purely chemical regeneration methods.
As previously noted, a prior study synthesized glycerol monostearate from glycerol and stearic acid, utilizing ZSM-5 as a catalyst. The acidity of the catalyst is defined by its capacity to adsorb bases. The optimal conditions with a 7M acid concentration variable, a temperature of 60 °C, and a catalyst dealumination duration of two hours yielded a glycerol monostearate production of 21.07% (Anggoro et al., 2019). The manufacture of glycerol monostearate from glycerol utilizing a dealuminated zeolite Y revealed that the ZSM-5 catalyst possesses a greater acidity value than zeolite Y (Anggoro, Oktavianty, Sasongko, & Buchori, 2020).
This study investigated the impact of acidity during the regeneration of the spent FCC catalysts, utilizing ultrasound and oxidation processes (UAOPs), on the production of glycerol monostearate. It employed three distinct methods: the regeneration of the FCC catalyst using ultrasound, the oxidation process, and the optimal UAOPs. The factors employed in this regeneration of the spent FCC catalysts included temperature, leaching time, and ozone flow rate. This research aimed to determine the optimal operating parameters for the regeneration of UAOPs on a spent FCC catalyst and develop a kinetic model for the reactions involved in glycerol monostearate synthesis.
Methodology
Materials
This study obtained FCC spent catalyst from Pertamina Refinery, Balongan, Indonesia. The FCC spent catalyst was treated thermally using a furnace to remove coke and carbon. Afterward, the sample was regenerated using ozone, ultrasound, and a combination of ozone and ultrasound. Ozone gas was obtained from a generator (Dipo Tech Indonesia) for ultrasonic irradiation using an ultrasound bath type KLS 3003365 with a thermostatic water bath operating at 42 kHz.
Regeneration with UAOPs
Ultrasound and oxidation are often used as regeneration methods to remove impurities such as metals from spent catalysts. This study used an ultrasonic extractor (model JP-010S, Skymen, USA) with a power of 250 watts and a frequency of 40 kHz, with water as the leaching solvent due to its low cost and environmentally friendly nature. The effect of different methods on the regeneration of the spent catalyst was studied after adding 5 g of spent FCC catalyst into 100 ml (1:20) solid/liquid of the leaching solvent. Each method was conducted at 70 °C: 30 minutes for ultrasound, four hours for the oxidation process, and a combination of both methods (UAOPs). Furthermore, the Statistica 10 software was used to determine key parameters for leaching the spent FCC catalyst. After regeneration, the catalyst was separated from the solvent using Whatman 42 filter paper, dried in an oven (Memmert) at 100 °C overnight, and then calcined at 550 °C for four hours to prepare for acidity characterization and testing, along with the provided experimental designs, which are presented in Figure 1.
Regeneration UAOPs tools; (1) ultrasound bath, (2) ozone generator, (3) flask, (4) condenser, (5) stative clamp, and (6) thermocouple.
Characterization of acidity
The acidity characterization test was performed by weighing one sample layer in four identical containers. The base used was ammonia, which was then contacted with the samples in a desiccator. A constant weight can be achieved by weighing the sample's weight every day (Trisunaryanti, Purwono, & Putranto, 2008). The total acidity can be computed using Eq. (1):
Total of Acidity \[\left(\frac{\text{mmol}}{\text{gram}}\right) = \frac{\text{Weight NaOH (gram)}}{\text{Mol Weight NaOH }\frac{\text{gram}}{\text{mol}} \times \text{mass Sample (gram)}} \times 1000 \frac{\text{mmol}}{\text{mol}}\] (1)
Design of the experiment
An experimental model of glycerol monostearate synthesis using a regenerated FCC spent catalyst was created by determining key parameters such as temperature of regeneration, time of regeneration, and ozone flow rate. These parameters were selected because they are the most crucial in the regeneration process following treatment. The matrix design (the design of experiment/DOE) uses a central composite design based on the response surface method (RSM) (Lin et al., 2016). The design of the experiment (DOE) consisted of 16 runs, each comprising eight factorial points (1–8), six axial points (9–14), and two times at the center point (15, 16). An analysis of the interaction between independent variables and response was conducted using a second-order model. Eq. (2) shows the model of the polynomial:
\[Y = \beta_o + \sum_{i=1}^{3} \beta_i X_i + \sum_{i=1}^{3} \beta_{ii} X_i^2 + \dots + \sum_{i < i} \beta_{ij} X_i X_i\] (2)
In this equation, Y represents the response, \(\beta\)0 is the intercept, \(\beta\)i is a linear coefficient, \(\beta\)ii is a quadratic coefficient, \(\beta\)ij is the interaction coefficient, and XiXj is the independent variable.
Analyzing data
Regressions with multiple linear variables were used to determine the best regeneration UAOP conditions using the Statistica 10 software (Hamburg, Germany). Variable independence and dependence are shown in Table 1. Multiplying tests were conducted after the RSM optimization to confirm and verify the validity of the established model equation and the static experimental design. Therefore, the software was also capable of generating a graph displaying surface and contour response values in a three-dimensional plot (Khataee & Dehghan, 2011). The confidence level for comparing the mean total acidity in multiple experimental runs was set at \(\alpha = 0.05\), or a significance level of 95%.
Table 1 Independent and dependent variables for analysing test as response acidity.
| Variable | Code | Va | riable Co | de | Despense (mmel/s) | |
|---|---|---|---|---|---|---|
| variable | Code | -1 | 0 | +1 | Response (mmol/g) | |
| Temperature (°C) | \(x_1\) | 40 | Acidity | 80 | ||
| Leaching Time (min) | \(x_2\) | 10 | 40 | 70 | Acidity | |
| Ozone Flow Rate (L/h) | \(x_3\) | 8 | 9 | 10 | ||
Catalyst performance test for glycerol monostearate and GC-MS analysis
The next step after optimization was the formation of monoglycerides, which was achieved using a stearic acid (98% Merck)-to-glycerol molar ratio of 4:1. The regenerated catalysts, calcined in a muffle furnace (thermocline benchtop) at 550 °C (5% by weight), were diluted in glycerol at 70 °C in a glass vessel and stirred until the solution was entirely homogeneous. Afterward, the stearic acid was placed in a glass vessel and heated to 160 °C while stirring. As soon as the stearic acid reached the feed temperature, the glycerol and catalyst mixture continued to be added while the process began. Throughout the mixing process, the temperature was kept constant at 160 °C. The operating conditions were adjusted based on the optimization variable. The product was filtered from the residue and examined using gas chromatography–mass spectrometry (GC–MS). The main product was identified through GC–MS analysis (QP2010S SHIMADZU, DB-1 column) and the calculated conversion, selectivity. Additionally, the yield of glycerol monostearate was determined using Eqs. (3)–(5) (Trisunaryanti, Purwono, & Putranto, 2008).
\[Conversion X(\%) = \frac{\text{Total no.of peak area(Product+Feed)} - \text{no.of peak area (Feed)}}{\text{Total no.of peak area(Product+Feed)}} \times 100\%\] (3)
Selectivity S (%) = \[\frac{\text{Total no.of peak area product}}{\text{Total no.of peak area(Product+Feed)} - \text{no.of peak area (Feed)}} \times 100\%\] (4)
\[Yield Y (\%) = \frac{Conversion \% \times Selectivity \%}{100}\] (5)
Mechanism of kinetic modeling
After evaluating R2 for various reaction rate kinetics models, we confirmed the kinetic modeling of the reaction involved in the production of glycerol monostearate. The models considered include zero-, first-, and second-order irreversible reaction modeling, as seen in Eqs. (6)–(8). We processed the glycerol monostearate conversion data and determined the reaction rate constant (k) using a linear regression approach (y = mx + c). Based on the tested models and the experimental results, we could create conversion versus time graphs. The graphical findings clearly indicate that the selected reaction modeling was the best fit for the experimental data. The R2 testing helped in choosing the model, and, in this case, the selected graphical reaction order modelling had an R2 value that is nearly linear or close to 1.
Zero-order reaction:
\[kt = Xa. Ca\] (6)
First-order reaction:
\[kt = -\ln\frac{Ca}{Cao} \text{ or } kt = -\ln(1 - Xa)\] (7)
Second-order reaction:
kt (Cbo – Cao) = \[\ln \frac{M-Xa}{M(1-Xa)}\], where M = \(\frac{Cbo}{Cao}\) (8)
Here, Ca is the glycerol concentration, Cao is the initial glycerol concentration, and Cbo is the stearic acid concentration.
Results
FTIR parameter
For producing glycerol monostearate, it is important to understand the acidity. The effect of different regeneration methods (i.e., ultrasound, ozone, and UAOPs) on the regeneration of the spent catalyst was studied at 70 °C for 30 minutes under ultrasonic power of 250 W and a flow rate of 9 L/min of ozone. The acidity of the regeneration obtained with different regeneration methods is presented in Table 2. The calculation of acidity for the regeneration methods of spent FCC catalyst revealed varying results for ultrasound regeneration, oxidation regeneration, and their combination. The experiment demonstrated the various regeneration methods used. In this study, we evaluated each method individually to assess its significance for total acidity. It was found that the trendline is substantial when regeneration is applied to the catalyst, and the highest acidity comes from the combination of ultrasound and oxidation processes of the regenerated spent FCC catalyst.
Table 2 Acidity of regenerated spent FCC catalysts.
| Methods | Acidity (mmol/gram) |
|---|---|
| FCC Spent Catalyst | 0.00235 |
| FCC-Ultrasound | 0.00822 |
| FCC-Oxidation | 0.00939 |
| FCC-UAOPs optimum | 0.08460 |
As depicted in Figure 2, the results demonstrate that the total acidity increased after both ultrasound and oxidation treatments. If we examine the FT-IR band between 1,100 and 900 cm-1, the low intensity of the Si-O-Al in this scenario is a result of the Si-O-Al breakdown (Saikia, Goswami, Borthakur, Roy, & Borah, 2015). The ultrasound regeneration leads to a reduction in the intensities of the band observed in the ultrasound regeneration of spent FCC catalyst at 452 cm-1, 530 cm-1, and 802 cm-1, which is related to the dissolution of the zeolite phases and the successful removal of poison from the spent FCC catalyst, so it has vibration at band 1071 cm-1 after sonification regeneration (Bugaev, Van Bokhoven, Sokolenko, Latokha, & Avakyan, 2005). This process consists of reducing Al atoms in the framework into Al outside the structure via dealumination, which is the presence of hydrogen peroxide (Rodríguez et al., 2013) . Furthermore, using the FCC-oxidation method, it can be seen from the calculated total acidity test that it significantly increased and the FTIR band data (1067 cm-1, 802 cm-1, and 451 cm-1) decreased but were still higher than the data obtained using the ultrasound methods. This indicates that the metal on the spent FCC catalyst particles can be successfully removed; however, the Si-O-Al structure is not significantly damaged because there are more hydroxyl radicals than hydrogen peroxide.
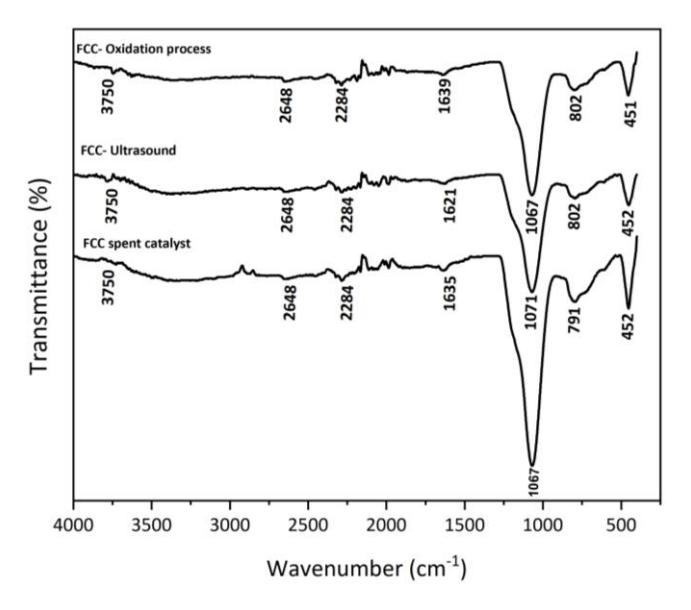
Fourier transform infrared spectra of regenerated spent FCC catalysts.
Model fitting and statistical analysis
Regression analysis using second-order polynomial equations wasfound to be the best match to explain the relationship between the independent and dependent variables and define optimum variables for the UAOPs method since it has the highest-order polynomial with significant additional terms and is not aliased (Vargas, Martins, & Almeidaet, 2012). The R2 value was 0.968, indicating that temperature, leaching time, and ozone flow rate contributed 96.8% to the variation in percent acidity. Simultaneously, the rest was influenced by other variables not included in the model/independent variables. The error could be attributed to factors such as pressure, catalyst type, and preparation methods that should have been considered during the experiment. The precision of this mathematical model is indicated through the significantly elevated R-square value obtained from the model of 96.8%, which means that the model is significant or strongly correlated in representing the data (Pérez-Palacios, Petisca, Melo, & Ferreira, 2012). The difference was 3.2%, which suggests that the model's prediction is highly relevant for acidity. The high value of the correlation coefficient close to +1 indicates that there is a high correlation between the experimental and predicted data. At the 95% confidence level, the p-value was less than 0.05, which indicates that the model is highly significant. The analysis based on the sum of squares from the model is shown in Table 3.
| Source | Sum of squares | dF | Mean of square | F-value | R2 | ||
|---|---|---|---|---|---|---|---|
| SSreg | 3615 | 15 | 241 | 1.315 | 0.391 | ||
| st Order 1 | SSerror | 2198 | 12 | 183 | Aliased | ||
| SStotal | 5486 | ||||||
| SSreg | 3615 | 15 | 241 | 12.852 | 0.968 | ||
| 2 nd Order | SSerror | 112 | 6 | 18 | Suggested | ||
| SStotal | 3727 |
Table 3 Regression Analysis in order selection based on the sum of squares model.
Table 4 displays the acidity values of regenerated FCC catalyst produced by ultrasound-assisted and oxidation processes (UAOPs). The findings demonstrate that the regeneration circumstances affect the extent of acid site recovery, with acidity values ranging from 0.025 to 0.0825 mmol g-1 . Acidity variations imply that some combinations of temperature and UAOPs parameters may help remove some of the coke or surface pollutants that obstruct acidic sites. However, the observed dispersion of values also indicates that the regeneration effectiveness is not uniform across all condition. Therefore, these results should be interpreted as preliminary evidence of UAOPs influence on catalyst acidity, warranting further optimization and validation.
| Reger | neration FCC-UAOPs | A -1 -lta | Charada ad | 6. 1 1 | |||||
|---|---|---|---|---|---|---|---|---|---|
| Samples | mples Temperature (°C) | Leaching Time (min) | Ozone Flow Rate (L/h) | Acidity (mmol/g) | Standard deviation | Standard error | |||
| 1 | 26.36 | 40 | 9 | 0.070 | |||||
| 2 | 40 | 10 | 8 | 0.040 | 3.63 | ||||
| 3 | 40 | 10 | 10 | 0.043 | |||||
| 4 | 40 | 70 | 8 | 0.064 | |||||
| 5 | 40 | 70 | 10 | 0.067 | |||||
| 6 | 60 | 10.45 | 9 | 0.025 | |||||
| 7 | 60 | 40 | 7.32 | 0.075 | |||||
| 8 | 60 | 40 | 9 | 0.0825 | 44.52 | ||||
| 9 | 60 | 40 | 10.68 | 0.070 | 14.52 | ||||
| 10 | 60 | 90.45 | 9 | 0.062 | |||||
| 11 | 80 | 10 | 8 | 0.058 | |||||
| 12 | 80 | 10 | 10 | 0.057 | |||||
| 13 | 80 | 70 | 8 | 0.068 | |||||
| 14 | 80 | 70 | 10 | 0.069 | |||||
| 15 | 93.64 | 40 | 9 | 0.073 | |||||
| 16 | 60 | 40 | 9 | 0.0815 |
Table 4 Regeneration FCC-UAOPs acid analysis results.
The correlations between the operating variables and the acidity response, as shown in Table 4, can be represented by a second-order polynomial mathematical equation using Eq. (9):
\[\label{eq:Acidity} \mbox{Acidity} = -379.051 + 2.091 X_1 + 1.861 X_2 + 78.113 X_3 - 0.011772 X_1^2 - 0.015878 X_2^2 - 4.243 X_3^2 - 0.005 X_1 X_2 - 0.037 X_1 X_3 + 0.00008 X_2 X_3 \mbox{ } \mbox{(9)}\]
The relevance and suitability of the quadratic model were also determined using analysis of variance (ANOVA), and the significance was assessed from the p-value calculated from the experimental data. Table 5 displays the ANOVA for the quadratic model of the response surface. It can also be interpreted that when the p-value is smaller than 0.05, it implies that the main factor contributes to the response.
| Parameter | dF | Adj SS | Adj MS | F-value | p-value | |
|---|---|---|---|---|---|---|
| Model | 9 | 3476 | 386 | 18.38 | 0.001 | < 0.05 |
| Linear | 3 | |||||
| Temperature (X1) | 1 | 148 | 148 | 7.07 | 0.037 | < 0.05 |
| Leaching time (X2) | 1 | 1241 | 1241 | 59.09 | 0.000 | < 0.05 |
| Flow rate (X3) | 1 | 1.42 | 1.42 | 0.0677 | 0.803 | > 0.05 |
| Quadratic | 3 | |||||
| \(X_1^2\) | 1 | 200 | 200 | 9.55 | 0.021 | < 0.05 |
| \(X_2^2\) | 1 | 1962 | 1962 | 93.39 | 0.000 | < 0.05 |
| \(X_3^2\) | 1 | 171 | 171 | 8.16 | 0.029 | < 0.05 |
| Two-way interaction | 3 | |||||
| \(X_1X_2\) | 1 | 32 | 32 | 1.29280 | 0.298 | > 0.05 |
| \(X_1X_3\) | 1 | 32 | 32 | 1.29280 | 0.298 | > 0.05 |
| \(X_2X_3\) | 1 | 8 | 8 | 0.3232 | 0.590 | > 0.05 |
| Error | 6 | 134 | 21.01 | |||
| Lack of Fit | 5 | 126 | 25.22 | 6.68 | 0.074 | > 0.05 |
| Pure Error | 2 | 8.89 | 4.445 | |||
| Total | 15 | 3666 |
Table 5 Analysis of variance (ANOVA) for quadratic response surface.
The p-value (often called the probability of error) is a tool to determine the significance of each regression coefficient and how much impact the interaction has on the response, as well as the effect of the interaction on the variable. The results indicate that the model for acidity was of considerable significance. The next step, then, was to identify insignificant variables so that, by ignoring relationships looking from Eq. (9) in Table 4 and Table 5, we could get Eq. (10):
Acidity = \[-348.801 + 1.537 X_1 + 1.611 X_2 + 76.196 X_3 - 0.011772 X_1^2 - 0.015878 X_2^2 - 4.243 X_3^2\] (10)
As the Pareto diagram in Figure 3 shows, both the linear and quadratic models for the variables were significant. Since the quadratic effect has a negative effect on acidity, a further increase in the independent variable will decrease acidity. In accordance with the preceding subsection, it was found that the cumulative linear effect of one of the independent variables positively affects acidity. Therefore, based on the statistical analysis, acidity can be improved by increasing the values of the independent variables, as they significantly and beneficially affect acidity
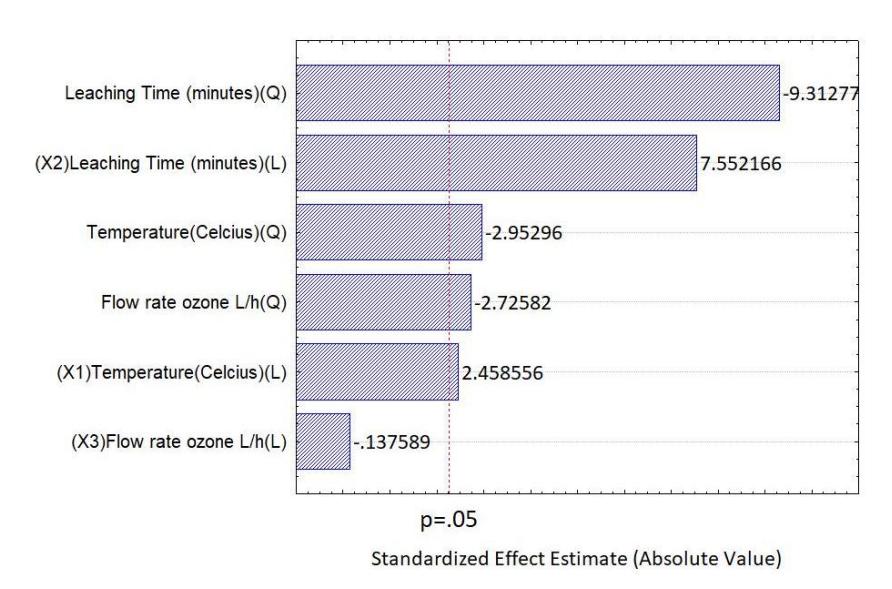
Temperature (X1), leaching time (X2), and ozone flow rate (X3) on the acidity of the regeneration UAOPs depicted in a Pareto diagram.
Figure 4 shows that the experimental data mostly fit near the diagonal line, confirming that the model developed correctly predicts the value of acidity. The points in this graph are aligned with or near a straight path, which indicates that the remainder of the experiment has a normal distribution and that the calculated response surface model is reliable. Conversely, if the points on the graph cannot form a straight line, then it does not correspond to a normal distribution (Lin et al., 2018). Each point that scatters is roughly equally distributed and lies near the straight line Y = X, which implies an excellent approximation to the experimental acidity.
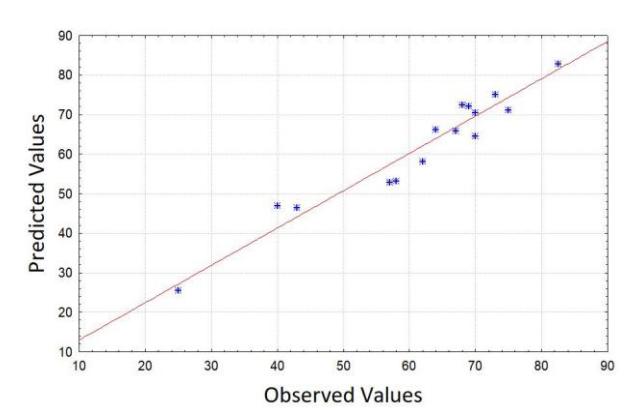
Predicted acidity against observed (experimental) acidity of regeneration UAOPs.
Analysis of response surface characteristics and effect on acidity
One way to show the response surface model is to create a response contour plot (acidity) with three factors that influence the response, namely, the reaction temperature function, leaching time, and flow rate. To illustrate the plot result, one factor was selected as a benchmark, which is a form of simplification. Based on the findings of the initial second-order modeling, the flow rate had a p-value of 0.803, which was higher than those of the other two variables, being 0.037 for temperature and 0.0001 for leaching time. Thus, the flow rate variable was used as the benchmark for this consideration. The result of running the response surface program produced two images in the form of contour graphs and surface graphs, as shown in Figures 5 and 6.
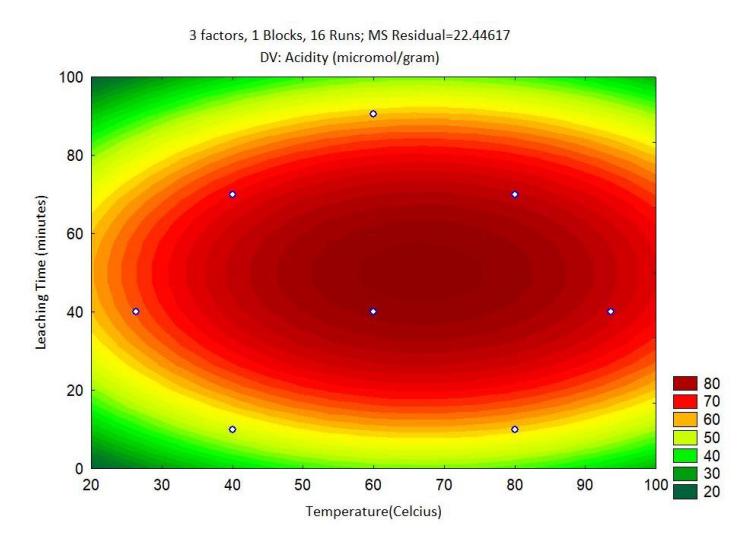
Contour graph: acidity vs. temperature, leaching time.
Figure 5 shows the resulting contour plot, which contains various color variations. Each variation indicates the range of the response generated. Dark red in the plot represents the maximum condition, indicating an acidity value exceeding 80 micromoles per gram. This color range provides a general indication of the optimal location for the variable. As Figure 5 shows, the acidity response increased as the leaching time ranged from 40 to 60 minutes and temperature ranged from 50 to 80 °C. Thus, by selecting this temperature and leaching time range, acidity levels above 80 micromoles per gram can be achieved. We can determine the optimum point of each factor from the obtained combinations. Following an examination of the regeneration parameters to identify the optimal regeneration through acidity, the optimization of UAOPs experiments was conducted to establish the most effective variable regeneration of the catalyst.
The assessment of acidity is conducted by gravimetry, which entails the absorption of ammonia—a completely alkaline substance—by zeolite characterized by its acidic sites. Moreover, the acidity of the catalyst is characterized by its capacity to absorb bases. The stronger the catalyst's adsorption capacity, the higher the acidity of the site, attributable to the extensive exposure of the spent FCC catalyst (Anggoro et al., 2019). The value of each optimum factor was 67 °C for temperature and 50 minutes for leaching time, resulting in an acidity of 84.6 micromoles per gram. The determination of the optimum condition for the above factor was proven by a three-dimensional curve that forms an optimal peak, as shown in Figure 6 below.
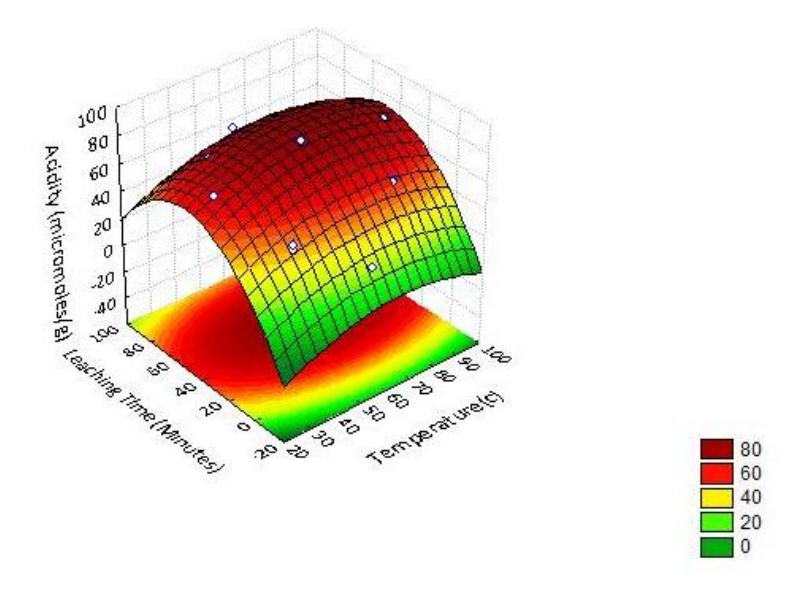
Surface graph: acidity vs. temperature, leaching time.
Figure 6 illustrates the relationship between time and temperature in flow rate (9 L/h) and the regeneration of the spent FCC catalyst, along with the resulting acidity. The higher the leaching temperature, the higher the acidity of the spent
FCC catalyst. At 60 °C, total acidity hovered above 40 °C. This effect arose from the removal of impurities from the pores of the spent FCC catalyst, thus improving the catalyst's crystallinity.
The crystallinity of the catalyst denotes the degree to which the crystal structure is maintained (Anggoro, Oktavianty, Sasongko, & Buchori, 2020). Meanwhile, higher temperatures will damage the framework. This occurs because higher temperatures encourage interactions between the acid solvent and the spent catalyst, which will accelerate corrosion and damage the particle. The graph shows that the overall acidity decreases as the temperature rises to 90 °C compared to 80 °C. Additionally, the introduction of ultrasonic waves into the acid solution causes the liquid to vibrate and produce many tiny bubbles known as cavitation bubbles. When the bubbles collapse, high pressure and temperature are created in the liquid's center, which facilitate contact between the oxidizing reagents and the spent FCC catalyst particles and speed up the diffusion and mass transfer process. The cavitation process is positively impacted by raising the temperature of the regeneration process; however, if the temperature becomes excessive, the vapor pressure inside the bubble rises, thereby enhancing the buffering effect when the bubble breaks down and decreasing the cavitation (Wang et al., 2021). This is another reason why the total acidity reaches its highest value at 60 °C and then begins to decrease slightly at 80 °C.
As regards the leaching time of the regeneration spent FCC catalyst, the results show that the total acidity remains intact when the leaching time of UAOPs extends from 10 to 60 minutes. An extended regeneration period correlates with increased acidity in the spent FCC catalyst. This alteration results from the decrease of poisons on the catalyst surface, enabling previously obstructed active sites to reactivate. Upon the removal of contaminants from the pores of the spent FCC catalyst, conditions are established that facilitate the incorporation of amorphous alumina and silica into the zeolite framework, thereby enhancing the structure (Wang et al., 2021). However, due to the mechanical action of ultrasonic irradiation and the action of acid formation between H2O reaction with O3, the damage to the particle grows more severe when the period exceeds 70 minutes, and the presence of ozone is believed to cause the spent FCC catalyst to interact with ozone for extended periods, which increases the number of active decomposition sites by altering the surface structure of zeolite. This decomposition by ozone occurs slowly, and previously active sites become inactive as regeneration progresses (Monneyron, Mathé, Manero, & Foussard, 2003). Because of this, extending the leaching time to 90 minutes lowers the acidity obtained more than the 60-minute duration, as shown in Figure 6.
Effect of acidity regeneration of spent FCC catalyst treatment on producing glycerol monostearate
The analysis of glycerol monostearate components was obtained by performing sampling GC–MS, ultrasound, oxidation process, and UAOPs optimum methods. The table in the fifth sample presents the result of GC–MS testing on the regenerated spent FCC catalyst, which can produce glycerol monostearate. The oxygenated compounds are categorized by their functional groups, including chain hydrocarbons, alcohols, and ketones (Istadi et al., 2022). The various methods of regeneration led to different amounts of chemical compositions in glycerol monostearate products. The optimum catalyst produced by FCC-UAOPs optimum, as shown in Table 6, indicates that this method produces more glycerol monostearate compared to other methods as acidity increases. The rise in acidity results from a higher Si/Al percentage, which is attributed to enhanced catalyst activity (Anggoro et al., 2019). Enhanced catalyst activity aids in lowering the activation energy required for a compound's reaction. The linear conversion of glycerol and stearic acid into glycerol monostearate is driven by increasing acidity, which is demonstrated by the reduction of stearic acid and oxygenated compounds, leading to their transformation into glycerol monostearate. The varying levels of oxygenated compounds indicate that intramolecular esterification can produce oxygenated molecules (containing cyclic groups) in glycerol through the regeneration of spent FCC catalyst. It was found that the proportion of acidity on the catalyst increased as the total volume of oxygenated compounds decreased during the production of glycerol monostearate. Additionally, oxygenated compounds were observed when the catalyst had lower Brønsted and Lewis acid sites, which can impact the oxygenation reaction (Fan, Bao, Lin, Shi, & Liu, 2006). This evidence indicates that optimizing the acid site concentration on the catalyst is crucial for enhancing the yield of glycerol monostearate.
| Composition (wt.%) | |||||||
|---|---|---|---|---|---|---|---|
| Component | Spent FCC | FCC-ultrasound | FCC-oxidation process | FCC-UAOPs optimum | |||
| Glycerol monostearate * | 13.93 | 11.90 | 18.95 | 25.33 | |||
| Stearic Acids | 38.24 | 69.96 | 68.95 | 63.53 | |||
| Oxygenated Compound | 38.28 | 13.17 | 11.54 | 8.14 | |||
| Acidity (mmol/g) | 0.00235 | 0.00822 | 0.00939 | 0.08460 | |||
| *Index similarity = 92% | |||||||
Table 6 GC–MS analysis of glycerol monostearate production by different methods.
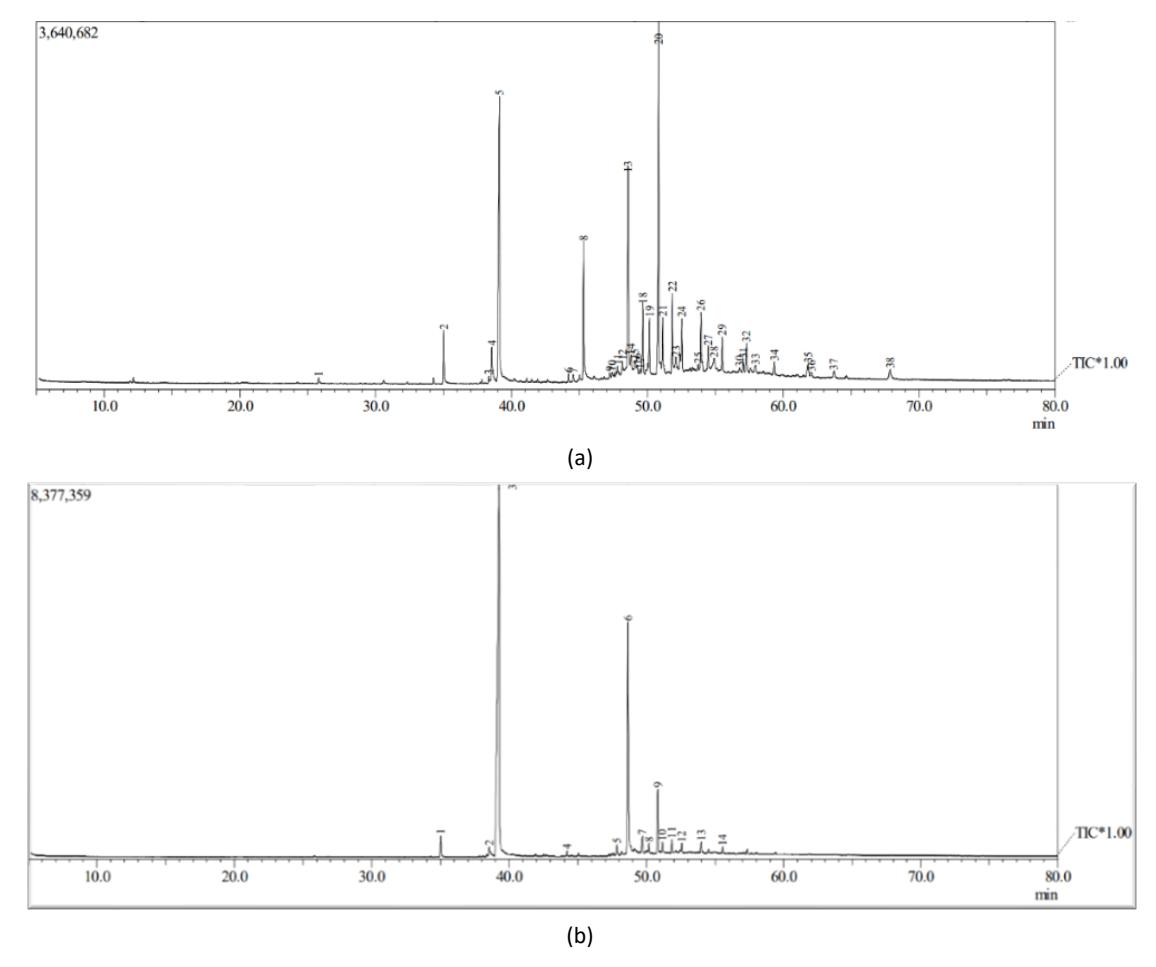
GC–MS spectra: (A) synthesis FCC-UAOPs optimum, (B) commercial product.
The GC–MS spectra of the optimal FCC-UAOPs synthesis indicate similarities to the commercial product. This conclusion is evidenced by peak number 6 at a retention time of 48.650 in Figure 7(A), which has an abundance of 20.86% and a molar weight of 330. Additionally, peak number 13 at a retention time of 48.592 in Figure 7(B) has an abundance of 12.21% and a molar weight of 330. According to the National Centre for Biotechnology Information (2025), the PubChem compound summary for CID 24699 indicates that monostearin, or glycerol monostearate, has a molecular weight of 358.88 and a similarity index of 92%. Therefore, the synthesized compound is identified as glycerol monostearate.
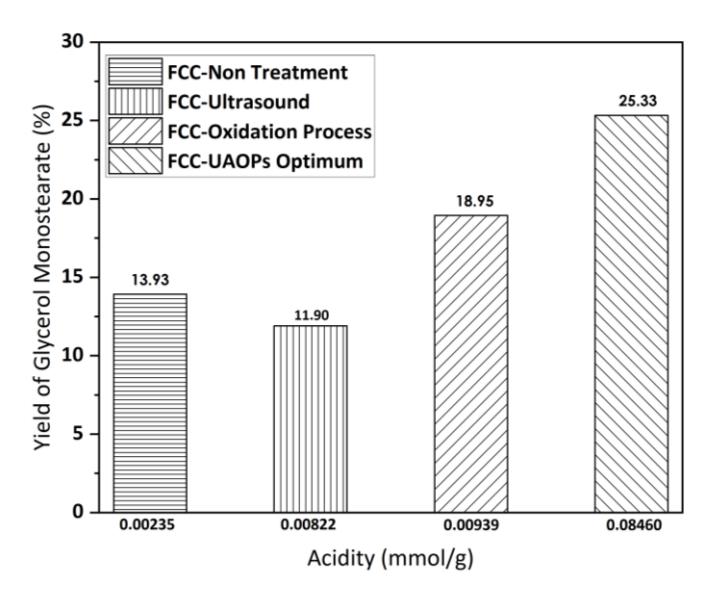
Effect of regeneration spent FCC methods on yield and acidity.
\[H_2O \rightarrow \bullet OH + \bullet H\] (11)
\[\bullet \text{ OH} + \bullet \text{ OH} \rightarrow \text{H}_2\text{O}_2 \tag{12}\]
\[H_2O_2 + O_3 \rightarrow \bullet OH + \bullet HO_2 + O_2\] (13)
\[\bullet \text{ OH} + \bullet \text{ H} \rightarrow \text{ OH}_2 \tag{14}\]
\[\bullet \text{ HO}_2 + \bullet \text{ H} \rightarrow \text{H}_2\text{O}_2 \tag{15}\]
• \[H_2O + O(^3P) \to 2OH\] • (16)
Typically, both hydroxyl radicals (•OH) and hydrogen peroxide (H2O2) act as powerful oxidizing agents in the oxidation leaching process. When ultrasound is applied to ozone (O3), it produces more hydroxyl radicals through the reaction between O3 and H2O2, which contributes to a higher percentage of removal metals being extracted from the spent FCC catalyst (Astuti, Prilitasari, Iskandar, Bratakusuma, & Petrus, 2018). The presence of O3 bubbles enhances the cavitation effect induced by ultrasound. These outcomes indicates that the combination of ultrasonic and ozone treatments enhances metal removal due to an increased gas-liquid mass transfer coefficient of ozone. Additionally, the c decomposes O3 into O2 and O(3P) species, which reacts with water vapor to form •OH, as illustrated in Eq. (16) (Zhang et al., 2023). Ultrasound exposure increases the solubility of O3 in the solution, resulting in the production of a significant amount of c (Yang et al., 2024). The use of ultrasound-assisted hydroxyl radicals in UAOPs leads to improved crystallinity and pore size of spent FCC catalysts, while optimizing the Si/Al ratio can result in increased acidity (Anggoro, Oktavianty, Sasongko, & Buchori, 2020). This elucidates why the acidity of the optimized UAOPs increases relative to other approaches, thereby enhancing the catalyst's efficacy in the conversion of glycerol to glycerol monostearate. The data indicate that controlled UAOPs, optimized at 60 °C and a leaching duration of 50 minutes, effectively achieve the targeted removal of metal poisons and occluded substances, thereby enhancing catalyst activity and restoring acidity compared to other methods.
Based on previous research, it was found that the regeneration of spent FCC catalyst and ZSM-5 has almost similar selectivity with the glycerol monostearate yield result, indicating that using ZSM-5 catalyst produces a yield of 21.07% (Anggoro et al., 2019) and the spent FCC-UAOPs catalyst produces a yield of 25.33%. This data indicates that the FCC-UAOPs is slightly more selective than the ZSM-5 catalyst. When comparing the acidity values of spent FCC catalyst regenerated using UAOPs that have been optimized, the acidity value is higher at 0.0846 mmol/g compared to dealuminated zeolite Y at 0.0272 mmol/g (Anggoro, Oktavianty, Sasongko, & Buchori, 2020). Therefore, the production of glycerol monostearate is higher when using spent FCC-UAOPs optimum compared to zeolite Y. The influence of acidity on the formation of glycerol is evident.
Reaction kinetics of glycerol monostearate
In determining the kinetic reaction, it is necessary to perform a titration on the glycerol monostearate product over time to obtain the concentration of the limiting reactant, glycerol. The reaction sequence and reaction rate provide constant values when determining the reaction kinetics. The correlation between concentration and time reveals these values. In this study, the batch method was used to measure glycerol content. Table 7 shows that the operating temperature was 160 °C, with stirring at 300 rpm. The concentration of glycerol decreased over time, indicating the optimum capacity of the FCC catalyst UAOPs to synthesize glycerol monostearate. The determination of the reaction order was based on the R² value approaching one, indicating that the kinetic model of the reaction closely aligns with the actual value. Here, Cao is the initial glycerol feed in moles, X is the conversion that reflects the ability of the FCC catalyst to synthesize glycerol monostearate, Cbo is the stearic acid feed in moles, and M is the molar ratio of stearic acid feed to glycerol feed.
Table 7 The outcomes of glycerol concentration were analysed over time, along with the models of reaction kinetics.
| Operation Variables | Zero Order | First Order | Second Order | |||
|---|---|---|---|---|---|---|
| Temperature | Stirring Speed | Time (min) | Glycerol Concentrations (Ca) | X.Cao | (-ln(1-X)) | (ln(M-X)/(M(1-X)) |
| 0 | 0.0746 | 0 | 0 | 0 | ||
| 60 | 0.0733 | 0.0013 | 0.017 | 0.0160 | ||
| 120 | 0.0390 | 0.0356 | 0.648 | 0.6087 | ||
| 160 °C | 300 rpm | 180 | 0.0352 | 0.0395 | 0.752 | 0.7088 |
| 240 | 0.0329 | 0.0417 | 0.817 | 0.7713 | ||
| 300 | 0.0177 | 0.0569 | 1.438 | 1.3750 | ||
| 360 | 0.0195 | 0.0580 | 1.499 | 1.4346 | ||
The data presented in Figure 9 indicate that the R² value for the second-order reaction (0.92485) was closer to 1 than that of the zero-order (0.8605) and first-order (0.92476) models, which was considered more reliable. This suggests that the second-order model is more accurate for describing the kinetic reaction of glycerol monostearate using the spent FCC-UAOPs optimum catalyst in this study. The modeling was performed under the assumption that Cao ≠ Cbo, and the obtained value of K was 0.00428 L/mol·min.
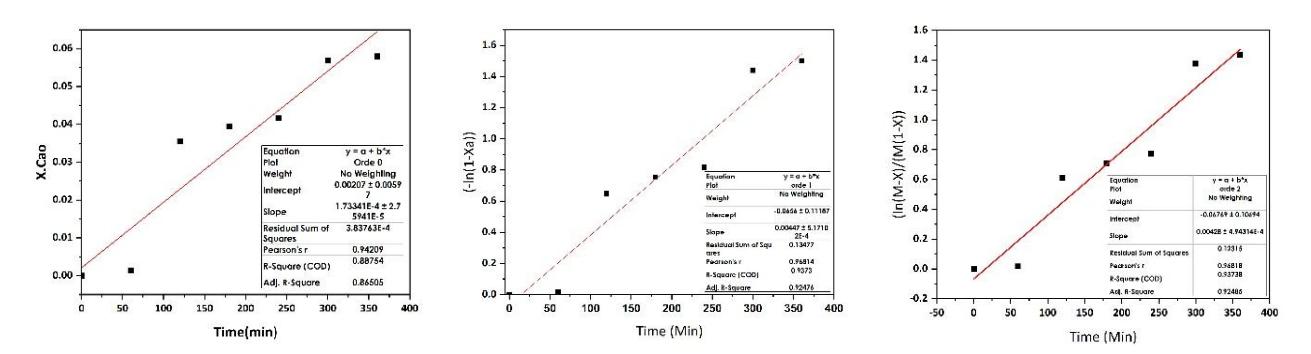
Reaction rate kinetics from right to left: Zero-order model, first-order model, and second-order model.
The adsorption capacity of glycerol into glycerol monostearate was observed after titration, resulting in the adsorption rates shown in Figure 10. With the batch system, the catalyst can only be recycled once, as evidenced by the data indicating that after running for five hours, the adsorption rate decreased from 78% to 74%. This suggests that the FCC catalyst can only be used once with the batch method. However, it is possible that a continuous system could allow for repeated catalyst regeneration can be performed repeatedly, which could lead to a consistent adsorption rate.
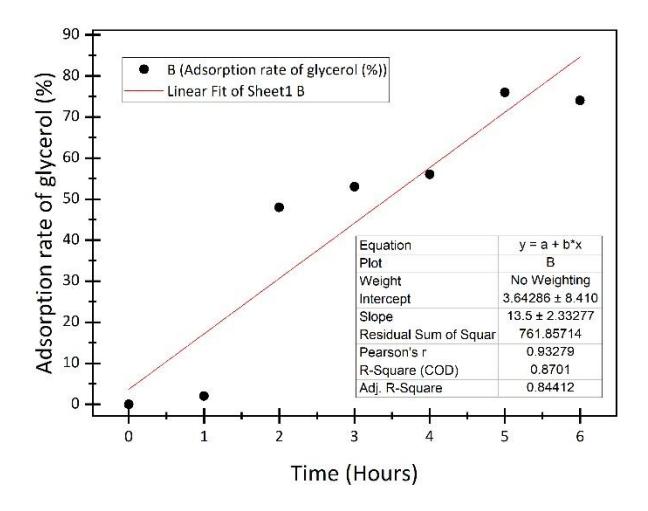
The adsorption rate of glycerol.
Conclusion
This study utilized the Statistica 10 software to optimize the regeneration of spent FCC catalysts. The regeneration process involved parameters such as ozone flow rate, temperature, and regeneration time. The fourth sample, which was the regeneration of the spent FCC catalyst with the highest total acidity value, underwent GC–MS testing. The optimal regeneration conditions were found to be at an optimum temperature of 60 °C, a flow rate of 9 L/h, and a duration of 50 minutes for spent FCC-UAOPs, resulting in a yield of 25.33% glycerol monostearate, with an acidity of 0.08460 mmol/gram. The data showed that higher acidity correlated with a greater yield of glycerol monostearate. Conversely, ultrasound treatments were applied due to their ability to alter the catalyst's surface characteristics, which led to a decrease in acidity yield. These findings surpass previous reports, demonstrating that the use of spent FCC UAOPs yields more glycerol monostearate than dealumination zeolite Y (4%) and is slightly higher compared to the ZSM-5 catalyst (21.07%). Additionally, the experimental results suggest that the longer the catalyst is used, the greater its ability to synthesize glycerol monostearate. The reaction rate for glycerol monostearate production from the esterification of glycerol and stearic acid follows a second-order reaction rate, with an R² value of 0.92485. The calculated rate constant is 0.00428 L/mol·min, based on the equation − (1−) = ( − ). An excess of the reactant stearic acid remains, while glycerol, the limiting reactant, is unable to react further with the available stearic acid that the catalyst could convert to glycerol monostearate. The adsorption rate of glycerol reached 78% after a duration of five hours, subsequently declining to 74%. This observation suggests that the spent FCC catalyst is suitable exclusively for batch methods. Consequently, further research is warranted to explore the use of a continuous system for more effective production of glycerol monostearate. In a broader context, the findings could pave the way for advancements in the regeneration of spent FCC catalysts.
Acknowledgement
The authors would like to express their heartfelt appreciation to Diponegoro University's Research Institution and Community Service in Semarang, Indonesia, for the financial support received under the RPI research project (source of funds other than the Diponegoro University State Budget, with the Contract of Research Fiscal Year 2021 No: 185- 89/UN7.6.1/PP/2021).
Compliance with ethics guidelines
The authors declare they have no conflict of interest or financial conflicts to disclose.
This article contains no studies with human or animal subjects performed by the authors.