
1 Introduction
Fingerprint matching is the most popular biometrics technique used in automatic personal identification systems. The first application of fingerprints was in the field of criminal investigation, but nowadays with the progress in computer technology it has become more popular in different fields such as: employee identification, physical access control, and information system security. There are other biometrics techniques available such as: hand geometry, iris recognition, speaker-face recognition, and so forth.
Automatic Fingerprint Identification System (AFIS) is becoming more popular in security access and E-commerce applications. Types of fingerprint sensor available at the current market are solid state, optical, ultrasonic, passive
capacitance, and active capacitance. Two types of fingerprint sensor (the solid state sensor and optical sensor) cannot avoid capturing distortion and poor quality fingerprint images due to physical problems such as dry, oily, dirty finger, dirty sensor surface, scar, patchy skin, and other factors.
Distortion quality of fingerprint images is the cause of the occurrence of problems in operating the fingerprint authentication systems such as false acceptance and false rejection. Factors that may cause the quality distortion of fingerprint image such as types of sensors (sensitivity instrument) that is used in making fingerprint image, physical damage such as persons working with chemical materials, works that need to use hands heavily, and others. It can result in the user facing difficulties when using such as system for identification. Therefore, in this paper we propose a model for determining the standard value of acquisition distortion of the fingerprint images that has been taken using optical sensor fingerprint in the authentication system. The proposed scheme can be used to determine the standard value of acquisition distortion of the fingerprint images for the AFIS administrator.
The objective of this study is to determine the standard value of acquisition distortion of the fingerprint images based on the analysis of quality of fingerprint images that has been taken for the authentication system.
2 Related Research
Previous related literatures can be found in various publications. Lim, et al. [1] proposed a method by using the ratio of the eigen values of the gradient vectors to estimate the local ridge orientation certainty and the orientation flow to determine the orientation quality. The ratio of eigen values can indicate the degree of confidence of orientation estimation, provided that the noise is not directional. However, certain sensor, such as strip sensor that captures the fingerprint image by sliding the finger on the sensor, produces image with some vertical lines due to sliding. Such anisotropic noise prevents the orientation confidence level from accurately reflecting the quality of the fingerprint image. Hong, et al. [2] used sine wave to model the ridge and valley pattern of the fingerprint. However, it is difficult to use this method to differentiate between the valid and invalid fingerprint images since the ridge and valley pattern is not a sine wave for many real fingerprint images. Bolle, et al. [3] computed quality measurement using the ratio of directional area to other non-directional area. Shen, et al. [4] used Gabor filter to every image sub-block with assumption that a good fingerprint with clear repetition of ridge and valley pattern can be recognized by the outputs of a Gabor filter bank. Both of these methods exploited the local orientation information. However, the local directional strength is not sufficient to measure the quality of the images, if much more
other information such as scar can be found in local ridge and valley structure and global smooth ridge flow in a fingerprint image. Almansa, et al. [5] proposed using ridgeness measurement, which eliminates good area (clear ridge) from scar, fragmented ridges, blurred, and over-inked area, hence giving a qualitative measure of fingerprint quality. However, this method is not effective if the area contains small quantity of noises and highly curved area. Therefore, the ridgeness measure will return a value that is not able to reflect the actual quality. Chen, et al. [6] proposed using ridge and valley clarity and global orientation flow for calculating the score of overall image quality that is used to determine the quality of the fingerprint image. Unfortunately this paper does not explain the level and type of the quality of each fingerprint. Syam and Hariadi [7] proposed detection and classification method for defecting fingerprint images adaptively. The method was to detect and classify the defects of fingerprint images based on the quality of the image by extracting the six characteristics/features of the fingerprint images and analyzing the image quality with clustering method. However, this method is limited to the type of oily, dry and neutral finger but without mentioning the standard values and parameters of each type of fingerprint.
In this paper, we introduce a model to determine the standard value of distortion of the fingerprint image acquisition based on analysis of quality of fingerprint images. The ridge-valley clarity score and ridge-valley thickness ratio score will be used to describe the fingerprint quality and the quality of ridge-valley thickness. An overall image quality is then computed by the above indicators (i.e. ridge-valley clarity and ridge-valley thickness ratio score) to describe the estimated quality of fingerprint images. The calculation of the proposed scheme is performed by computing these two indicators' score from a database with 1704 fingerprint images. Definition of the "standard" in this study is the standard value that describes the quality of a fingerprint taken using an optical scanner fingerprint reader.
In this work, we used the DB_ITS_2009 database, which is a private database collected in the Department of Electrical Engineering, Institute of Technology Sepuluh Nopember Surabaya. The database indicates a better match with great caution because the image quality considerations. It is taken using an optical sensor U.are.U 4000B fingerprint reader with the specifications: 512 dpi, USB 2.0, flat fingerprint, uncompressed. This database has a 1704 fingerprint image with size 154x208 pixels consisting of three types (oily, dry, neutral). Each type consists of 568 fingerprint images from 71 different fingers. Each finger is taken as many as eight times.
3 Fingerprint Images
Fingerprint is the oldest biometric identity sign. On the inside surface of the hand (palm of the hand from the fingertip to the wrist) there is a pattern of lines on the skin along the flow of sweat pores. The pattern of lines on the fingertip is called fingerprint [8].
Figure 1 explains that the fingerprint consists of ridge and valley. Ridge definition as a single curved section and the valley is the region between two adjacent ridges. In general, black lines mean ridge and white stripes mean valley.
Figure 1 Ridge and valley of fingerprint.
In general, the fingerprint image quality relies on the clearness of separated ridges by valleys and the uniformity of the separation. A fingerprint image changes in many ways because of the changes in environmental conditions such as temperature, humidity and pressure. The overall quality of the fingerprint depends greatly on the condition of the skin [2]. Dry skin tends to cause inconsistent contact of the finger ridges with the scanner's platen surface, causing broken ridges and many white pixels replacing ridge structure. To the contrary, the valleys on the oily skin tend to fill up with moisture, causing them to appear black in the image similar to ridge structure. Figure 2 shows oily/neutral/dry images, respectively.
Figure 2 Various of fingerprint images.
The types of fingerprint images based on the environment conditions according to [9] are defined as follows:
- Oily fingerprint image: SR > SV
- Neutral fingerprint image: SR = SV
- Dry fingerprint image: SR < SV
4 Computing the Distortion Parameter Values
In this study, we analyzed the data from two previous studies that investigated the quality of fingerprint images. They investigated two parameters, namely, ridge-valley clarity score and ridge-valley thickness ratio, which provided the base for further attempt to determine the distortion parameter values. Figure 3 shows an overview of a model to compute the standard value of acquisition distortion parameters of the fingerprint images.
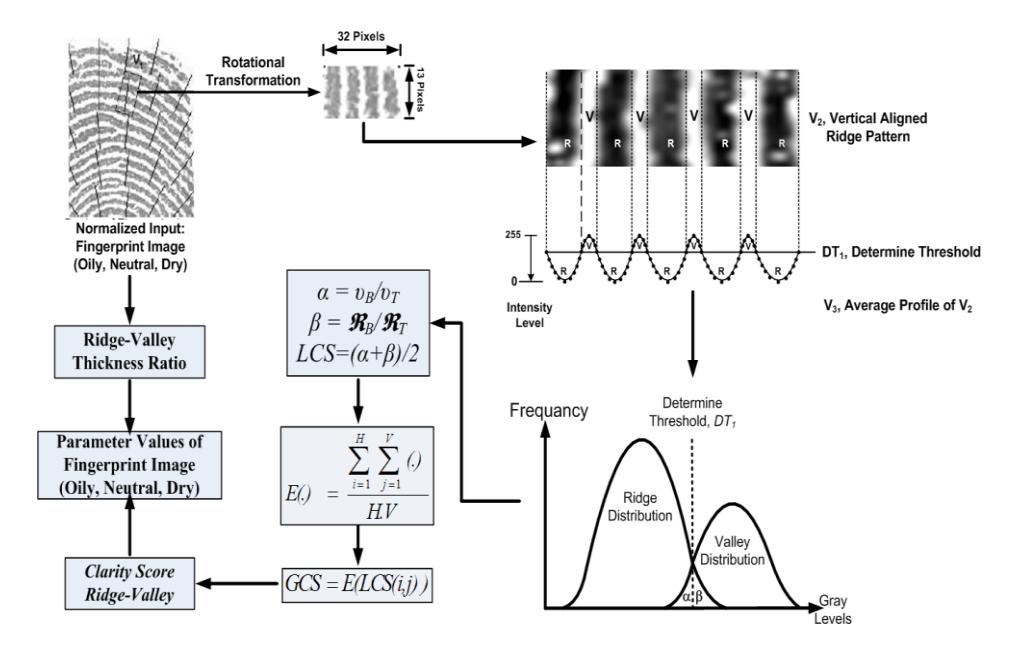
Figure 3 Overview of a model to compute the standard value of acquisition distortion parameters of the fingerprint images.
4.1 Segmentation
The first step of the distortion parameter computation algorithm is image segmentation. Segmentation is the process of separating the foreground regions in the image from the background regions. The foreground regions correspond to the clear fingerprint area containing the ridges and valleys, which is the area of interest. The background ones correspond to the regions outside the borders of the fingerprint area, which do not contain any valid fingerprint information. When minutiae extraction algorithms are applied to the background regions of an image, it results in the extraction of noise and false minutiae. Thus, segmentation is employed to discard these background regions, which facilitates the reliable extraction of minutiae.
In a fingerprint image, the background regions generally exhibit a very low gray-scale variance value, whereas the foreground regions have a very high variance. Hence, a method based on variance threshold [10] can be used to perform the segmentation. Firstly, the image is divided into blocks and the gray-scale variance is calculated for each block in the image. If the variance is less than the global threshold, then the block is assigned to be a background region; otherwise, it is assigned to be part of the foreground. The gray-level variance for a block of size NxN is formulated as in equation (2)
\[M(k) = \frac{1}{N^2} \sum_{i=1}^{N} \sum_{i=1}^{N} I(i,j)\] (1)
\[V(k) = \frac{1}{N^2} \sum_{i=1}^{N} \sum_{j=1}^{N} (I(i,j) - M(k))^2\] (2)
where V(k) is the variance for block k, I(i,j) is the gray-level value at pixel (i,j), and M(k) is the mean gray-level value for the block k. In this work, size of N is 16 pixels. Figure 4 shows segmented image.
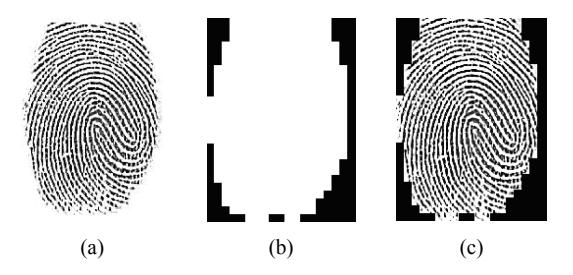
Figure 4 (a) Original, (b) Background, and (c) Segmented images.
4.2 Normalization
The next step of the distortion parameter computation algorithm is image normalization. The main purpose of the normalization operation is to reduce the variations of gray-level values along the ridges and valleys. The operation is pixel-wise and does not change the clarity of the ridges and valleys. Fingerprint image normalization is to reduce high frequency noise in the fingerprint image using equation (5) [11].
\[Mean = \frac{1}{PQ} \sum_{i=1}^{P} \sum_{j=1}^{Q} I(i,j)\] (3)
\[Var = \frac{1}{PQ} \sum_{i=1}^{P} \sum_{j=1}^{Q} (I(i,j) - Mean)^{2}\] (4)
\[Norm = \begin{cases} Mean + \sqrt{\frac{Var(I(i,j) - Mean)^2}{Var}}, & \text{if } I(i,j) > Mean \\ Mean - \sqrt{\frac{Var(I(i,j) - Mean)^2}{Var}}, & \text{otherwise} \end{cases}\](5)
In equation (3), (4), and (5), Mean is the average of gray scale intensity values in the image I at location (i,j), where i and j are horizontal and vertical index of the image respectively. P and Q are the number of horizontal and vertical pixels of the image, respectively. In this work, size of the image is 154x208 pixels. Var is the variance of gray scale intensity values in the image I, and Norm is the normalization of the image I. Figure 5 shows normalized image.
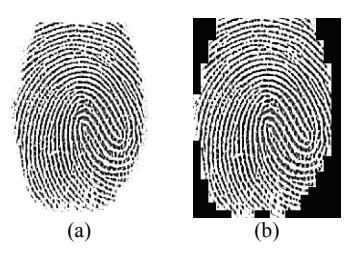
Figure 5 (a) Original image, (b) Normalized image.
4.3 Analysis of Ridge-Valley Clarity
Ridge-valley clarity indicates the ability to distinguish the ridge and valley along the ridge direction. A method of analyzing the distribution of segmented
ridge and valley is introduced to describe the clarity of the given fingerprint pattern [6].
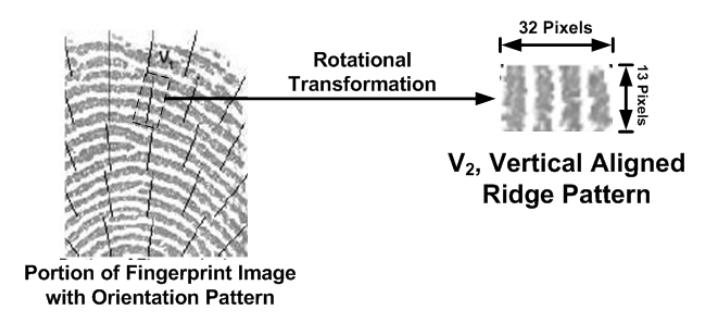
Figure 6 Extraction of a local region and transformation to vertical aligned ridge pattern [6].
To perform local clarity analysis, the fingerprint image is quantized into blocks size 32x32 pixels. Inside each block, an orientation line, which is perpendicular to the ridge direction, is computed. The center of the block along the ridge direction, a 2-D vector \(V_1\) (slanted square in Figure 6) with pixel size 32x13 pixels can be extracted and transformed to a vertical aligned 2-D Vector \(V_2\). By using equation (6), a 1-D Vector \(V_3\), that is the average profile of \(V_2\), can be calculated [6].
\[V_3(i) = \frac{\sum_{j=1}^{m} V_2(i,j)}{m}, i = 1...32\] (6)
Where m is the block height (13 pixels) and i is the horizontal index.
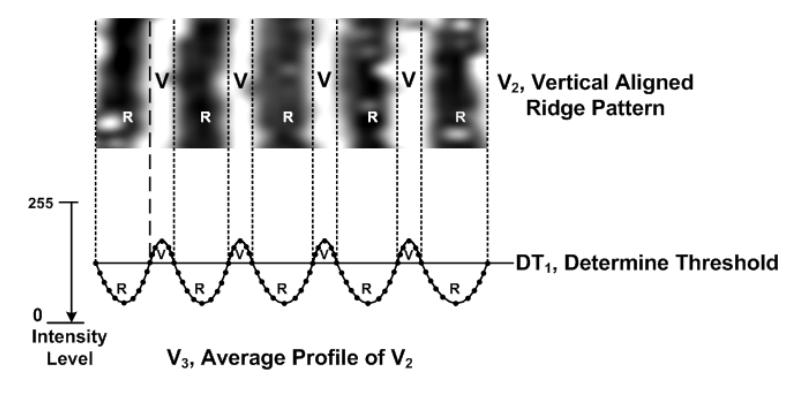
Figure 7 Region segmentation of vector \(V_2\) [6].
Once \(V_3\) has been calculated by equation (6), linear regression can be applied to \(V_3\) to find the Determine Threshold \((DT_1)\). Figure 7 shows the method of regional segmentation [6]. \(DT_1\) is the line positioned at the center of the Vector \(V_3\), and is used to classify the ridge region and valley region. The lower regions than \(DT_1\) are the ridges, otherwise are the valleys. Hence, the regions of ridge and valley can be separated in the 2-D vector \(V_2\) by the 1-D average profile \(V_3\)with the \(DT_1\) as shown as the dotted straight line in Figure 7. Once the ridge and valley have been separated, a clarity test can be performed in each segmented rectangular 2-D region. Figure 8 shows the gray level distribution of the segmented ridge and valley. The overlapping area is the region of misclassification, which is the area of failing to determine ridge or valley accurately by using \(DT_I\). Hence, the area of the overlapping region can be an indicator of the clarity of ridge and valley. The following equations (7), (8), and (9) describe the calculation of the clarity score [6].
\[\alpha = \frac{v_B}{v_T} \tag{7}\]
\[\beta = \frac{\Re_B}{\Re_T} \tag{8}\]
\[LCS = \frac{(\alpha + \beta)}{2} \tag{9}\]
Where \(v_R\) is the number of bad pixels in the valley that the intensity is lower than the \(DT_I\), \(v_T\) is the total number of pixels in the valley region, \(\Re_B\) is the number of bad pixels in the ridge whose intensity is higher than the \(DT_I\), \(\mathfrak{R}_T\) is the total number of pixels in the ridge region. \(\alpha\) and \(\beta\) are the portion of bad pixels. Hence, the Local Clarity Score (LCS) is the average value of \(\alpha\) and \(\beta\).
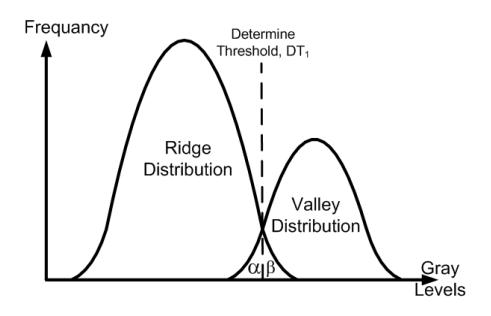
Figure 8 Distribution of ridge and valley [6].
For ridges with good clarity, both distributions should have a very small overlapping area. The following factors affect the size of Total Overlapping Area [6]:
- 1. Noise of ridge and valley,
- 2. Scar across the ridge pattern,
- 3. Water patches on the image due to wet finger,
- 4. Incorrect orientation angle due to the effect of directional noise,
- 5. Highly curved ridge,
- 6. Minutiae, bifurcation, delta point or core.
Factors 1 to 4 are physical noise found in the images. Factors 5 and 6 are actual physical characteristics of the fingerprint. Therefore, a small window with size 32x13 is chosen to minimize the chance of encountering too many distinct features in the same location.
The Global Clarity Score (GCS) can be computed by the expected value of the Local Clarity Scores (LCS).
\[GCS = E(LCS(i,j))\], where \(E(.) = \frac{\sum_{i=1}^{H} \sum_{j=1}^{V} (.)}{H.V}\) (10)
In equation (10), LCS(i,j) is the clarity score that is calculated from equations (7), (8), and (9) at location (i,j), where i and j are horizontal and vertical index of the image block, respectively. H and V are the maximum number of horizontal and vertical block, respectively. The GCS can be used to describe the general ridge clarity of a given fingerprint image.
4.4 Ridge-Valley Thickness Ratio (RVTR)
The ratio for ridge thickness to valley thickness is computed in each block [1]. The image is divided into several blocks that do not overlap with the size of MxN pixels. Ridge thickness and valley thickness are obtained using gray level values for one image block in the direction normal to ridge flow. After that, the ratio of each block is computed and average value of the ratio is obtained over the whole image.
4.5 Analysis of Parameter Values
Analysis of ridge-valley was carried out by setting the parameter value in oily, dry, and neutral fingerprint images based on the clarity score and the ridge-valley thickness ratio of ridge-valley, which have been calculated as in Section 4.3 and in the first paragraph of Section 4.4. Once the parameter values, namely, a local clarity score (LCS), a global clarity score (GCS), and ridge-valley thickness ratio (RVTR) of the fingerprint image 568 are obtained, the average of each parameter is calculated, then the maximum value and the minimum value of parameters are computed. These values will be used to determine the value of upper bound and lower bound of the range to each of the parameters (oily, neutral, and dry) as in equations (11)-(15).
\[Val_{\max} = Max(Val_{par}) \tag{11}\]
\[Val_{\min} = Min(Val_{par}) \tag{12}\]
\[Val_{mid} = \frac{Val_{\max} + Val_{\min}}{2} \tag{13}\]
\[Dist_{top} = \frac{Val_{\max} + Val_{mid}}{2} \tag{14}\]
\[Dist_{bot} = \frac{Val_{\min} + Val_{mid}}{2} \tag{15}\] where:
= LCS, GCS, and RVTR parameters. par
= parameter values of fingerprint images (568 images).
\(Val_{max}\) = maximum values of the average parameters (LCS, GCS, and RVTR).
\(Val_{min}\) = minimum values of the average parameters (LCS, GCS, and RVTR).
\(Val_{mid}\) = medium values of the average parameters (LCS, GCS, and RVTR).
\(Dist_{top}\) = upper limit values of the parameters (LCS, GCS, and RVTR).
\(Dist_{bot} = lower limit values of the parameters (LCS, GCS, and RVTR).\)
5 Experiment Results
Experiment results of the calculation from Sections 4.1 to 4.5 are shown in Figures 9 - 17 and Table 1.
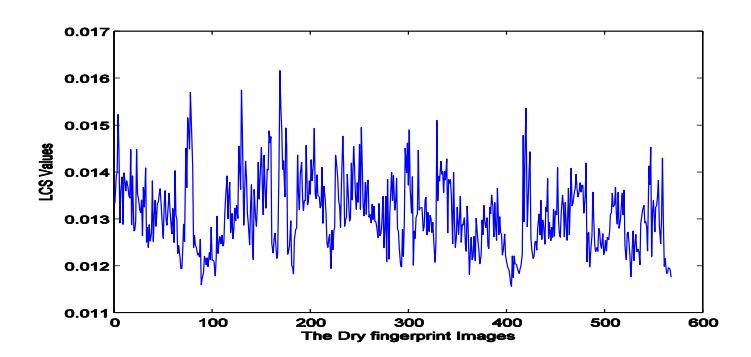
Figure 9 LCS values of the dry fingerprint images.
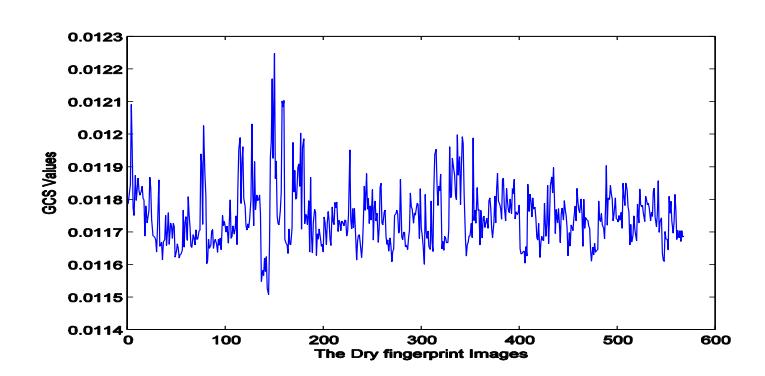
Figure 10 GCS values of the dry fingerprint images.
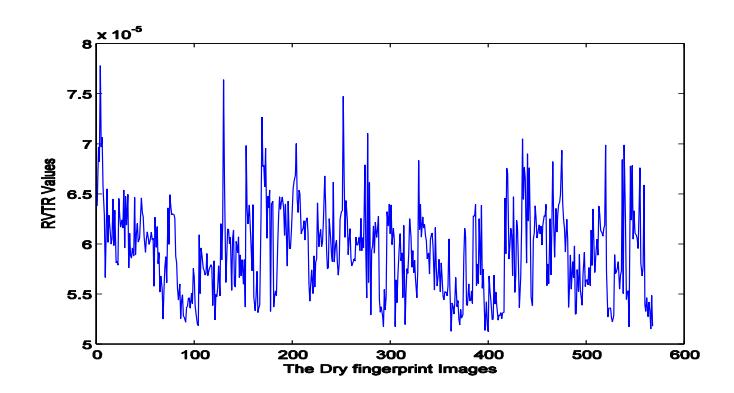
Figure 11 RVTR values of the dry fingerprint images.
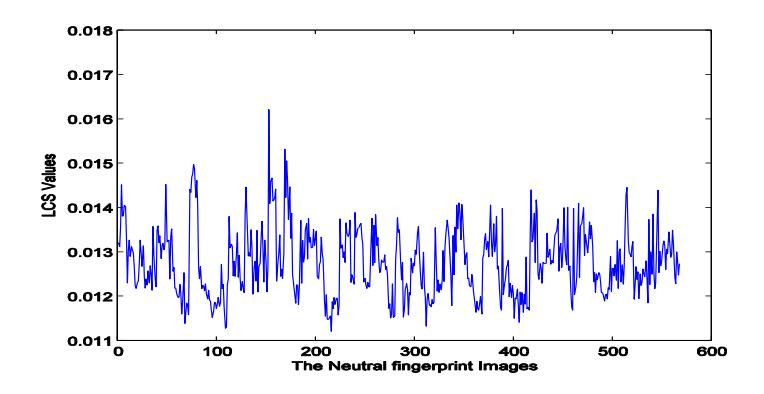
Figure 12 LCS values of the neutral fingerprint images.
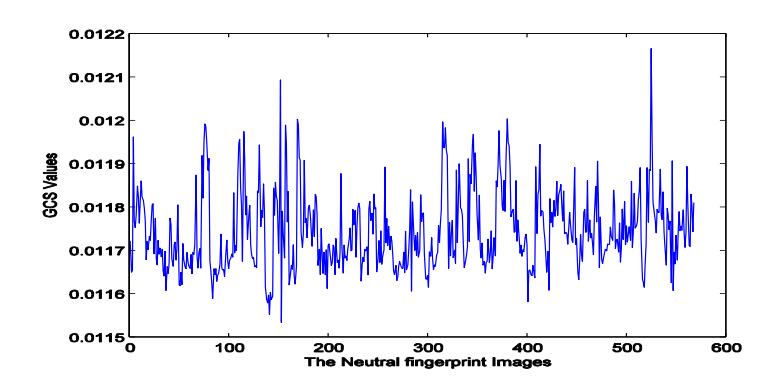
Figure 13 GCS values of the neutral fingerprint images.
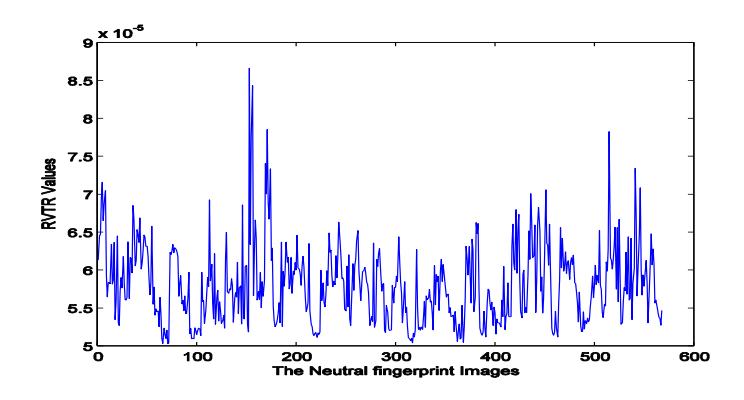
Figure 14 RVTR values of the neutral fingerprint images.
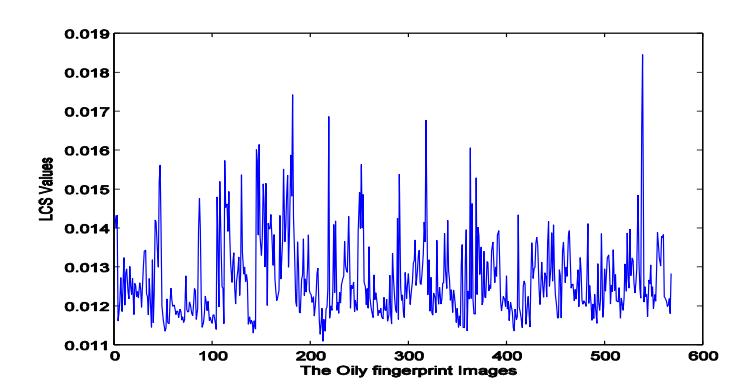
Figure 15 LCS values of the oily fingerprint images.
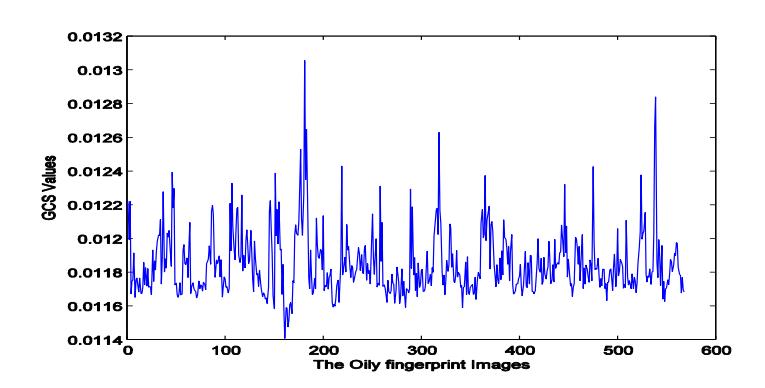
Figure 16 GCS values of the oily fingerprint images.
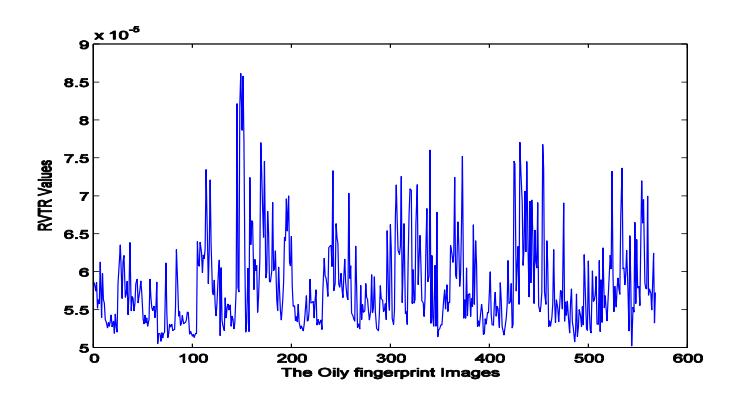
Figure 17 RVTR values of the oily fingerprint images.
| Table 1 | Experiment results of the distortion parameter values of the fingerprint |
|---|---|
| images. |
| Dry Parameter Values | Neutral Parameter Values | Oily Parameter Values | |||||||
|---|---|---|---|---|---|---|---|---|---|
| LCS | GCS | RVTR | LCS | GCS | RVTR | LCS | GCS | RVTR | |
| Valmax | 0.0167 | 0.0123 | 7.78E-05 | 0.0162 | 0.0122 | 8.66E-05 | 0.0184 | 0.0130 | 8.61E-05 |
| Distop | 0.0150 | 0.0121 | 7.11E-05 | 0.0149 | 0.0120 | 7.75E-05 | 0.0166 | 0.0126 | 7.71E-05 |
| Valmid | 0.0137 | 0.0119 | 6.45E-05 | 0.0137 | 0.0118 | 6.85E-05 | 0.0147 | 0.0122 | 6.82E-05 |
| Disbot | 0.0127 | 0.0117 | 5.79E-05 | 0.0124 | 0.0116 | 5.94E-05 | 0.0129 | 0.0118 | 5.92E-05 |
| Valmin | 0.0117 | 0.0115 | 5.13E-05 | 0.0112 | 0.0115 | 5.03E-05 | 0.0110 | 0.0114 | 5.02E-05 |
Tables 2 - 7 show the interpretation of the distortion parameters (LCS, GCS, and RVTR) values of the dry, neutral, and oily fingerprint images.
Table 2 Interpretation of the distortion parameter values of the dry fingerprint based on clarity scores.
| Clarity Scores | |||
|---|---|---|---|
| LCS | GCS | Quality | |
| LCS<0.0127 | GCS<0.0117 | Tend to be drier | |
| 0.0127≤LCS<0.0150 | 0.0117≤GCS<0.0121 | Dry | |
| LCS>0.0150 | GCS>0.0121 | Tend to neutral | |
Table 3 Interpretation of the distortion parameter values of the dry fingerprint based on RVTR.
| RVTR | Quality |
|---|---|
| RVTR<5.79E-05 | Tend to be drier |
| 5.79E-05≤RVTR<7.11E-05 | Dry |
| RVTR>7.11E-05 | Tend to neutral |
Table 4 Interpretation of the distortion parameter values of the neutral fingerprint based on clarity scores.
| Clarity Score | |||
|---|---|---|---|
| LCS | GCS | Quality | |
| LCS<0.0124 | GCS<0.0116 | Tend to dry | |
| 0.0124≤LCS<0.0149 | 0.0116≤GCS<0.0120 | Neutral | |
| LCS>0.0149 | GCS>0.0120 | Tend to oily | |
Table 5 Interpretation of the distortion parameter values of the neutral fingerprint based on RVTR.
| RVTR | Quality |
|---|---|
| RVTR<5.94E-05 | Tend to dry |
| 5.94E-05≤RVTR<7.75E-05 | Neutral |
| RVTR>7.75E-05 | Tend to oily |
Table 6 Interpretation of the distortion parameter values of the oily fingerprint based on clarity scores.
| Clarity Score | ||
|---|---|---|
| LCS | GCS | Quality |
| LCS<0.0129 | GCS<0.0118 | Tend to neutral |
| 0.0129≤LCS<0.0166 | 0.0118≤GCS<0.0126 | Oily |
| LCS>0.0166 | GCS>0.0126 | Tend to be oily |
Table 7 Interpretation of the distortion parameter values of the oily fingerprint based on RVTR.
| RVTR | Quality |
|---|---|
| RVTR<5.92E-05 | Tend to neutral |
| 5.92E-05≤RVTR<7.71E-05 | Oily |
| RVTR>7.71E-05 | Tend to be oily |
The representation of the information from Tables 1 - 6 can be illustrated in Figures 18, 19 and 20.
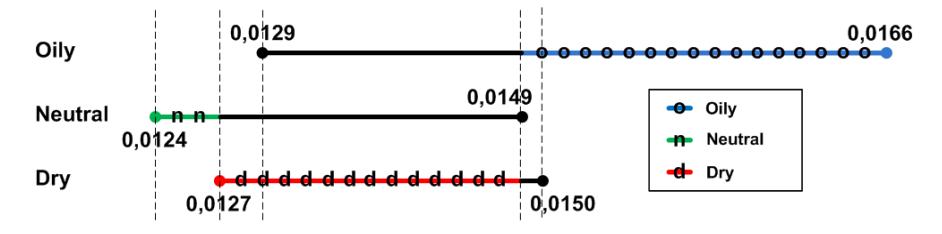
Figure 18 The illustration for determining of the LCS parameter values.
Figure 18 shows that the distortion parameter values of fingerprint images based on the quality analysis of image LCS are as follows: dry parameter values 0.0127-0.0149, neutral parameter values are less than 0.0127, and oily parameter values are greater than 0.0149.
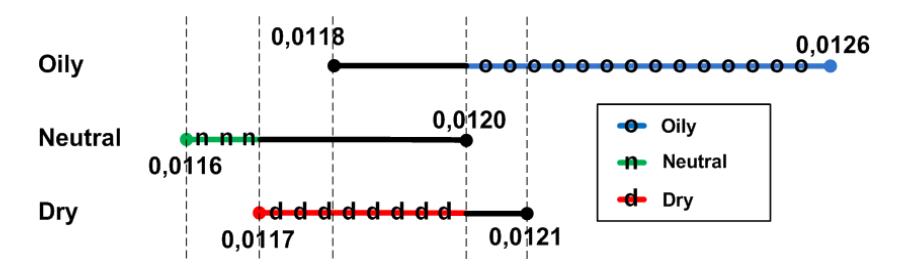
Figure 19 The illustration for determining of the GCS parameter values.
Figure 19 shows that the distortion parameter values of fingerprint images based on the quality analysis of image GCS are as follows: dry parameter values 0.0117-0.0120, neutral parameter values are less than 0.0117, and oily parameter values is greater than 0.0120.
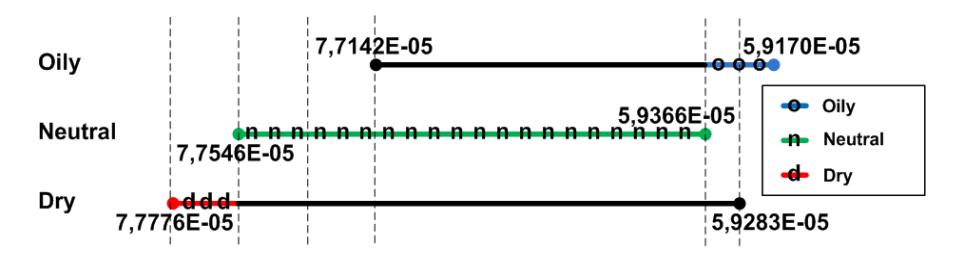
Figure 20 The illustration for determining of the RVTR parameter values.
Figure 20 shows that the distortion parameter values of fingerprint images based on the quality analysis of image RVTR are as follows: dry parameter values are less than 7.75E-05, neutral parameter values are 7.75E-05-5.94E-05, and oily parameter values are greater than 5.94E-05.
6 Conclusions
In this paper, a method of computing fingerprint images quality has been presented. Ridge-valley clarity analysis and ridge-valley thickness ratio analysis were used as indicators to determine the standard value of acquisition distortion of the fingerprint images based on the quality of fingerprint images. Ridgevalley clarity analysis, which examines the overlapping region of the distribution of ridge and valley, indicates the ridge clarity.
Based on the experiment results, it can be concluded that the standard value of acquisition distortion of the fingerprint images based on the image quality have values of a local clarity score (LCS) as follows: dry parameter values are 0.0127-0.0149, neutral parameter values are less than 0.0127, and oily parameter values are greater than 0.0149; a global clarity score (GCS) are as follows: dry parameter values are 0.0117-0.0120, neutral parameter values are less than 0.0117, and oily parameter values are greater than 0.0120; and ridgevalley thickness ratio (RVTR) are as follows: dry parameter values are less than 7.75E-05, neutral parameter values are 7.75E-05-5.94E-05, and oily parameter values are greater than 5.94E-05.