
1 Introduction
Thresholding is a very critical process in digital image processing areas. In some applications, gray level images should be thresholded as binary images, before measuring any statistical properties. Binary image is an image with pixel value of either 0 or 1. We can observe image thresholding as the most simple segmentation process. Various image thresholding methods have been proposed. Bimodal thresholding technique was introduced by Otsu [1] and unimodal thresholding [2] by Kosin. Algorithm introduced in [1] is the most famous method and widely used in many areas and applications including Matlab. Image thresholding approach using fuzzy system method is also commonly developed [3-5].
Variations of new thresholding technique that are better and more stable [6] are proposed. However, there are some disturbing factors like image vagueness and bad illumination resulting to unsatisfied image thresholding result. Recently, many researchers introduce new thresholding method based on fuzzy sets theory to solve these problems [3-5]. Fuzzy sets theory is comprehensively described in [7].
Thresholding techniques based on fuzzy theory have been developed to significantly reduce grayness ambiguity and vagueness during threshold selection process because they are a nonlinear knowledge-based method. Ultrafuzziness measurement is a new thresholding method that place thresholding process as type II fuzzy sets. Type II fuzzy set is proposed to improve type I fuzzy set weakness [3,8]. Type II fuzzy set also has an ability to get more additional information in thresholding [9]. The robustness of this method has been proved in [10] when calculating threshold in prostate ultrasound images. These arguments show that ultrafuzziness is superior to conduct image thresholding. However for images with high vagueness, low level contrast, and grayscale ambiguity, we need to further optimize ultrafuzziness so as to decrease the uncertainty.
In this paper, we proposed an algorithm for thresholding image using ultrafuzziness optimization to decrease uncertainty in fuzzy system by common fuzzy sets like type II fuzzy sets. Optimization was conducted by involving ultrafuzziness measurement for background and object fuzzy sets separately. Experiments with low contrast images including dental panoramic radiographs are provided to show robustness of the proposed method. Thresholding algorithm is very useful for segmenting dental images into several objects for further analysis [11].
Measure of fuzziness is explained in Section 2. In Section 3, type II fuzzy sets and the proposed thresholding method are described. Next, more detailed image thresholding algorithm using ultrafuzziness optimization is explained in Section 4. Experimental results of the proposed method and conclusion are discussed in Sections 5 and 6, respectively.
2 Fuzziness Measurement
Measure of fuzziness expresses difficulty level in determination whether an element or data will be a member or not in specified fuzzy sets. Hence, the highest difficulty level is achieved when degree of member has grade 0.5. Measurement of fuzziness visualization can be seen in Figure 1.
The smooth membership function shows high ambiguity level and the sharp one shows low level of ambiguity. A flat membership function indicates high vagueness image and yields in difficulty of thresholding process. This problem can be solved using fuzziness measurement [3]. Commonly used measure of fuzziness is linear index of fuzziness. For M x N image subset A X with L gray levels g [0, L - 1], the histogram h(g) and the membership function µX(g), the linear index of fuzziness l can be defined as follows:
\[\gamma_l(A) = \frac{2}{MN} \sum_{g=0}^{L-1} h(g) x \min [\mu_A(g), 1 - \mu_A(g)].\] (1)
3 Type II Fuzzy Sets
Type II fuzzy sets concept is firstly introduced by Zadeh [12]as an extension of common fuzzy set, type I fuzzy sets as shown in Figure 2 [12]. Type II fuzzy sets are designed by making membership function in three dimension where each element in type II fuzzy sets has membership value in range [0,1]. The third dimension is an extension and adds degrees of freedom to
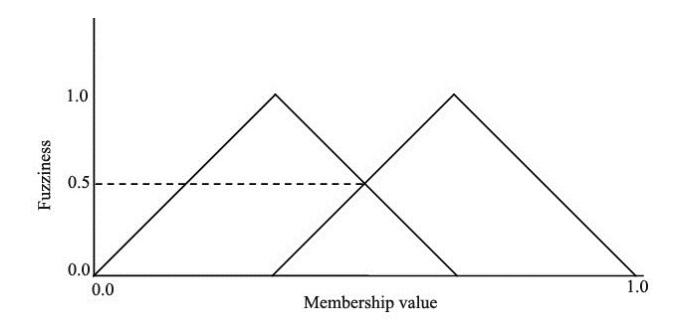
Figure 1 Measure of fuzziness representation.
get more information in representing fuzzy sets. Type II fuzzy sets are very useful when there is a difficulty in determining appropriate membership function for a fuzzy set and problem related with ambiguity.
Figure 2 shows the main difference between both types in the membership function in which type II fuzzy set forms boundary values that are defined as the lower and upper membership functions. Both functions define the upper and lower membership values of each value of horizontal axis.
Type II fuzzy sets have a not sure membership value or named "fuzzy". Membership value in type II fuzzy sets can be any value in range [0,1]. This membership principal is called primary membership. Related with each primary membership, there is a secondary membership (also has a value in range [0,1]). Figure 3 shows the visualization of type II fuzzy sets [8].
Horizontal axis x in Figure 3 shows main variable as member of fuzzy set, axis of u shows primary membership value, and the vertical axis shows secondary membership for each primary membership or called amplitude. Type II fuzzy sets can be written in:
\[\widetilde{A} = \{ ((x, u), \mu_{\widetilde{A}}(x, u)) | \forall x \in X, \forall u \in J_x \subseteq [0, 1] \},\] (2)
where \(0 \le \mu_{\widetilde{A}}(x,u) \le 1\). Notation \(\widetilde{A}\) can be written as:
\[\widetilde{A} = \int_{x \in X} \int_{u \in J_X} \mu_{\widetilde{A}}(x, u) / (x, u) \quad J_x \subseteq [0, 1]\] (3)
Where \(\iint\) denotes the union over all x and u. For discrete set, \(\int\) can be replaced with \(\sum\) .
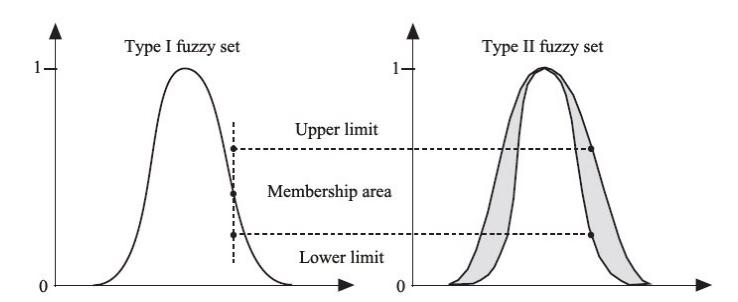
Figure 2 Type II fuzzy set reconstruction and type I fuzzy set.
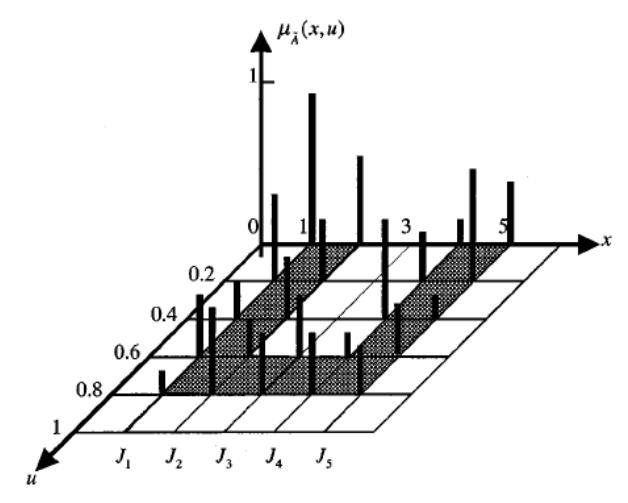
Figure 3 Type II fuzzy sets representation.
Illustrating type II fuzzy sets membership function in three dimensional spaces is not as easy as illustrating type I fuzzy sets membership function in two dimensions. Therefore, another way to visualize type II fuzzy sets is by illustrating them in two dimensional domains that is well known as footprint of uncertainty (FOU) [8]. FOU area can be viewed in the right side of Figure 2 where secondary membership area is marked with gray color. FOU illustrates uncertainty area in primary membership fuzzy sets. FOU can be made as reference to measure ambiguity level in a fuzzy set. Larger FOU area means higher ambiguity level in fuzzy sets and vice versa.
3.1 Measure of Ultrafuzziness
If we assumed an image or threshold value as type II fuzzy sets, then how ultrafuzzy is a fuzzy sets. If membership value degree in a fuzzy set can be determined clearly and without ambiguity, then ultrafuzzy value is zero. When membership value for each member can be only stated as interval value, the ultrafuzziness total value will increase [3].
Using previous concept [3], measure of ultrafuzziness \(\widetilde{\gamma}\) for image subset \(A \subseteq X\) with L gray levels \(g \in [0, L-1]\), the histogram h(g) and the membership function \(\mu_{\widetilde{\chi}}(g)\) can be written in (4).
\[\widetilde{\gamma}(\widetilde{A}) = \frac{1}{MN} \sum_{g=0}^{L-1} h(g) x \left[ \mu_U(g) - \mu_L(g) \right], \tag{4}\] where:
\[\mu_U(g) = \left[\mu_A(g)\right]^{1/\alpha},\tag{5}\]
\[\mu_I(g) = \left[\mu_A(g)\right]^{\alpha}, \alpha \in [1, 2]. \tag{6}\]
In this paper, measure of ultrafuzziness written in equation (4), (5), and (6) is optimized by including ultrafuzziness measure for background and object fuzzy sets separately. Furthermore, natural number, e, is added to increase measurement accuracy. Optimized ultrafuzziness measurement can be stated in:
\[\widetilde{\gamma}_{B}(\widetilde{A}) = \frac{1}{MN} \sum_{g=0}^{L-1} h(g) x e^{(\mu_{UB}(g) - \mu_{LB}(g))}, \tag{7}\]
\[\widetilde{\gamma}_O(\widetilde{A}) = \frac{1}{MN} \sum_{g=0}^{L-1} h(g) x e^{(\mu_{UO}(g) - \mu_{LO}(g))}.\] (8)
After ultrafuzziness for object fuzzy set and background fuzzy set is measured, total value of ultrafuzziness from both object and background can be measured too. Using this method, significant difference between object and background
fuzzy set is achieved. Therefore, one can obtain optimal thresholding between object and background [5]. Measurement of difference between both fuzzy sets is conducted by multiplying ultrafuzziness value from object fuzzy set and background fuzzy set. This method is written as follow:
\[\widetilde{\gamma}_{Total}(\widetilde{A}) = \widetilde{\gamma}_{R}(\widetilde{A}) \times \widetilde{\gamma}_{O}(\widetilde{A}). \tag{9}\]
4 The Proposed Method
General algorithm for thresholding an image based on type II fuzzy sets and measurement of ultrafuzziness is defined as follows:
- (1) Choose type of membership function to determine membership value \(\mu(g)\) and initialize value to \(\alpha\). In this paper, we use two membership functions representing object fuzzy set and background fuzzy set, respectively.
- (2) Compute histogram of the image.
- (3) Determine an initial position of membership function.
- (4) Shift membership function along gray level range to calculate fuzziness total in each position as shown in Figure 4. The maximum fuzziness total indicates the optimal threshold value.
- (5) Compute the upper and lower membership value, \(\mu_u(g)\) and \(\mu_L(g)\) in each position.
- (6) Calculate ultrafuzziness value for object fuzzy set and background fuzzy set
- (7) Compute ultrafuzziness total value among both values.
- (8) Find position \(g_{opt}\), which has maximum ultrafuzziness total value.
- (9) Threshold image using \(T = g_{opt}\).
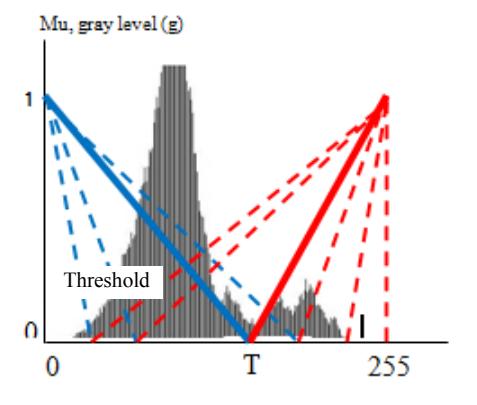
Figure 4 Two membership functions are shifted along graylevel value.
5 Experimental Results
Implementation of the proposed method is tested using mandible images. These images are acquired with x-ray and part of dental panoramic radiograph as shown in Figure 6. The experiment compares the use of some linguistic hedges parameters and several membership function types.
To evaluate the performance of image thresholding using ultrafuzziness optimization based on type II fuzzy sets, black and white image is manually created using Photoshop software and used as ground truth image to be measurement standard. A method to measure performance, \(\eta\), is used to compare each ground truth image with threshold image using type I and type II fuzzy sets. Measurement of thresholding performance can be defined in (10).
\[\eta = 100 \times \frac{\left|Bo \cap B_T\right| + \left|Fo \cap F_T\right|}{\left|Bo\right| + \left|Fo\right|}.\] (10)
\(B_o\) dan \(F_o\) show background and foreground from manually thresholded image, respectively. \(B_T\) and \(F_T\) is pixel region that belong to background and foreground of output image from thresholding process using certain method. Result of measurement is shown in the form of percent (%). The higher value from performance measurement (close to 100%), the better method performance and output image become well thresholded too.
This experiment uses two image sets. There are eight images in first image set and 16 images in another set. In this paper, image set I is experiment image used in [3]. Image set I and manually thresholded images are shown in Figure 5. In the first column of Figure 5, from top to bottom is black, rad, stone, potat, and fleck. Next, in third column from top to bottom are zimba, shadow, rice, text, and news. Second and fourth columns are image thresholding result in first and third columns, respectively.
Image set II are cropped images from dental panoramic radiographs commonly used in medical analysis to help doctor or medical expert to get various information related with human body. Dental panoramic radiograph used in this experiment consist of four 3158 x 1744 pixels images. Figure 6 shows image set II used in this experiment.
From each dental panoramic image, four 256 x 256 pixels region of interests are cropped. Then, thresholding is applied to each region of interest. So, there are 16 images used in thresholding process. Dental panoramic radiograph is used to test proposed method performance with image that has high ambiguity and vagueness.
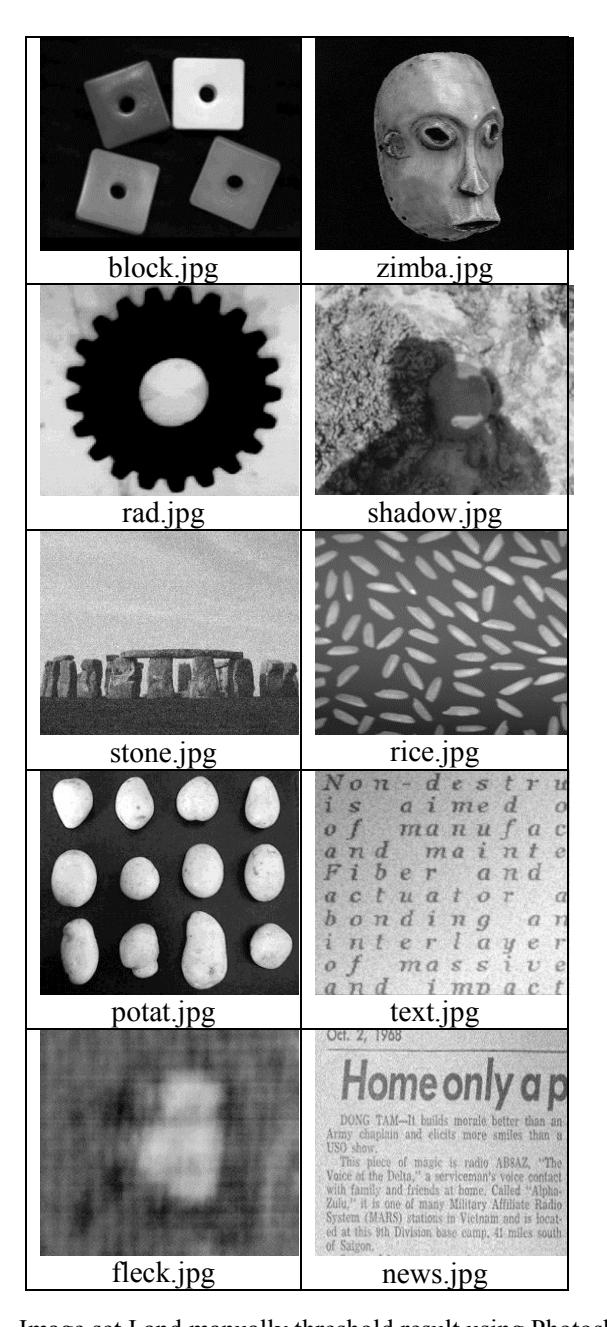
Figure 5 Image set I and manually threshold result using Photoshop.
Linguistic hedges parameter that has the best performance means value for image set I is 3 as stated in Table 1. For various linguistic hedges value, trapezoidal membership function has high performance means value for image set I as shown in Table 2.
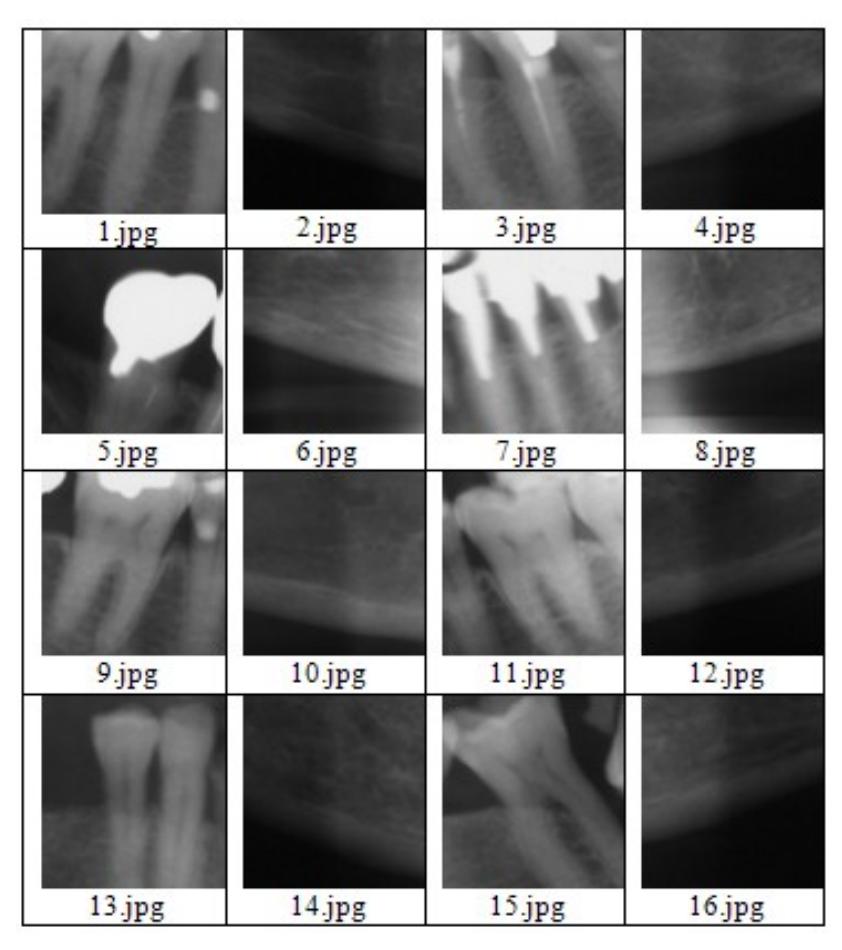
Figure 6 Image set II.
Using this membership function, performance value tends to increase. Figure 7 shows thresholded image for image set I using ultrafuzziness optimization based on type II fuzzy sets. Performance of the proposed method is compared with other thresholding methods like type I, Otsu, and Kittler. Comparison of performance from these methods can be viewed in Table 3. From this table, it can be concluded that thresholding method using ultrafuzziness optimization based on type II fuzzy sets is better than other thresholding methods with performance mean value = 94.7%.
Table 1 Measurement Result Of Performance Value For Image Set I Based On Linguistic Hedges Parameter.
| Linguistic hedges parameter | ||||||
|---|---|---|---|---|---|---|
| Image | α = 1 | α = 2 | α = 3 | α = 10 | α = 25 | |
| block.jpg | 44.1 | 98.3 | 98.4 | 98.9 | 99.1 | |
| zimba.jpg | 36.3 | 98.4 | 98.7 | 99.1 | 99.4 | |
| rad.jpg | 92.2 | 78.8 | 79.4 | 85.6 | 86.3 | |
| shadow.jpg | 64.3 | 92.4 | 92.2 | 91.7 | 89.9 | |
| stone.jpg | 63.5 | 97.7 | 97.3 | 96.9 | 98.1 | |
| rice.jpg | 33.4 | 95.7 | 95.7 | 98.0 | 99.0 | |
| potat.jpg | 36.2 | 99.8 | 99.6 | 98.9 | 99.1 | |
| text.jpg | 86.8 | 13.3 | 86.4 | 70.6 | 64.0 | |
| fleck.jpg | 13.7 | 98.2 | 98.1 | 98.3 | 76.1 | |
| news.jpg | 78.4 | 93.5 | 93.5 | 93.3 | 83.3 | |
| Mean | 54.9 | 86.6 | 93.9 | 93.1 | 89.4 | |
Table 4 shows performance calculation for image set II based on linguistic hedges parameter. Linguistic hedges parameter that has the best performance means value for image set I is 2.
Comparison of thresholding performance for image set II based membership function used is shown in Table 5. For various linguistic hedges value, triangular membership function has high performance means value for image set II. The highest value of performance, 84.2%, is achieved when linguistic hedges parameter (α) = 2. Figure 8 shows output image for image set II using ultrafuzziness optimization based on type II fuzzy sets.
Comparison of the proposed method performance with Otsu method is conducted to performance value of each image in image set II as shown in Table 4. The highest performance value for the proposed method is 99.3%. The performance value from Otsu method is obtained from experiment and the proposed method performance value is shown in Table 4 with α = 2.
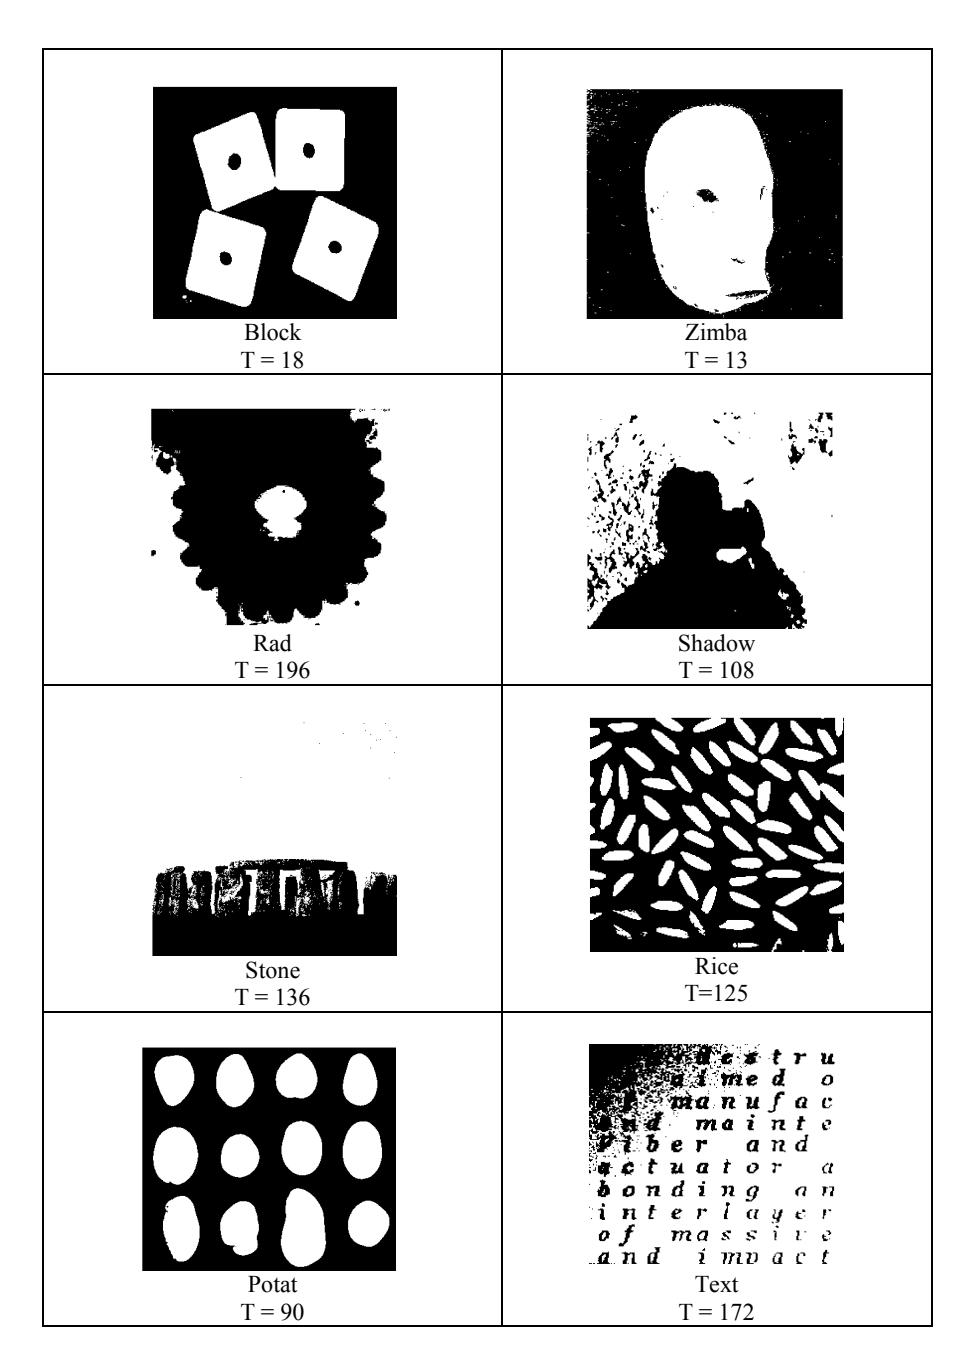
Figure 7 Thresholding result of image set I using α = 3 (continued).
Figure 7 (continue) Thresholding result of image set I using α = 3.
Table 2 Comparison of Thresholding Performance for Image Set I Based On Membership Function.
| Linguistic hedges | Membership function | ||||
|---|---|---|---|---|---|
| parameter | Triangular | Trapezoidal | Z and S | ||
| α = 1 | 54.9 | 54.9 | 54.9 | ||
| α = 2 | 86.6 | 90.5 | 93.9 | ||
| α = 3 | 93.9 | 94.6 | 93.9 | ||
| α = 10 | 93.2 | 94.3 | 92.1 | ||
| α = 25 | 89.4 | 92.3 | 91.2 | ||
Table 3 Comparison Performances On Image Set I.
| Image | Type I fuzzy sets | Otsu | Type II fuzzy sets | Kittle r |
|---|---|---|---|---|
| Block.jpg | 71.2 | 94.3 | 98.7 | 98.4 |
| Zimba.jpg | 86.3 | 97.9 | 99.1 | 98.9 |
| Rad.jpg | 64.5 | 98.1 | 96.5 | 92.2 |
| Shadow.jpg | 75.8 | 90.6 | 92.1 | 78.3 |
| Stone.jpg | 39.9 | 95.9 | 96.5 | 81.1 |
| Rice.jpg | 99.9 | 94.3 | 92.5 | 93.4 |
| Potat.jpg | 98.9 | 98.0 | 98.9 | 99.2 |
| Text.jpg | 36.4 | 77.3 | 88.8 | 90.0 |
| Fleck.jpg | 92.6 | 96.3 | 95.5 | 96.8 |
| News.jpg | 93.7 | 99.0 | 88.1 | 96.3 |
| Mean | 75.9 | 94.1 | 94.7 | 92.5 |
Table 4 Comparison Performances on Image Set II.
| Linguistic hedges parameter | Thresholding | ||||||
|---|---|---|---|---|---|---|---|
| Image | α = 1 | α = 2 | α = 3 | α = 10 | α = 25 | Otsu | Type II fuzzy sets |
| 1.jpg | 96.0 | 95.9 | 12.7 | 63.2 | 56.0 | 56.0 | 95.9 |
| 2.jpg | 66.9 | 97.7 | 97.7 | 98.9 | 99.9 | 98.2 | 97.7 |
| 3.jpg | 97.6 | 14.5 | 56.8 | 54.6 | 54.6 | 16.2 | 14.5 |
| 4.jpg | 58.3 | 99.3 | 99.0 | 98.7 | 99.3 | 99.6 | 99.3 |
| 5.jpg | 68.8 | 79.3 | 79.3 | 55.5 | 56.5 | 59.3 | 79.3 |
| 6.jpg | 70.7 | 98.0 | 97.5 | 93.9 | 92.9 | 73.5 | 98.0 |
| 7.jpg | 85.9 | 38.7 | 39.4 | 40.4 | 43.1 | 51.0 | 38.7 |
| 8.jpg | 76.4 | 97.8 | 98.3 | 99.4 | 96.8 | 56.5 | 97.8 |
| 9.jpg | 92.0 | 92.1 | 71.3 | 64.8 | 62.9 | 24.1 | 92.1 |
| 10.jpg | 87.5 | 99.2 | 99.2 | 99.9 | 58.2 | 98.8 | 99.2 |
| 11.jpg | 92.7 | 87.4 | 64.8 | 64.2 | 63.6 | 59.2 | 87.4 |
| 12.jpg | 70.9 | 98.9 | 99.2 | 99.5 | 99.7 | 94.0 | 98.9 |
| 13.jpg | 71.8 | 69.2 | 69.9 | 81.9 | 71.6 | 74.1 | 69.2 |
| 14.jpg | 77.9 | 98.1 | 98.1 | 99.5 | 66.5 | 93.9 | 98.1 |
| 15.jpg | 78.5 | 85.8 | 85.9 | 65.1 | 66.5 | 58.9 | 85.8 |
| 16.jpg | 62.5 | 97.8 | 98.6 | 99.9 | 99.3 | 73.6 | 97.8 |
| Mean | 78.4 | 84.4 | 79.2 | 79.9 | 74.2 | 67.9 | 84.4 |
Table 5 Comparison of Thresholding Performance for Image Set II Based on Membership Function.
| Linguistic | Membership function | |||||
|---|---|---|---|---|---|---|
| hedges parameter | Triangular | Trapezoidal | Z dan S | |||
| α = 1 | 78.4 | 78.4 | 78.4 | |||
| α = 2 | 84.3 | 49.1 | 78.2 | |||
| α = 3 | 79.2 | 63.2 | 78.3 | |||
| α = 10 | 79.9 | 71.7 | 79.7 | |||
| α = 25 | 74.2 | 76.5 | 78.6 | |||
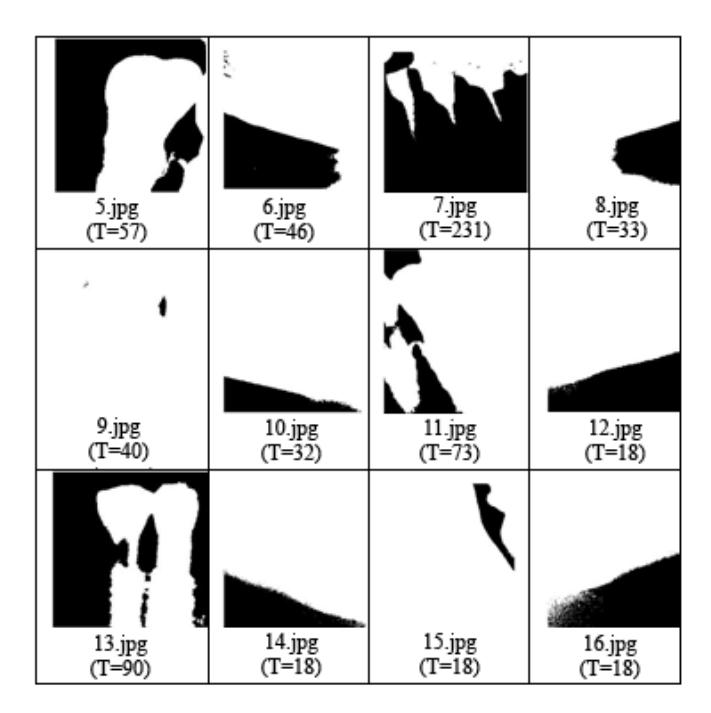
Figure 8 Thresholding result of image set II using α = 2.
Based on the performance values of both the proposed method and the Otsu method, it can be concluded that image thresholding using ultrafuzziness optimization is better than the Otsu method. As illustrated in Table 4, the performance means value of the proposed method is higher than the Otsu method.
6 Conclusions
Thresholding performance gets the optimal result for image set I when linguistic hedges parameter value is 3. Furthermore, from experimental results for image set II, we can observe that linguistic hedges parameter value with optimal performance for thresholding process is 2. The performance of image thresholding using ultrafuzziness optimization based on type II fuzzy sets is proved to be more optimal when compared with type I fuzzy sets thresholding.
Other experimental results based on membership function parameter for image set I show that trapezoidal membership function has optimal performance. On the other hand, from experiment using membership function parameter used in proposed method for image set II, triangular membership function give optimal performance.
From all experiments scenario above, we can conclude that the proposed image thresholding method has good performance for image that has high vagueness, low level contrast, and grayscale ambiguity as commonly found in dental panoramic radiograph.
Further research is needed to improve the proposed method. Improvement of better membership function design will greatly contribute to get better thresholding method. Moreover, it is necessary to study the influence of linguistic hedges parameter to image with certain characteristic. Measurement of ultrafuzziness formula can also be improved.