
1 Introduction
Key logging attacks have been, and continue to be, a major security concern in traditional computing platforms. PC operating systems like Windows allow system message interception, thereby enabling background applications to capture and log the key strokes of active applications in the foreground. Such Trojan applications are very common in traditional PCs, and although usually called keyloggers, many are capable of capturing more information than mere keyboard input, such as screenshots and mouse clicks. Even when keyloggers are not easy to install or hide, hardware keyboards allow for backdoor channels that could be resorted to in order to guess the actual input. Such channels are commonly termed side channels, and include physical phenomena like electromagnetic and acoustics emanations.
Moving to smartphones, the situation is quite different. Smartphone OSes, like Android, restrict the interception of keystrokes to the current view that has the focus, and no direct method can be used by Trojan apps to log user taps (but for a workaround example, see [1]). Moreover, the lack of physical keyboards limits side channel avenues at the disposal of attackers. For instance, the rich heritage of research on electromagnetic and acoustic emanations is not applicable on smartphones. Yet, innovative side channels to sniff on user input have been proposed in the literature, including the analysis of finger smudges left on the touch screen surface [2], employing the dial tone sounds [3] that resembles more traditional acoustic emanations attacks, and even the old-school low-tech shoulder-surfing [4].
Embedding sensors into smartphones had made them an unprecedented platform, combining communications, computing and sensing capabilities. User interface, gaming, and healthcare are but a few domains in which sensors found instant applications [5], and a key idea around which many more applications evolve is context awareness. On the flip side, sensors bring along many serious implications, especially related to user privacy. Researchers have studied the potential threat of more traditional sensors, namely, GPS, camera and recorder, on user privacy and/or security (e.g. [6]). Less traditional sensors, such as motion sensors (e.g. accelerometers and gyroscopes), have received little attention, until recently. The key observation that moved motion sensors into the threat spot is the correlation between user taps on touch screen and vibrations or motion changes to the body of the smartphone itself. Accelerometers, for example, can sense the linear acceleration caused by the force of user taps, while gyroscopes can measure angular velocities around specific axes. Obviously, the original benign purpose of theses sensors are far from such vicious uses and that makes them a surreptitious side channels.
Few authors in academia have demonstrated the feasibility of such a side channel attack, dealing with the task as a classification problem to map sensors reading into key labels. Section 3 presents a brief survey of these works. The availability of several sensors on consumers electronics devices, in particular smartphones, raises a seemingly interesting question of which sensor, or collection of sensors thereof, is of greater potential in the context of the new threat. In this paper, we set off to experiment with the performance of different sensors that are supported by Android operating system, and integrated in most Android-powered phones. Section 2 explains shortly the considered sensors, and how it is possible to capture their data with Android help. For the purpose of the comparison, we actually implemented the attack collecting sensors data through an Android app. Details of the experiment are given in section 4.
It is important to notice that the aim of this paper is not to improve the accuracy of the attack, or evaluate its practicality, but is more about comparing the performance of sensors under the same conditions, which are well-controlled. Our experiment in this light could focus on the relative performance between different datasets on the same setting, rather than looking for the best among several settings. The latter is the focus of most recent works discussed in section 3, while the early works were concerned with the bare feasibility of the attack.
2 Technical background
Android supports a variety of sensors, of which the relevant to the current attack are motion and position sensors. Table 1 lists the supported motion sensors, as of Android 4.2.2. Besides those sensors, Android also provides a synthetic sensor based on the values from the accelerometer and magnetometer, through a method call in its sensors API (getOrientation()). Accelerometer raw data contains both gravity acceleration (due to the earth's gravity force) and linear acceleration (due to the linear motion of the phone body). The former is more of a bias to our experiment as we do not consider here the inclination of the phone with respect to the earth surface, and therefore both raw accelerometer's data as well as gravity sensor's data are excluded, as the linear accelerometer can take their role.
Table 1 Motion sensors that are supported on Android platforms (source [7]).
| Sensor | Description | Units of measurement |
|---|---|---|
| TYPE_ACCELEROMETER | Acceleration force along the x, y and z axes (including gravity). | m/s2 |
| TYPE_GRAVITY | Force of gravity along the x, y and z axes | m/s2 |
| TYPE_LINEAR_ACCELEROMETER | Acceleration force along the x, y and z axes (excluding gravity). | m/s2 |
| TYPE_GYROSCOPE | Rate of rotation around the x, y and z axes | rad/s |
| TYPE_ROTATION_VECTOR | Rotation vector component along the x, y and z axes (axis * sin (θ/2)). | Unit-less |
Motion sensor readings are expressed with reference to a 3-axis coordinate system. This coordinate system is defined relative to the device's screen when the device is held in its default orientation (Figure 1): the x axis is horizontal and points to the right, the y axis is vertical and points up, and the z axis points toward the outside of the screen face. This coordinate system is not with reference to the earth's frame, and hence does not change irrespective of the device orientation. For example, if the phone is laid horizontally on a table with its screen surface to the sky, a motion towards the left would generate negative readings along the x axis. If the phone is lifted horizontally, the z axis's readings are positive.
Android OS provides a sensors programming framework, composing a set of classes and interfaces that could be used to access the sensors and read their raw data. Basic tasks accomplished by that API include detection of available sensors on a device, determining their capabilities (e.g., maximum range, power requirements, and resolution), reading raw sensor data, defining the minimum rate at which to acquire sensor data, and to register/unregister sensor event listeners that monitor sensor changes.
Figure 1 Coordinate system of the motion sensors.
Sensor values are obtained through an object, SensorEvent, in a multidimensional array named values[]. Elements of the array correspond to sensor readings along each of the three coordinate axes. For example, values[0] might convey the acceleration force along the x axis while values[1] contains the acceleration force along the y axis, and so forth. Acceleration forces reflect the change in velocity along the axes due to user motion (e.g. walking) or due to direct user input (e.g. tapping on the device). Raw acceleration data, represented by the accelerometer sensor includes the acceleration due to gravity force. Android provides also filtered linear acceleration that can be formulated as
Linear acceleration = raw acceleration – gravity acceleration
Theoretically, accelerometer data could be integrated twice to obtain the distance of motion. However, the result of this process is prone to much error in practice, which leaves very little benefit considering the tiny differences in displacement of different keys on the touch screen. It could also be argued that displacement is proportional to the force by which the user taps on the device, the same as the acceleration itself, and therefore there is really no specific value in taking the additional double integration step. The tilt of the device, however, is another path to consider, utilizing the accelerometer, which we leave for future work.
Gyroscope readings reflect the rate of rotation (i.e. angular velocity) around the three axes, and ideally measure zero when the device is at rest. Again, it is possible to calculate the angle of rotation via integrating the gyroscope data. Similar argument to the case of accelerometers could be made, though we actually consider this option in one of our experiments. Gyroscopes data are known to suffer from a drift in the reported values when integrated, because of the accumulated measurement errors over time (i.e. noise plus initial offset). Typically, data from other sensors are utilized to compensate for such errors. In our case, a keystroke on the device is short enough to justify neglecting accumulated drift and compute the integration of just the few readings during a single keystroke anew with each tap.
The rotation vector represents the orientation of the device as a combination of an angle and an axis, in which the device has rotated through an angle θ around an axis (x, y, or z) [7]. It is a synthetic sensor that maps the device coordinate system to the global coordinate system using the accelerometer, magnetometer, and the gyroscope. In the global coordinate system, the x axis points to the east, the y axis points to the north, while the z axis points to the sky away from the surface of the earth.
Finally, Android also provides a method called getOrientation() that takes as input a rotation matrix. The rotation matrix might be generated using data from both the accelerometer and the magnetometer. The output of the getOrientation() method is the rotation around the x (pitch), y (roll), and z (yaw) axes. The coordinate system of this method is similar to the global coordinate system described in the previous paragraph, except that the x and z axes are inverted. However, it is worthy to mention that nearby magnets can largely affect magnetometer data, leading to less accurate results.
3 Related work
Authors in [8] suggested first the use of motion sensors to infer keystrokes on touch screens. They developed an Android application, named TouchLogger, to demonstrate the attack. The application used numbers-only soft keypad in the landscape mode. TouchLogger utilized the synthetic Orientation sensor, which relies on accelerometer and magnetometer hardware sensors. Orientation sensor was deprecated in Android 2.2 (API level 8).
Following was another work [9], where an Android application, ACCessory, was built to evaluate a predictive model, trained only on acceleration measurements. ACCessory attempted to infer area zones on the screen as well as character sequences (to construct typed passwords).
The next work [10] adopted an online processing, where the training and classification were performed on the smartphone itself through a Trojan application ,TapLogger, to stealthily monitor the movement changes of the device and try to log the number pad passwords and screen lock PINs. Two sensors were used: the accelerometer for taps detection, and the Orientation sensor for tap positions inference.
The same authors of TouchLogger published another work again [11]. The purpose of the study was to provide a more thorough investigation on the practicality of such an attack, and to compare the performance of different classification schemes, and the impact of different devices, screen dimensions, keyboard layouts or keyboard types. This paper examined the use of gyroscopes output on mobile devices for the attack, and indicated that inference based on the gyroscope is more accurate than that based on the accelerometer.
TapPrints [12], the framework presented in another paper was evaluated across several platforms including different operating systems (iOS and Android) and form factors (smartphones and tablets). It also showed a combined approach that uses both the accelerometer and gyroscope for achieving better accuracy. Finally, and most recently, the authors of [13] focused solely on the accelerometer sensor to further investigate the practicality of sensors side channels in inferring Android four-digit PINs and password pattern (swiping). Contrary to previous last two works, they found that accelerometer based techniques perform nearly as well, or better, than gyroscopic based techniques.
To the best of our knowledge, no previous study addressed the relative performance of all relevant Android sensors in conducting the inference attack. In addition, we also consider fusing the data from more than one sensor for that matter. In a preliminary version of our study, we started by evaluating sensors performance on only a single Android smartphone [14]. In this paper, we augment the analysis with sensors from another more recent device, and include more variations in the data preprocessing and fusion options, as well as in the feature set of the sensors data.
4 Methodology
Keystrokes inference can be viewed as a machine learning problem, in particular, a classification task that maps collected patterns of raw sensor signals data into corresponding key classes. Abiding by typical machine learning process sequence, raw data are collected from the source, and pre-processed, and then features are selected. Part of the resulting dataset is labeled with the correct class to form a training examples subset, and the rest is reserved for evaluation purposes as a test subset. In the following subsections we present those steps in more detail.
| Sensor | Name | Min delay (μs) | vendor | ||
|---|---|---|---|---|---|
| Phone Samsun Galaxy S. | Samsun | ROTATION_VECTOR | MPL rotation vector | 10000 | Invensense Technology |
| Galaxy S2 | LINEAR_ACCELEROMETER | MPLlinearaccl | 10000 | Invensense Technology | |
| Model | GT-I9100G | GYROSCOPE | MPU3050 Gyroscope sensor | 10000 | Invensense Technology |
| Android version 4.0.3 | 4.0.2 | ACCELEROMETER | KXTF93-axis Accelerometer | 10000 | Kionix Corporation |
| MAGNETIC_FIELD | AK8975 Magnetic field sensor | 10000 | Asahi Kasei Microdevices | ||
| Sensor | Name | Min delay (μs) | vendor | ||
| Phone | Samsun | ROTATION_VECTOR | iNemoEngine Rotation_Vector | 10000 | STMicroelectronics |
| Galaxy S3 | LINEAR_ACCELEROMETER | iNemoEngine Linear Acceleration | 10000 | STMicroelectronics | |
| Model | GT-19300 | GYROSCOPE | LSM330DLC Gyroscope sensor | 5000 | STMicroelectronics |
| Android version | 4.1.2 | ACCELEROMETER | LSM330DLC 3-axis Accelerometer | 10000 | STMicroelectronics |
| MAGNETIC_FIELD | AK8975 Magnetic field sensor | 10000 | Asahi Kasei Microdevices |
(a)
Figure 2 Experiment settings (a) Hardware specs and (b) user typing profile.
4.1 Data Collection
An application was built for the purpose of acquiring sensors data out of an Android smartphone. Our raw data are the readings of four sensors, two of which are synthetic sensors, derived from a combination of up to three hardware sensors, as noted in section 2. A set of two devices was used in the experiment: a Galaxy S2 and a Galaxy S3, both are of different screen sizes and sensors specs. One user was utilized to type all data sets to ensure consistent typing and holding style factors that could affect the inference performance. Figure 2(a) lists the main hardware specifications of the devices and their built-in sensors, while Figure 2(b) shows the typing profile of the user throughout the experiment.
The UI of the application, depicted in Figure 3, allows for the selection of the sensor in each session, and a layout similar to the dialing soft keypad of Android 4.0.3 is presented to the user, where he was asked to key in almost the same set of around 300 keys in each session. The key set covers uniformly the ten digits of the numbers soft keypad. For each device, two datasets were generated from the same linear accelerometer, but distinct by the use of high pass filtering, an option that the user can choose by selecting a checkbox on the screen. Filtering is one of the common techniques to mitigate noise in sensors data, and in that context, low pass filters are more useful. However, high pass filters can extract the most fluctuating components, in which we are more interested. The interface also includes an option for fusing the data, upon which all four sensors are registered with Android, and the readings from all sensors are recorded in the same session. This is useful to inspect the case when the feature vector of a dataset example comprises components from different sensors together.
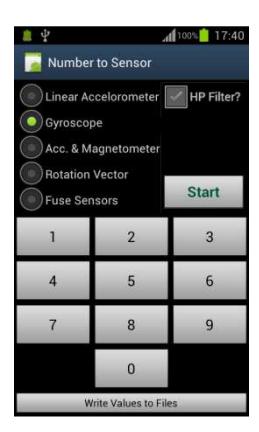
Figure 3 User Interface of the Android app used to collect the data.
4.2 Pre-processing
Raw sensors data usually need to be processed before feeding into a learning system. One of the most important steps in the context of the current attack is the detection, and extraction of the signal segments that correspond to key strokes from the continuous stream of sensors reading. This step could form a separate research task, and several approaches might be followed. Some of the previous works on this attack regard this task as a straightforward anomaly detection problem [9], or a simple classification problem [12], while others treat it as a significant part of their whole system [10]. Figure 4 illustrates the signals collected from the gyroscope and the accelerometer along the x, y and z axes while dialing the phone number "0123034880" using the screen shown in Figure 3. It could be seen from the distinct spikes corresponding to the individual key taps, that the task of isolating keystrokes is conceivably doable. Yet, some authors leave this step as a separate undertaking that lies on the shoulder of the attacker, and assumes knowledge of the keystrokes delimitations [13]. We followed the same suit, as the course of extracting this knowledge is independent of the eventual performance, assuming consistency among all datasets. We isolated the keystrokes sensors data by matching their timestamps to the start and end time of each button click event, which we also collect during the experiment using Android-provided motion events, namely the "onTouch" method. This method was implemented as per the onTouchListener interface requirement. It is these events that supply the experiment with the labels necessary for the training examples.
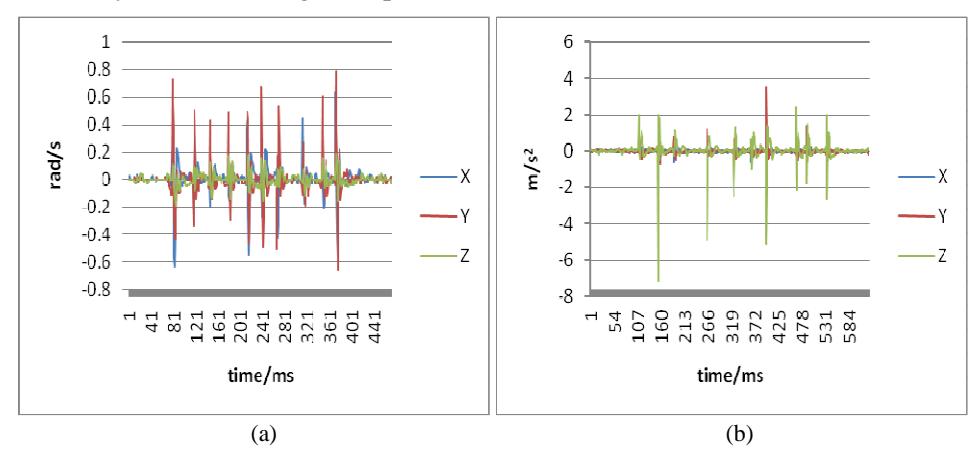
Figure 4 Readings from the (a) gyroscope and (b) accelerometer while dialing the number "0123034880".
Other pre-processing techniques are also possible and usually crucial for successful learning, including normalization and calibration. Normalization is needed when different features of input data belong to different scales of several
order of magnitude discrepancies. Rescaling might be necessary to ensure that no single feature has influence that may not reflect their real relative importance in deciding the outcome. In our case, all sensors reading in all three axes are of the same or only one order of magnitude variance. Calibration is usually also needed, for example, to remove the projection of Earth gravity from accelerometer data and initial orientation from gyroscope data. Using the linear accelerometer in our experiment ensures the already gravity-less acceleration measurements, while initial bias in other sensors are not of much concern since the whole experiment is conducted under the exact same conditions, including any initial biases.
In our data sets we have encountered no missing values, as we have collected all the data ourselves programmatically. Very few outliers could be seen, probably because of abrupt unintended motion of the user hands. We simply got rid of those outliers, as they play no representative role in the input data. We also did not need any dimensionality reduction techniques, as our data are already of relatively low dimension (18, in most cases, except when applying sensors fusion, where every sensor contributes 18 features, and when integrating gyroscope data, where three more features, the derived rotation angles along the three axes, are added).
Another significant pre-processing we applied, besides keystrokes extraction, is the aggregation of sensors data by each key, as explained in the next section, to create the features. Some works in the literature had to normalize the sampling rate of sensors, termed de-jittering in [11], to compensate for non-uniform sensors sample intervals. However, this is basically needed for the purpose of standard signal analysis methods, whereas our features are mainly simple statistics that use aggregation of few samples per each key, as discussed later, and no de-jittering was applied.
Finally, we also included the option of integrating the gyroscope data before training. The purpose is to experiment with the gyroscopic data as a source on angular displacement rather than angular speed. Taken as a rate of change in angular shift, gyroscope data could be integrated based on basic calculus to obtain the distance traveled, in this case the shift angle. Despite the fact that integration often introduces drift to the gyroscope readings, we neglect this error as the integration is performed for each set of readings associated with one keystroke. In this way, we ensure a sort of reset action per every key tap, and the time intervals to accumulate noise errors are very short.
4.3 Feature Selection
For the purpose of classification, the input dataset is a set of examples. Each example is a features vector (collection of features or attributes), which is fed to the classifier and mapped collectively to a pre-set output label (a digit key, in our case). Previous works on the keystrokes inference attack vary greatly in the set of features employed for classification, and there is no obvious evidence of which set is better, indicating an open research area in this direction. For our experiment, we have chosen to apply simple statistics on sensors data from the time domain only, though some authors include also frequency domain signal features.
The output of our application is a set of files, each recording a continuous stream of readings from one sensor, or the combination of sensors in case of data fusion. In addition, one file always contains the touch events information, namely the start time, end time, and the particular tapped key. For each sensor, there is a corresponding output file in every session. This file contains all the collected sensor's readings during the session, a reading per line. Each sample reading is a quadruple, {x, y, z, t} for the sensor's output along the three axes, plus a timestamp in milliseconds. Likewise, in every respective session, the other file records each touch event (a keystroke) with the corresponding interval in milliseconds. One touch event normally spans several sensor samples. In our experiment, a key tap takes on average 80 ms, and the sampling rate of the sensors is, at most, 100 samples per second in theory, except for the gyroscope in Galaxy S3 phone, where the minimum delay is around 5000 microsecond, which represents a frequency of 200 samples per second. This means around 10 samples per key in the best case, excluding the case of the STMicroelectronics gyroscope where the available samples per key are more, and hence the expected performance is better in general. In practice, however, we found that each key corresponds to an average of 5 sensor samples (15 samples for Galaxy S3 gyroscope).
Individual samples are meaningless relative to a key tap, and so we aggregate the samples for each key, i.e. combine all the samples that span the period of a key tap producing simple standard statistics of min, max, mean (µ), median (M), standard deviation (σ) and skewness (3*(µ–M)/σ). In this manner, for a dataset of 300 keys, for instance, we obtain 300 examples, each of which comprises 18 features, plus the class label (the key symbol itself). Each example is written to a line in a CSV file, which is used as the final input dataset for the learning process. All the motion sensors generate three components of the physical quantity they measure; one component along each of the three coordinates axes. Therefore, out of the six statistics the result is 18 different values where each statistic is computed for every axis. For instance, one
example in the training dataset would comprise the attributes XminA, YminA, ZminA, XmaxA, YmaxA, ZmaxA, XmeanA, and so forth. The first letter in the attribute name refers to the axis to which the feature value belongs, and the last letter refers to the sensor from which the dataset was driven. In the case of this example, the sensor is the accelerometer. The middle part of the attribute name tells the particular statistic constituting the feature. The last attribute would be the particular keystroke for which the time interval matched the interval of the aggregated sensor data. Note that every keystroke spans several sensor readings. In our dataset, each value is taken to be a feature to characterize a keystroke.
The aggregation could be accomplished using any programming language or computational package (e.g. MATLAB or Octave), though we have written simple scripts in the R language to match sensors and key data, and perform the statistical calculations. Figure 5 shows one of those scripts for the accelerometer data, where the steps of aggregating sensors data and producing the features are detailed.
- 1. key <- read.csv("itb/acctrue_10_11/key_10_11.csv")
- 2. acc <- read.csv("itb/acctrue_10_11/acctrue_10_11.csv")
- 3. keyAcc <- key;
- 4. for (i in 1:nrow(key)) {
- 5. keyAcc$XminA[i] <- min(acc$X[acc$Time >= key$DownTime[i] & acc$Time <= key$EventTime[i]]);
- 6. keyAcc$YminA[i] <- min(acc$Y[acc$Time >= key$DownTime[i] & acc$Time <= key$EventTime[i]]);
- 7. keyAcc$ZminA[i] <- min(acc$Z[acc$Time >= key$DownTime[i] & acc$Time <= key$EventTime[i]]);
- 8. keyAcc$XmaxA[i] <- max(acc$X[acc$Time >= key$DownTime[i] & acc$Time <= key$EventTime[i]]);
- 9. keyAcc$YmaxA[i] <- max(acc$Y[acc$Time >= key$DownTime[i] & acc$Time <= key$EventTime[i]]);
- 10. keyAcc$ZmaxA[i] <- max(acc$Z[acc$Time >= key$DownTime[i] & acc$Time <= key$EventTime[i]]);
- 11. keyAcc$XmeanA[i] <- mean(acc$X[acc$Time >= key$DownTime[i] & acc$Time <= key$EventTime[i]]);
- 12. keyAcc$YmeanA[i] <- mean(acc$Y[acc$Time >= key$DownTime[i] & acc$Time <= key$EventTime[i]]);
- 13. keyAcc$ZmeanA[i] <- mean(acc$Z[acc$Time >= key$DownTime[i] & acc$Time <= key$EventTime[i]]);
- 14. keyAcc$XmedianA[i] <- median(acc$X[acc$Time >= key$DownTime[i] & acc$Time <= key$EventTime[i]]);
Figure 5 An R script that aggregates accelerometer data and produces the features set.
- 15. keyAcc$YmedianA[i] <- median(acc$Y[acc$Time >= key$DownTime[i] & acc$Time <= key$EventTime[i]]);
- 16. keyAcc$ZmedianA[i] <- median(acc$Z[acc$Time >= key$DownTime[i] & acc$Time <= key$EventTime[i]]);
- 17. keyAcc$XsdA[i] <- sd(acc$X[acc$Time >= key$DownTime[i] & acc$Time <= key$EventTime[i]]);
- 18. keyAcc$YsdA[i] <- sd(acc$Y[acc$Time >= key$DownTime[i] & acc$Time <= key$EventTime[i]]);
- 19. keyAcc$ZsdA[i] <- sd(acc$Z[acc$Time >= key$DownTime[i] & acc$Time <= key$EventTime[i]]);
- 20. keyAcc$XskewA[i] <- 3*(mean(acc$X[acc$Time >= key$DownTime[i] & acc$Time <= key$EventTime[i]]) - median(acc$X[acc$Time >= key$DownTime[i] & acc$Time <= key$EventTime[i]])) / sd(acc$X[acc$Time >= key$DownTime[i] & acc$Time <= key$EventTime[i]]);
- 21. keyAcc$YskewA[i] <- 3*(mean(acc$Y[acc$Time >= key$DownTime[i] & acc$Time <= key$EventTime[i]]) - median(acc$Y[acc$Time >= key$DownTime[i] & acc$Time <= key$EventTime[i]])) / sd(acc$Y[acc$Time >= key$DownTime[i] & acc$Time <= key$EventTime[i]]);
- 22. keyAcc$ZskewA[i] <- 3*(mean(acc$Z[acc$Time >= key$DownTime[i] & acc$Time <= key$EventTime[i]]) - median(acc$Z[acc$Time >= key$DownTime[i] & acc$Time <= key$EventTime[i]])) / sd(acc$Z[acc$Time >= key$DownTime[i] & acc$Time <= key$EventTime[i]]);
- 23. }
- 24. write.table(keyAcc, "itb/acctrue_10_11/keyAcc_10_11.csv")
Figure 5 Continued. An R script that aggregates accelerometer data and produces the features set.
4.4 Classification
The goal of the inference attack is, given a bunch of sensors samples, to map every pattern of readings into an output class, and the percent of correct mapping forms the accuracy of the classifier. We adopted the implementation of classification algorithms in Weka suite of machine learning software [15]. Many classifiers are available in Weka, and choosing a particular method is not critical for our experiment. However, our initial exploration revealed that the ensemble learning can give better results, with implementations in "meta" Weka package. In particular, "Bagging" classifier showed the best performance on average (with FT base model), though we do not aim to venture any claims related to classification algorithms performances. "Bagging" is a general technique for improving the accuracy of a given learning algorithm. As an ensemble learning method, it aggregates multiple learned models of the same type (e.g. decision trees), and uses voting to combine the output of individual models [16].
5 Evaluation and Discussion
All experiment runs were conducted under 5-folds cross-validation testing option, and almost the same dataset size of around 300 examples. Figure 6 shows the results of classifying the datasets using Bagging ensemble learning, with Functional Trees base model [17]. Figure 6(a) depicts the comparative classification accuracy of all the sensors options in the first device, while Figure 6(b) presents the same results for the second device.
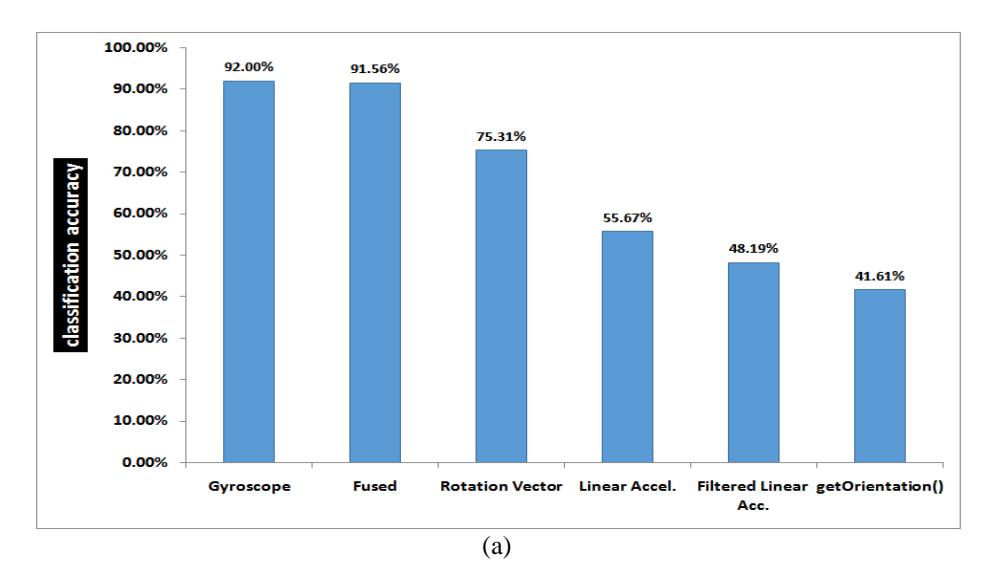
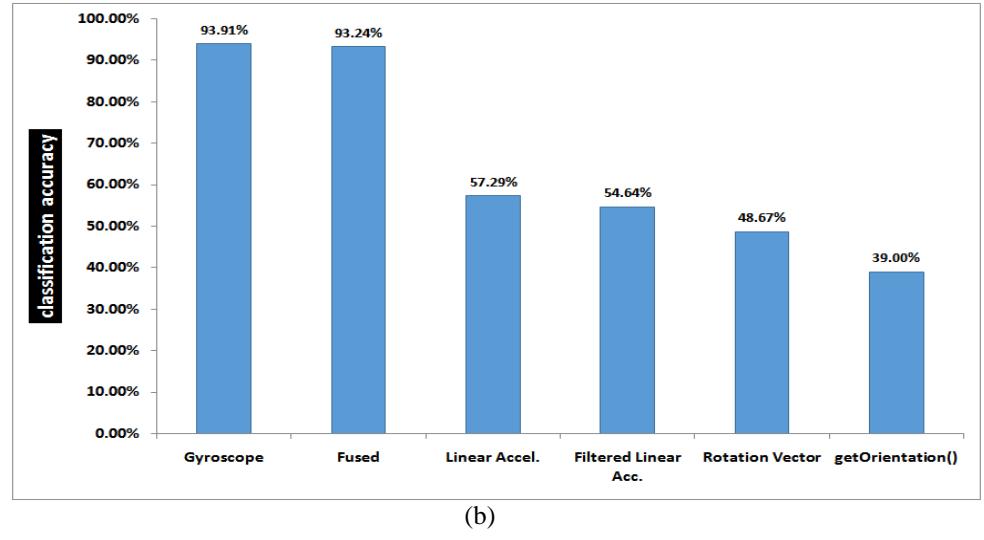
Figure 6 Experimental results: classification accuracy comparison among all sensors (a) in Galaxy S2 smartphone (b) in Galaxy S3 smartphone.
It is evident from the two graphs that the relative performances of the sensors in both devices are similar. Because of the larger screen size of Galaxy S3, one would expect better ability to classify different key zones. Nevertheless, its performance is comparable or inferior to that of Galaxy S2 (at least in the many runs of our experiments). One possible reason for this result is the observation that the S3 phone was dressed in a thick leather case, which might contribute to mitigate the impact of the taps force on the surface of the device.
Comparing the gyroscope performance with and without integrating its data reveals no actual value out of integration. The graphs in Figure 7 illustrate the accuracy of two experiments, for each of the two devices. One experiment involves a gyroscope dataset of 18 features as usual. The second experiment adds three more features, corresponding to the integrated sensor values per a coordinate axis. This conclusion seems logical, as the rate of change in distance (velocity) is proportional to the distance, and their indication is the same in the context of our need, namely to make a distinction between different areas on the screen. We have included the analysis of this option since gyroscope data is typically integrated in many applications, where the need is specifically to measure the inclination or tilt of the device over an extended period of usage time, rather than the instant change in angular displacement. It should be noted however that relying on the gyroscopic data for the purpose of classifying different keystrokes bears a strong dependency on the force by which the user taps on the screen, which might seem user or even session-dependent. Nonetheless, what makes this task conceivable is the fact that the angular velocity (the output of the gyroscope) is a vector quantity, and its sign depends on the direction of rotation, making separate areas in the coordinate space distinguishable, at least by the sign of the data.
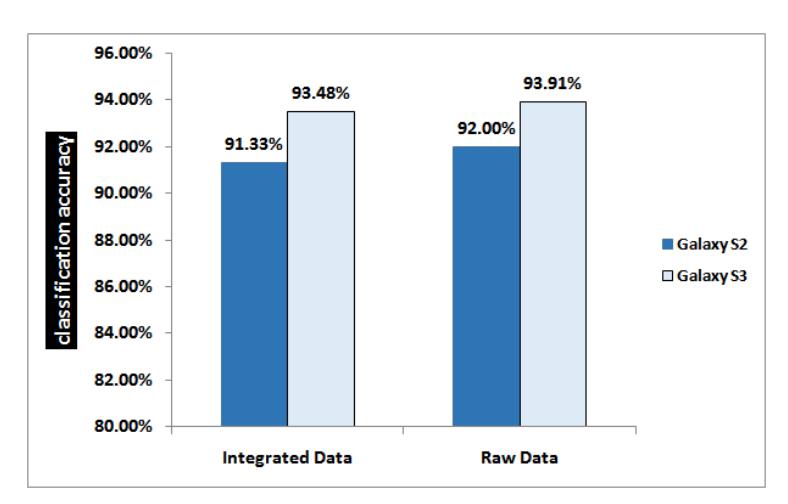
Figure 7 Classification accuracy of the gyroscope with and without integration.
Noticing the marked performance of the gyroscope, it looked appealing to further experiment with the features in its dataset. Trying out separate groups of statistics as well as few combinations of statistical groups resulted in the performance scores shown in Figure 8. For example, in the specific dataset of Figure 8, drawn from Galaxy S3 gyroscope, it appears that the minimum statistic has the most influence in the correct classification of keystrokes.
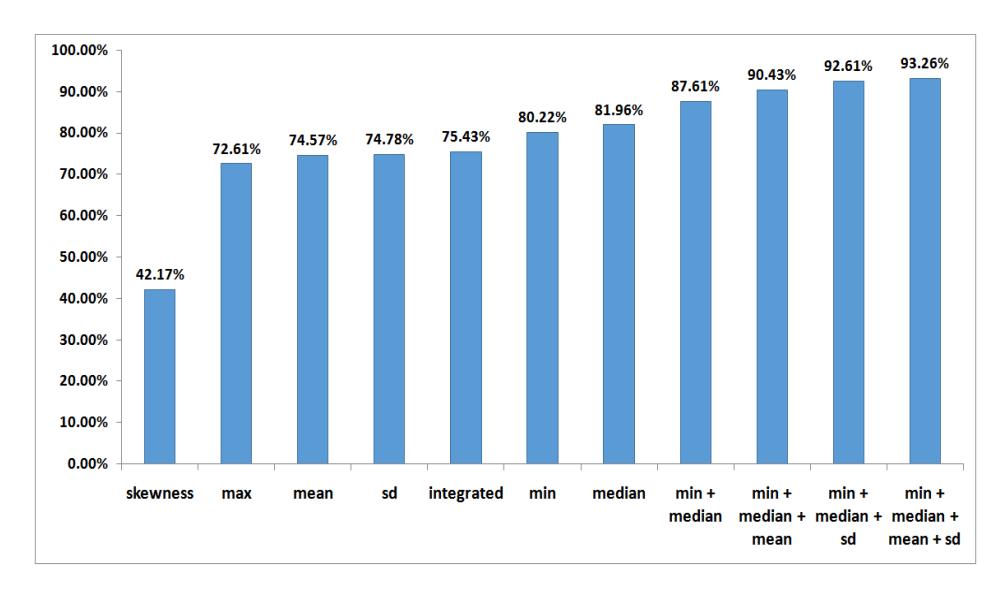
Figure 8 Classification accuracy of few permutations of gyroscopic statistics.
In another set of experiments, we focused on the fused dataset of sensors. In Table 2, we present one instance of those experiments where the relative performance of the individual sensors is shown more manifest, as well as the promising compounds of two sensors. The results are consistent with those in Figure 6, besides the important conclusion that in the context of this particular attack, data from other sensors are more of a noise to the gyroscopic signals. Still, in the absence of a gyroscope, the combination of accelerometer and rotation vector data can be of utility that outperforms their individual performances.
Several concluding notes are in order, based on the obtained results. It is obvious that, confirming to [11]-[12], the gyroscope sensor alone has a superior performance compared to all other sensors. This result is actually consistent with the observation that rotations have more power to distinguish between different keys than shifts. This is also the reason for the inferior accuracy of both accelerometer variations (with and without high pass filtering), and even the rotation vector which relies on the accelerometer as one of the components in deriving its value. Another factor that affects the rotation vector performance is the magnetic field sensor, which is also one of the components in calculating the vector values. Magnetic field sensors are known for their inaccurate and noisy outputs in current commodity smartphones, especially in the presence of nearby metals. What supports this conclusion is that the accuracy of the rotation vector sensor is still much better than the synthetic sensor that is based on the getOrientation method, though both depend on the accelerometer and magnetometer. The difference in accuracy is apparently due to the inclusion of gyroscope into the derivation of the rotation vector.
Table 2 Classification accuracy results of different combinations of sensors.
| Sensor | Samsung Galaxy S2 | Samsung Galaxy S3 |
|---|---|---|
| All sensors | 91.56% | 93.24% |
| Gyroscope only | 95.63% | 94.12% |
| Accelerometer only | 56.88% | 63.24% |
| Rotation vector only | 75.94% | 57.35% |
| Gyroscope + accelerometer | 93.44% | 93.53% |
| Accelerometer + rotation vector | 80.63% | 71.18% |
| Gyroscope + rotation vector | 92.19% | 93.53% |
It also seems that sensors fusion is not always the best option, and depends largely on the proper selection of the ingredient sensors. Filtering also depends on the context, and in our case, it appears that the already filtered linear accelerometer has less performance with more filtering; the high pass filter, despite more appropriate to extract occasional motion like keystrokes, could leave the classifier with less than enough information to discern different keys. Finally, it is important to note that all the results related to sensors' performances that we reported in this paper are associated with the application of keystroke inference attack, or similar applications that involve classification of sensors data into discernable zones on the touch screen. This might not be the case in more traditional applications; e.g. gaming or augmented reality.
It is worth mentioning that a key reason which makes this attack an attractive option from a perpetrator perspective is the low requirement for conducting the attack in terms of security permissions. Android does not impose special permissions to access the motion sensors. This means that any Trojan application with a convincing benign purpose has unlimited access to those sensors. This fact has driven many researchers to advocate the enforcement of more restrictions on sensors access through security permissions, similar to those required to access more traditional sensors like the camera and sound recorder.
6 Conclusions
Researchers have already started the study of the potential of integrated sensors on modern smartphones as a privacy threat. Otherwise useful in numerous benign applications, certain sensors could unwantedly reveal sensitive information related to the input of the user. Accelerometers and gyroscopes in particular, among other motion sensors, proved viable in tracking subtle (shakes) resulting from taps or keystrokes on the smartphone touch screen. Selecting the most appropriate sensor or combination of sensors, along with the right features, has much left to be researched. In this paper, we reviewed only a small set of the possible combinations of sensors data and their treatment in the implementation of the new keystrokes inference attack, specifically on Android platforms. The objective was to compare the relative performance of different built-in motion sensors, with respect to this attack.
Four sensors were compared in an experiment that implements the attack, namely, the linear accelerometer, gyroscope, rotation vector sensor, and the combined accelerometer and magnetometer synthetic sensor. Moreover, the option of fusing more than one sensor is examined. To enrich the discussion further, a couple of processing options for the accelerometer (filtering) and the gyroscope (integration) are considered. The results showed a greater benefit of exploiting the gyroscope sensor, or a fusion of several sensors (perhaps excluding the sensors with magnetometer component) from the perspective of an attacker. As discussed in the article, appealing processing in many other applications of sensors could fall short of serving the purpose of the attack.
For a future work, we vision an integrated solution that incorporates more advanced processing of the accelerometer and gyroscope readings to calculate the resulting tilt, rather than rate of change, of the user taps. Fusing the right balance of these two sensors in terms of features and preprocessing has the most promising performance, we believe, based on the current results.
Acknowledgements
This research is supported by the Ministry of Higher Education under research grant LRGS/TD/2011/UKM/ICT/02/02.