
1 Introduction
A MANET is a multi-hop ad-hoc network that consists of a set of independent mobile nodes and does not require any infrastructure for communication purposes. Since MANETs don't require any infrastructure and don't incur any extra costs, this type of network is best suited for temporary purposes like in case of a military emergency, a rescue scenario, a shopping mall scenario, an educational trip scenario and so on. It is a multi-hop type network because mobile nodes have a limited transmission range and thus have to rely on intermediate nodes. Therefore in a MANET each node acts as a router [1],[2].Routing is considered one of the most difficult tasks in MANETs due to the continuously changing network topology, which makes it very difficult to select a particular protocol. Although there are many approaches for routing, all
approaches differ based on the particular environment. Numerous studies have been carried out that focused on comparing protocols, but much less attention has been paid to other factors, such as packet size, node mobility, DSSS rate, mobility model and so on. Therefore, it is essential to find out how important these other factors are for the functioning of the network.
One of the key contributions to the wireless LAN standard was the addition of 802.11b at the physical layer level, which supported two new speeds –5.5 Mbps and 11 Mbps – in addition to 1 Mbps and 2 Mbps [3]. Direct sequence spread spectrum (DSSS), also known as direct sequence code division multiple access (DS-CDMA), is one of two approaches that are used to spread spectrum modulation for digital signal transmission over the airwaves. In other words, DSSS is a transmission technology that combines the user data signal with a bit sequence of a higher data rate, also known as the chipping code. According to the 802.11b standard there are four kinds of data rates: 1 Mbps, 2 Mbps, 5.5 Mbps and 11 Mbps transmission [4],[5].
The main benefits provided by DSSS Rate technology are:
- 1. Resistance to jamming
- 2. Reduced background noise
- 3. Use/sharing of a single channel among multiple users
- 4. Relative timing determination between transmitter and receiver
DYMO, or the dynamic MANET on-demand source routing protocol, is one of the most popular reactive, on-demand routing protocols. This protocol is basically a modification of the ad hoc on-demand distance vector (AODV) protocol and was standardized by the Internet Engineering Task Force in its sixth revision [6]. Although this protocol is a modification of AODV, the modification is not in terms of adding new features or extensions. Rather, things were simplified while keeping the same mode of basic operation. This protocol, like all other reactive protocols, has two modes of operation: route discovery and route maintenance. The working procedure is the same as that of other reactive protocols, i.e. the node that wants to send a packet discovers the route on demand and the route request message that is broadcasted throughout the network. Once the route has been selected and the packet has reached its destination, the route reply is received back from the destination by the source along with the path that the packet has traversed while reaching the destination [7]-[9].
Thus, in this study a performance analysis of the DYMO and the AODV routing protocols based on varying DSSS rates [4] and packet sizes was executed. The impact of a number of key factors, such as DSSS rate, routing protocol and packet size on end to end delay and average jitter, were evaluated based on simulation results using a factorial design technique. This study will help future researchers and scientists give priority to the most crucial factors in deploying a MANET.
2 Related work
Research related to MANETs has been done in several directions. Some studies focused on a comparison of routing protocols, specifically between proactive and reactive protocols. Others focused on analyzing the impact of different factors like mobility model, node mobility pause time, number of nodes on the network and so on.
In a paper by Geetha, et al. [10], the authors compare two key protocols– AODV and DSDV–and finally conclude that AODV is better than DSDV. Similarly, in a research paper by Manickam, et al. [11], the authors compare three protocols–DSR, AODV and DSDV–for the following parameters: packet delivery ratio, throughput and delay; they used an NS-2 simulator under varying network conditions. Kumar [12] analyzed proactive and reactive protocols using NS-2 under three network performance metrics, i.e. packet delivery ratio (or) fraction, throughput and drops of packets or packet loss ratio. In a recent paper by Ghani Ur Rehman, et al. [13], the authors compare the performance of two widely known ad-hoc routing protocols–AODV and DSR–in terms of packet delivery ratio, average end to end delay and routing overhead by changing the mobility; they used NS2 2.29 for simulation. In 2011 a performance study of broadcast protocols was carried out by Nand and Sharma using Qualnet, they used four performance indicators, i.e. throughput, PDR, delay and jitter [14].
The brief discussion above gives an idea regarding research work that has been done as to how routing protocols perform under different networking environments. As for the importance of network performance indicators, that is still a vast research area that has hardly been studied due to a lack of proper methodology. Apart from that, empirical results will have to provide us with an accurate insight regarding which factor is the most important rather than theoretical guesses and assumptions. From the abovementioned studies we can also conclude that, although routing protocols have been compared to each other with respect to performance, what has not been studied yet is how important the routing protocol is for a specific network performance indicator, how important the DSSS rate is, or how important other factors are, like packet size, mobility model and so on.
This research is the first of its kind, where the importance of factors with respect to network performance, particularly in MANETs, has been evaluated
mathematically using a factorial design technique. All previous researches based their conclusions on simulation results only and did not mention to what percentage (%) packet size, DSSS rate or routing protocol influence network performance indicators. Because our results were obtained in terms of percentages (%), this study will provide researchers a more precise way to analyze the effects of different factors on network performance. For this work, the simulation environment from the work of Nand and Sharma [14] was extended.
3 Methodology
In this research, the first step was to analyze two protocols—AODV and DYMO—under varying network conditions. Once the simulation results were obtained, the results were analyzed using a mathematical technique known as factorial design. A factorial design can consist of two factors or more, but they have discrete values at each level (1 or -1). This technique allows us to analyze the effect and interactions of each factor or combination of different factors for any particular variable, in our case: average end to end delay and average jitter [15], [16]. The equation for calculating the effect is:
\[SST = q^{2}A + q^{2}B + q^{2}C + q^{2}AB + q^{2}AC + q^{2}BC + q^{2}ABC\] (1)
where SST denotes the sum of square total [12]. In the formula written above, the symbol \(q_A\) represents the numerical values that will be obtained through simulation for the routing protocol factor, \(q_B\) represents the values for the DSSS rate factor and \(q_C\) represents the values for the packet size factor, as shown in Table 2. The rest of the symbols, like \(q_{AB}\), \(q_{AC}\), \(q_{ABC}\) and \(q_{BC}\), represent interactions among these different factors.
\[Effects = q_i Factors/SST\] (2)
Lastly, the final results were evaluated using Eq. (2). The symbol i represents different values of different rows belonging to the field and the field represents different letters like A, B, C, AB, ABC and so on. In our case, since we are investigating the effect of three factors, i.e. routing protocol, packet size and DSSS rate, we used a2<sup>k</sup> factor design technique, where k denotes the factors and each factor has two levels (1 and -1) and 2 denotes the number of levels [15].
4 Simulation Setup
The Qualnet 5.1 simulator [17] was used to analyze the DYMO protocol and the AODV protocol. For the analysis a UDP (user datagram protocol) connection was used and over it a CBR (constant bit rate) was applied between source and destination. Initially, the 100 nodes were placed uniformly. A random waypoint
mobility model with a maximum speed of 30 m/s was used in a rectangular field. Multiple CBR application was employed over 13 different source nodes and destinations nodes respectively. All the above parameters were applied under varying DSSS rates of 2Mbps or 5.5Mbps with respective packet sizes of 256 Bytes or 512 Bytes. The simulation parameters are shown in Table 1.
It must be noted that the two packet sizes (256 Bytes and 512 Bytes) and DSSS rates (2Mbps and 5.5Mbps) were taken only for the sake of evaluating how important the factors packet size and DSSS rate are along with the two protocols because factorial design requires two levels of each factor for giving appropriate results. There is no specific reason for taking the two packet sizes or DSSS rates.
Table 1 Simulation parameters.
| Simulation parameters | |
|---|---|
| No. of nodes | 100 |
| Speed of nodes | 30 m/s |
| Sender | 13 nodes(4,53,57,98,100,7,3,49,10,93,1,66,9) |
| Receiver | 13 nodes(5,91,94,59,60,95,27,97,100,54,33,31,92) |
| Mobility model for movement | Random waypoint |
| Area | 1500 * 1500 m |
| Protocols used | DYMO,AODV |
| DSSS Rate | 2 mbps /5.5 mbps |
| Packet size | 256,512 bytes |
| Number of packets | 2,4,5,10,15,20,25 |
| Simulated time | 300 seconds |
| Path loss model | Two-ray model |
| Physical layer Radio type | IEEE 802.11b |
| MAC protocol | IEEE 802.11 |
| Antenna Model | Omni-directional |
4.1 Performance Metrics
1. End to end delay: This parameter gives us the overall delay in time that the packets suffer while moving from source to destination across the network. It is a summation of all types of delays, including processing delays, queuing delays, propagation delays, and end-system-processing delays. Packets that get delayed longer than the required threshold value are effectively lost. This parameter is of utmost importance–higher values will largely affect throughput –and needs to be minimized always.
2. Average jitter: Jitter is a crucial network performance indicator as it directly affects the buffering requirements for all video devices and downstream networks. A higher value of jitter can lead to many problems, ranging from lip-sync errors to the loss of packets because of buffer overflow or underflow. Jitter is the variation/fluctuation of the end to end delay between two packets. The packet arrival time is supposed to be very low when calculating the jitter parameter. For better performance, the delay between packets must be lower than the required threshold value.
5 Results and Discussion
The performance of DYMO and AODV was analyzed with varying mobility speeds, traffic loads, packet sizes and DSSS rates using Qualnet 5.1.A snapshot of broadcasting, node mobility and data transmission is shown in Figure 1. The simulation results are shown in Figures 2 to 5 under respective DSSS rates of 2 and 5.5 Mbps with two different packet sizes.
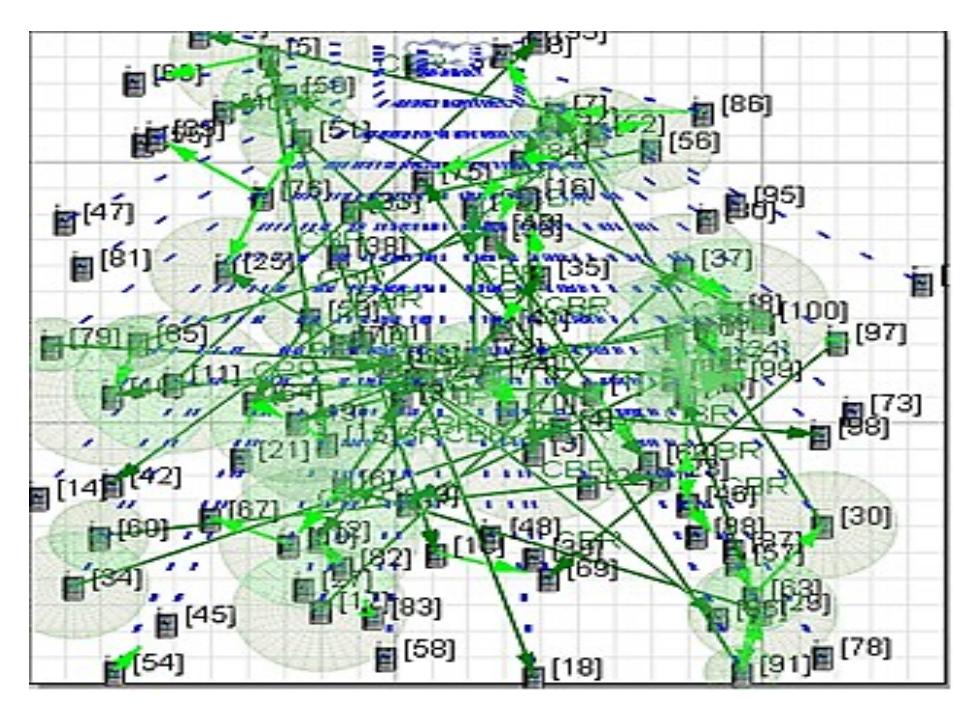
Figure 1 Animated view.
The numerical results are shown in Tables 3 to 4 under DSSS rates of 2 Mbps and 5.5 Mbps with two different packet sizes. Finally, all simulation results were evaluated using the 2 k factorial design technique, as shown in Table 5 and 6.
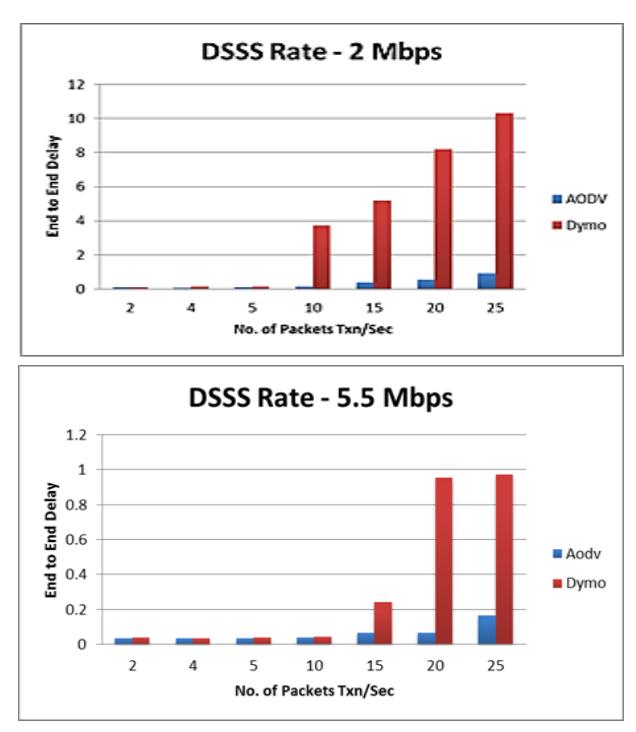
Figure 2 End to end delay (packet size 256 Bytes).
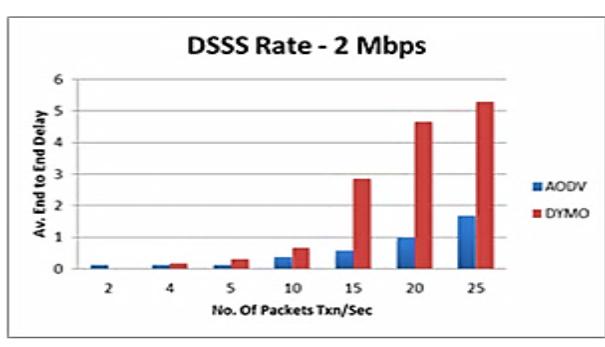
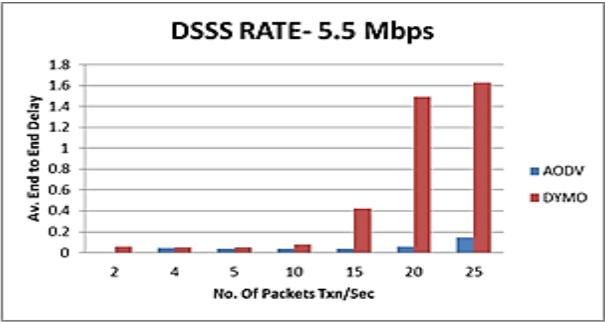
Figure 3 End to end delay (packet size 512 Bytes).
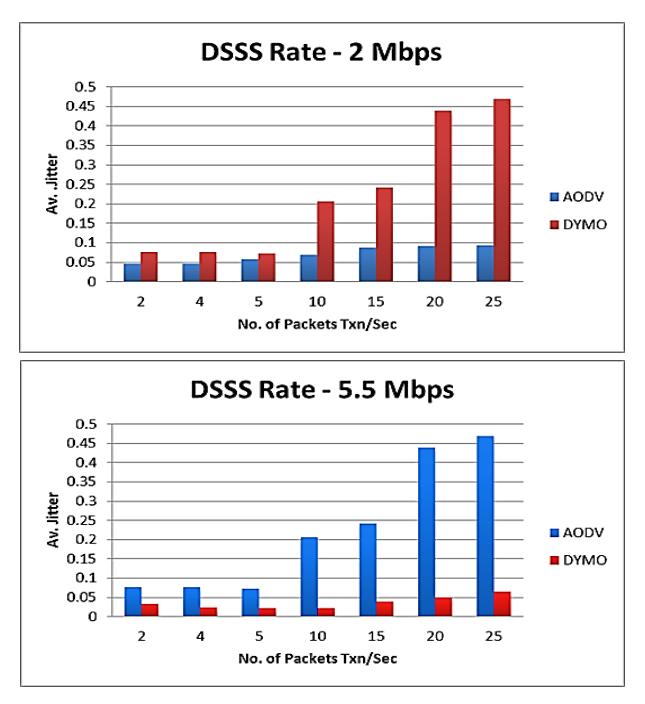
Figure 4 Average jitter (packet size 256 Bytes).
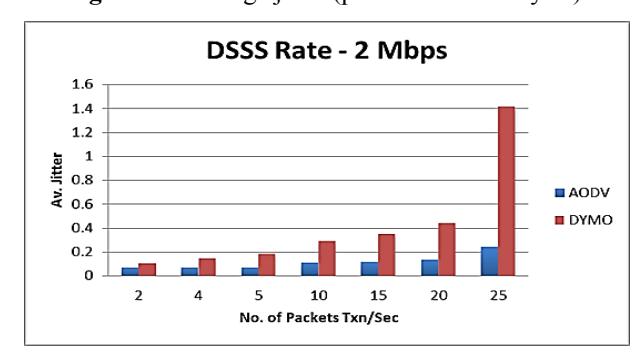
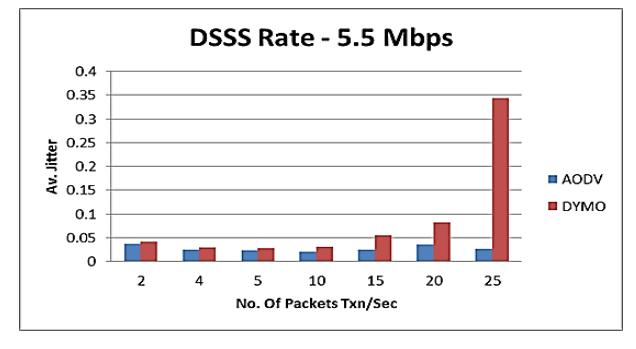
Figure 5 Average jitter (packet size 516 Bytes).
Table 2 Total no. of factors.
| -1 | 1 | ||
|---|---|---|---|
| Symbol | Throughput | Levels | |
| A | Routing Protocol | DYMO | AODV |
| B | DSSS Rate | 2 Mbps | 5.5 Mbps |
| C | Packet Size | 256 Bytes | 512 Bytes |
Table 3 Average values from simulation results for end to end delay.
| - 1 DSSS Rate 2 Mbps | 1 DSSS Rate 5.5 Mbps | ||||
|---|---|---|---|---|---|
| A | B | B | |||
| Packet Size | Packet Size | ||||
| Routing | -1 1 | -1 | 1 | ||
| Protocol | 256 Bytes | 512 Bytes | 256 Bytes | 512 Bytes | |
| AODV(1) | 0.32666331 | 0.5668223 | 0.063190737 | 0.05982541 | |
| DYMO(-1) | 3.97339266 | 3.46590216 | 0.333646724 | 0.54102706 | |
Table 4 Average values from simulation results for end to end delay.
| - 1 DSSS Rate 2 Mbps | 1 DSSS Rate 5.5 Mbps | ||||
|---|---|---|---|---|---|
| A | B | B | |||
| Packet Size | Packet Size | ||||
| Routing | -1 1 | -1 | 1 | ||
| Protocol | 256 Bytes | 512 Bytes | 256 Bytes | 512 Bytes | |
| AODV(1) | 0.06920058 | 0.11432823 | 0.023234836 | 0.02739202 | |
| DYMO(-1) | 0.2252164 | 0.41638913 | 0.035612614 | 0.08743459 | |
Table 5 Factorial design for end to end delay.
| I | A | B | C | Y | AB | AC | BC | ABC |
|---|---|---|---|---|---|---|---|---|
| 1 | -1 | -1 | -1 | 3.973 | 1 | 1 | 1 | -1 |
| 1 | 1 | -1 | -1 | 0.326 | -1 | -1 | 1 | 1 |
| 1 | -1 | 1 | -1 | 3.465 | -1 | 1 | -1 | 1 |
| 1 | 1 | 1 | -1 | 0.566 | 1 | -1 | -1 | -1 |
| 1 | -1 | -1 | 1 | 0.333 | 1 | -1 | -1 | 1 |
| 1 | 1 | -1 | 1 | 0.063 | -1 | 1 | -1 | -1 |
| 1 | -1 | 1 | 1 | 0.541 | -1 | -1 | 1 | -1 |
| 1 | 1 | 1 | 1 | 0.059 | 1 | 1 | 1 | 1 |
| Total | -7.298 | -0.064 | -7.334 | 9.326 | 0.536 | 5.794 | 0.472 | -0.96 |
| Total/8 | -0.91225 | -0.008 | -0.91675 | 1.16575 | 0.067 | 0.72425 | 0.059 | -0.12 |
| I | A | В | C | Y | AB | AC | BC | ABC |
|---|---|---|---|---|---|---|---|---|
| 1 | -1 | -1 | -1 | 0.225216399 | 1 | 1 | 1 | -1 |
| 1 | 1 | -1 | -1 | 0.069200579 | -1 | -1 | 1 | 1 |
| 1 | -1 | 1 | -1 | 0.416389125 | -1 | 1 | -1 | 1 |
| 1 | 1 | 1 | -1 | 0.114328227 | 1 | -1 | -1 | -1 |
| 1 | -1 | -1 | 1 | 0.035612614 | 1 | -1 | -1 | 1 |
| 1 | 1 | -1 | 1 | 0.023234836 | -1 | 1 | -1 | -1 |
| 1 | -1 | 1 | 1 | 0.087434588 | -1 | -1 | 1 | -1 |
| 1 | 1 | 1 | 1 | 0.027392017 | 1 | 1 | 1 | 1 |
| Total | -0.53049 | 0.29228 | -0.6515 | 0.998808386 | -0.19371 | 0.385656 | -0.180321 | 0.098 |
| Total/8 | -0.06631 | 0.0365 | -0.0814 | 0.124851048 | -0.024214 | 0.048207 | -0.022540 | 0.012 |
Table 6 Factorial design for average jitter.
From (1), for end to end delay:
\[SST = 2^{3} \begin{bmatrix} (-0.912)^{2} + (0.008)^{2} + \\ (-0.916)^{2} + (-0.067)^{2} + \\ (0.724)^{2} + \\ (0.069)^{2} + (-0.12^{2} \end{bmatrix}\]
SST = 17.7568215
From (1), for average jitter:
\[SST = 2^{3} \begin{bmatrix} (-0.06631)^{2} + (0.03653)^{2} + \\ (-0.08143)^{2} + (-0.024213)^{2} + \\ (0.0482)^{2} + \\ (-0.0225)^{2} + (0.0122)^{2} \end{bmatrix}\]
SST = 0.1274629
Table 7 Results for delay (in terms of %).
| Factors | Effect |
|---|---|
| EFFECT OF R.P | 37.4 % |
| EFFECT OF DSSS RATE | 0.002~% |
| EFFECT OF P.S | 37.8 % |
| EFFECT OF R.P & DSSS | 0.202 % |
| EFFECT OF R.P & PS | 23.6 % |
| EFFECT OF P.S & DSSS | 0.15 % |
| EFFECT OF P.S, DSSS,R.P | 0.64 % |
| Factors | Effect |
|---|---|
| EFFECTOF R.P | 27.5 % |
| EFFECT OF DSSSRATE | 8.37 % |
| EFFECT OF P.S | 41.61 % |
| EFFECT OF R.P & DSSS | 3.67 % |
| EFFECT OF R.P & PS | 14.58 % |
| EFFECT OF P.S & DSSS | 3.18 % |
| EFFECT OF P.S,DSSS,R.P | 0.94 % |
Table 8 Results for average jitter (in terms of %).
After further calculations were derived from Eq. (1) and the factorial design method, the results for end to end delay were as follows: effect of routing protocol (R.P): 37.4%, effect of DSSS rate:0.002%, effect of packet size (P.S): 37.9%, interaction/effect of routing protocol and DSSS rate: 0.202%, interaction/effect of routing protocol and packet size: 23.6 %, interaction/effect of packet size and DSSS rate:0.15%,and interaction/effect of packet size, DSSS rate, routing protocol: 0.64%.Similarly for average jitter: effect of routing protocol (R.P): 27.5%, effect of DSSS rate: 8.37%, effect of packet size (P.S): 41.61%, interaction/effect of routing protocol and DSSS rate: 3.67%, interaction/effect of routing protocol and packet size: 14.58%, interaction/effect of packet size and DSSS rate: 3.18%,and interaction/effect of packet size, DSSS rate, routing protocol: 0.94%.The results are shown in Table 7 and 8 respectively.
Thus, from the results above we can conclude that the factor which has the most significant influence on the average end to end delay network performance metric is packet size (37.9%), followed by routing protocol (37.4%). As for average end to end delay, the DSSS rate does not play a significant role as its effect is only 0.002%. As for the average jitter network performance metric, again, the effect of packet size comes first (41.6%), followed by routing protocol (27.5%) and DSSS rate (8.37%). On the basis of this analysis these factors can be prioritized when deploying a MANET network. For example, if there is going to be video transmission in said network then jitter and delay have to be low and priority should be given to packet size first, followed by routing protocol.
6 Conclusion and Future Work
From the factorial design analysis it can observed that while deploying a MANET, the most important factor for keeping average end to end delay and average jitter at an optimum level is to give priority to packet size, followed by routing protocol, as both of these factors have a significant influence/impact.
Again, research could be done as to which packet size of all packet sizes gives optimal results and what packet size can be used in a particular case. Similarly, the routing protocol that gives the best performance can subsequently be selected. Following this procedure–rather than randomly choosing packet sizes and routing protocols –will result in a MANET with better through put.
Future work can evaluate the effect of these factors on some other key network performance indicators, such as throughput, PDR and so on. Research has been done to compare protocols but from our analysis of three key factors it is clear that it is necessary to evaluate the effect of other factors on network performance indicators as well.