
1 0BIntroduction
Information technology (IT) has changed various aspects of organizations regardless of the type of organization. IT helps organizations to adapt and to improve their quality of service. But an organization has to be cautious in adopting IT, since the implementation could be expensive, have a high risk of partial effectiveness and fail to generate profit [1]. A further complication is the fact that managers and non-IT stakeholders whose expertise is beyond assessing the business value of particular IT services should be involved in the design of the IT service to ensure IT-business alignment [1]-[4]. The business value of IT services is often measured by return on investment (ROI), but it has been widely demonstrated that this measurement is not sufficient to represent the business value of IT services. Business value is subjective and difficult to quantify, while ROI only uses either direct or indirect financial measures [5]-
[7]. Various models have been proposed to measure the business value of IT services. The business-driven model (BDM) is an example of a previously published model where two main variables are used to determine the actual value of a business. The first variable is the ideal business value from the perspective of the manager and the second is the technical quality from the perspective of the user [6]. Another study has proposed a model based on the value driver tree (VDT) as a means of reducing the subjective nature of the assessment [8]. Both models have shortcomings. The BDM is purely a subjective assessment, whereas the VDT method requires a lot of technical data.
This paper describes a new method to measure the business value of IT services based on a probabilistic technique. The first objective was to clarify the role of the business manager and technical manager in assessing the business value by appropriately applying their subjectivity to their respective domain responsibilities. A subjective probability assessment will be more accurate if the assessor only assesses object she understands. Secondly, a probabilistic approach was designed to reduce the technical complexity in assessing the business value of IT services. In addition, this paper also introduces a new assessment of the value and quality of the security of IT services, which is not covered by either the BDM or VDT method. Instead of calculating the ROI, the ROSI method described in [9] is used. In this method, the measurement is directly related to the effect of security arrangements on the business value.
This paper is organized as follows. After this brief introduction, Section 2 will present recent related works with an emphasis on the VDT and BDM method. Section 3 will elaborate the model's construction with its probabilistic characteristics, including a weighting function for evaluators and a probabilistic view of business and technical perspectives. Based on the derived model, Section 4 will address the business value of IT services, and Section 5 will address the business value of IT security services. The impact of changes of the quality of IT services on business value will be discussed in Section 6. A case illustration in Section 7 will show both a simulation and a real case application of the method in an IT enterprise, after which the applicability and limitations of the proposed method will be discussed. Finally, the conclusion will be presented in Section 7.
2 Related Works
As mentioned before, several methods have been developed for the measurement of business value of IT related services. One of them is the VDT method, which explores the relationships between a hierarchical model of capability and IT performance metrics. Relations within technical data are analyzed by linear regression [8]. The VDT method helps to reduce the subjectivity of measurement but it relies heavily on technical parameters. This method can only perform optimally if business performance management (BPM) is already available in the organization. It is understood that if this requirement is not fulfilled then the performance of the VDT method is not good enough. Furthermore, this model does not cover the important aspect of IT security.
Another method is BDM, in which two main variables are used to determine the actual value of a business. One variable is the ideal business value from the perspective of the business manager and the other is the technical quality from the perspective of the technical manager or the users [6]. The basic model of BDM is shown in Figure 1.
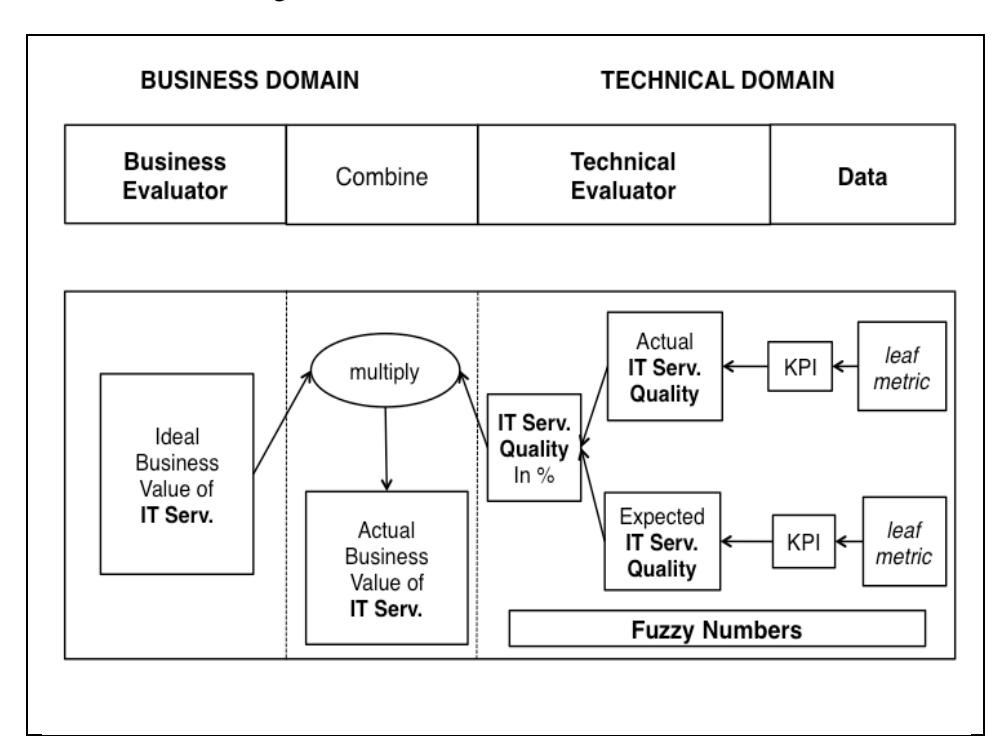
Figure 1 Schematic diagram of BDM, taken from [6]. Notice that both business evaluators and technical evaluators assess the IT services and the technical evaluators have to input many fuzzy parameters for assessment.
It can be seen that both business evaluators and technical evaluators assess the IT services. In particular the assessment of the business evaluators is necessary to measure the business value of IT services. Several previously published researches have revealed that IT services are often not well understood by business managers [1],[7]. This condition could lead to a lower accuracy of the assessment results. Moreover, in BDM the measurement of the technical side depends on metrics derived from the key performance indicators (KPIs). The metrics are narrowed down to the lowest level, or the so-called leaf metrics. This leads to the requirement of measuring many leaf metrics. The combination of KPI leaf metrics and fuzzy numbers results in BDM's complex implementation. The managers have to deal with a large number of parameters, especially mathematical variables of fuzzy systems.
Both the VDT and the BDM model have limitations. BDM applies purely subjective assessment. Consequently, evaluation results from managers who do not understand the value of IT services will not always be accurate, especially in evaluating the security of IT services, which is more difficult to assess from a business perspective [1],[9]. Meanwhile, VDT relies heavily on a large amount of technical data. Consequently, its accuracy depends on the completeness of the data [8].
This paper describes a new perspective on assessing the business value of IT related services, including business IT services and security IT services, by applying a probabilistic technique, using both a subjective and a mathematical approach. To achieve this objective, it was necessary to construct a new probabilistic model for business value assessment, which will be elaborated in the next section. Based on the proposed model, a new method to obtain the business value of business IT services, the business value of security IT services, and the impact of changes in service quality on the business value is proposed.
3 Business Value of IT Service Quality Model Construction
3.1 Basic Model Construction
As mentioned in the previous section, the main objectives in this investigation were (i) to construct a new model for business value assessment using a probabilistic technique, (ii) to obtain the business value of IT services, (iii) to obtain the business value of IT security services, (iv) to measure the impact of changes in service quality on the business value, and (v) to show the applicability of the proposed method in a real environment. The foundation for achieving these objectives is model construction. The model proposed in this paper is an improvement of the BDM model in [6]. The proposed model is an effort to eliminate apparent weaknesses in both the BDM and VDT method, in addition to introducing another important aspect in IT services, i.e. IT security services, which are not covered by the BDM or VDT model.
The first improvement of the model is proposed by introducing two new intermediate entities, called Business Process and Business Demand, in order to clarify the roles of the business evaluators and the technical evaluators. The first entity, Business Process, will be measured and assessed by business managers. For them, assessment and measurement of business processes is routine work [5]. The second entity is called Business Demand as the relationship between Business Process and business IT services can be explained as a supply-demand relationship; see [2],[3],[5].Business Demand's role in the model is as an intermediary entity to connect the business processes and the business IT services. Aparticularbusiness process can be supported by more than one business demand, and a certain business demand can correlate to more than one business IT service.
The second improvement proposed in this paper is to simplify the method of calculating the quality metrics by introducing measurement of IT service quality factors expressed as a percentage rather than a combination of fuzzy numbers and KPI metrics. With this simplification it will be easier for managers to assess the quality of their IT services. Two quality factors are considered, i.e. availability and capacity, referring to [3] for a discussion of IT service quality factors. For convenience, the two metrics are combined into one quality metric as follows,
\[Q = A_V \times S_A \tag{1}\] where Q denotes quality measurement, AV denotes availability and SA denotes supply-ability. The variables Q, AV and SA are probabilistic in nature and are expressed in percentage points between 0% and 100%. Availability is calculated as the percentage of lifetime from the agreed service time availability from the Service Level Agreement. Supply-ability is a new metric defined to represent the second major factor, i.e. capacity. Defining supply-ability is necessary to simplify the incorporation of quality metrics into a single metric. Supply-ability is the probability of demand volume that can be fulfilled by the services. This probability can be calculated by assuming that business-demand volume fluctuation is normally distributed. The required data are the capacity of the service, average volume of demand, and standard deviation of demand. With this construction it is clear that the quality metrics regarding the business IT service are simpler than the KPI leaf metrics and fuzzy numbers in [6]. In the proposed model, the technical evaluators are not required to assess the business IT services with a large number of IT service metric variables.
The next feature of the proposed model is a security and risk factor introduced in the technical domain, which is not covered by the original BDM. Security is measured by calculating the impact of a successfully mitigated threat, as described in the return on security investment (ROSI) model [9] and Bashir's model proposed in [1]. Based on this scenario, two entities are presented in the proposed model, i.e. Threat and Security IT Service. Threat has four attributes: (i) audit frequency – referring to the frequency of threats that have occurred within a certain period of time based on audit data, (ii) audit probability – referring to the records and audit results of any threat exploitation, (iii) probability of threat exploitation –referring to the probability of a threat that successfully penetrates the control mechanism of the security IT service, and (iv) downtime impact – referring to the impact of downtime on the business IT service following a security breach.
The complete proposed model can be seen in Figure 2, where the translation function as a function to transform quality into business value and vice versa will be elaborated in the next section.
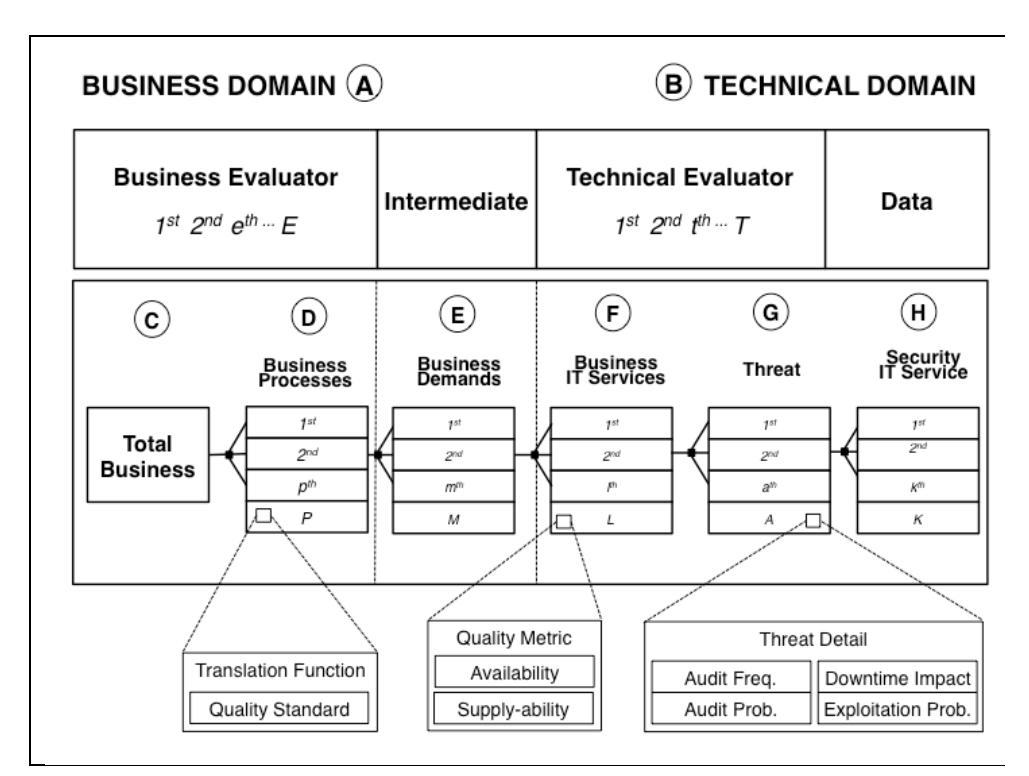
Figure 2 Complete model construction of the business value of IT service quality after introducing (i) Business Process and Business Demand to separate assessment by business evaluators and technical evaluators, (ii) Availability and Supply-ability to simplify the measurement metrics, (iii) Threat and Security IT Service as new elements of the business value of IT Services.
In the proposed model, all of the relations take the form of one-to-many relationships symbolized by a line with three branches. This symbol also represents the basic probabilistic relationships between corresponding entities. Total Business, which covers all business processess within the organization, is related to more than one business process, whereas a specific business process can be supported by more than one business demand, and furthermore a certain business demand will correlate with more than one business IT service. Meanwhile, one business IT service is exposed to more than one threat, but each threat can be controlled by more than one security IT service.
3.2 Probabilistic Model
The proposed model in this paper is based on a probabilistic method. In this
Table 1 Short description of each variable used in the model.
| A | В | С | D | ||||
|---|---|---|---|---|---|---|---|
| Business Evaluator | BE | Technical Evaluator | TE | Total Business Value | ТВ | Business Process | \(BP_p\) |
| Ordinal | \(e^{th}, \dots E\) | Ordinal | \(t\), \(t^{th}\), \(T\) | Ordinal | \(p^{th}, \dots P\) | ||
| Quest. Score | \(QB_e\) | Quest. Score | \(QT_t\) | Ideal value | 100% | Value | \(v_{BPp}\) |
| Weight | \(w_{BE}\) | Weight | \(w_{TE}\) | Weight | \(W_{BPepm}\) | ||
| Asses. Result | \(W_{BPpm}\) | ||||||
| Quality standard | \(QS_1\), \(QS_2\) | ||||||
| Trans. function | \(FBP_p(x)\) | ||||||
| Quality | \(Q_{BPp}\) | ||||||
| Qual. difference | \(\Delta v_{BPp}\) | ||||||
| E | F | G | Н | ||||
| Business Demand | \(BD_m\) | Business IT | \(ITS_l\) | Throat | TII | Security IT | |
| \(DD_m\) | Services | 1151 | Threat | \(TH_a\) | Services | \(ITC_k\) | |
| Ordinal | \(m, \\ m^{th}, \dots \\ M\) | Services Ordinal | l, lth, L | Ordinal | A \(A\) \(A\) \(A | • | |
| \(m\), \(m^{th}\), | l, lth, | a, ath, | Services | k, kth, | |||
| Ordinal Weight Asses. Result | \(m\), \(m^{th}\), \(M\) | Ordinal Weight Asses. Result | \(l, \ l^{th}, \dots \ L\) | Ordinal | \(a,\) \(a^{th},\) \(A\) | Services Ordinal | k, kth, K |
| Ordinal Weight | \(m, \\ m^{th}, \dots \\ M\) | Ordinal Weight | l, lth, L WITSml | Ordinal Weight Asses. | \(a,\) \(a^{th},\) \(A\) \(w_{THla}\) | Ordinal Weight Asses. | k, kth, K WITCak |
| Ordinal Weight Asses. Result Support business | \(m,\) \(m^{th}, \dots\) \(M\) \(w_{BDpm}\) | Ordinal Weight Asses. Result Serving business | l, lth, L WITSml | Ordinal Weight Asses. Result Time | a, ath, A WTHIa | Services Ordinal Weight Asses. Result Threat to IT | k, kth, K WITCak |
| Ordinal Weight Asses. Result Support business process | \(m,\) \(m^{th}, \dots\) \(M\) \(W_{BDpm}\) \(W_{BDepm}\) | Ordinal Weight Asses. Result Serving business demand | l, lth, L WITSml WITStml QITSI | Ordinal Weight Asses. Result Time no security Time with | \(a,\) \(a^{th},\) \(A\) \(w_{TH1a}\) \(w_{TH1ba}\) \(t_{NSI}\) | Services Ordinal Weight Asses. Result Threat to IT service Qual. | k, kth, K WITCak WITCtak |
| Ordinal Weight Asses. Result Support business process Quality | \(m,\) \(m^{th}, \dots\) \(M\) \(w_{BDpm}\) \(w_{BDepm}\) \(w_{BDm}\) | Ordinal Weight Asses. Result Serving business demand Quality | l, lth, L WITSml WITStml | Ordinal Weight Asses. Result Time no security Time with security | a, a'h, A WTHIa WTHIIa | Services Ordinal Weight Asses. Result Threat to IT service Qual. | k, kth, K WITCak WITCtak |
section, the probabilistic characteristics of the entities will be elaborated. Table 1 shows the parameters used throughout this paper, which will be explained as the presentation progresses. The main variables are related to each main building block of the model denoted with A, B, … H, as shown in Figure 2.
Business Evaluators (BE) comprises of business managers or senior employees who are experts or in charge of the business. Technical Evaluators (TE) comprises of IT managers and staffs or workers who are familiar with IT services. It is possible that a person both functions as a business and technical evaluator, if qualified. Total Business (TB) represents the entire organization in terms of total business value from all existing business processes. Business Process (BP) represents the existing business processes, covering both key and supporting business processes. Business Demand (BD) represents the demands on a business process that are needed in order for the business process to proceed properly. Business IT Service (ITS) is an entity that serves business requests. The business value of this entity is one of the focuses of this paper. Threats (TH) is associated with threats to the business IT services. Security IT Service (ITC) denotes IT security control. The business value of this entity is another focus of this paper.
3.3 Weighing Business and Technical Evaluators
The mathematical description begins with block A and B in Figure 2. To calculate business value through a probabilistic model, one needs to assess the degree of influence of the evaluators, since they are responsible for giving a subjective probability valuation of the business. A weighing function for the business and technical evaluators captures the degree of this influence. Both business and technical evaluators naturally have different backgrounds and competencies. An evaluator could be more accurate in evaluating the business aspect or the technical aspect, based on his or her previous experience or knowledge. One evaluator may have worked in several divisions, while another is a new manager and has never worked in any other division. Therefore, a weighing function is created as a means to appreciate each evaluator's assessment. The weighing function is determined through a set of questionnaires at the beginning of the implementation of the model. The evaluator questionnaire contains personal data and a self-assessment survey in which the participants assess themselves based on several given parameters, such as age, years of service in the organization, education, position levels in the hierarchy of the organization, experience in previous divisions, some selfassessment questions and other relevant queries.
These parameters are presented in multiple-choice questions, where each choice has a score of its own. The scores are accumulated to obtain the weight of the evaluator. The weighing function is calculated separately for each type of evaluator. In the proposed model there are two types of evaluators, so there are two equations to calculate the functions, as follows:
\[_{WBEe} = \frac{QB_e}{\sum_{e=1}^{E} QB_e} \tag{2}\]
\[_{WTEt} = \frac{QT_t}{\sum_{t=1}^{T} QT_t} \tag{3}\] where \(w_{Bee}\) denotes the weighing function of the \(e^{th}\) business evaluator, \(w_{TEt}\) denotes the weighing function of the \(t^{th}\) technical evaluator. The parameter \(Q_{Be}\) denotes the scores taken from the result of the questionnaire for the \(e^{th}\) business evaluator, while \(Q_{Tt}\) denotes the scores for the \(t^{t}\) technical evaluator. The parameters E and T denote the total business and technical evaluator personnel respectively.
3.4 Business Perspective Assessment
Before arriving at our main objectives of obtaining the value of business IT services, security IT services, or impact of changes in service quality, we need to discuss the probabilistic characteristics of each entity in the business domain and the technical domain. Both business evaluators and technical evaluators subjectively judge the probabilistic values of each entity in their respective domain. The business evaluators are concerned with the assessment value of business processes and business demand, whereas the technical evaluators are concerned with business IT services, threats, and security IT services.
The business evaluators will be involved with block C, D, and E in Figure 2. The first entity in the business domain is Total Business in block C, which will generally consist of more than one business process in block D. The relationship between both entities basically shows how much each business process contributes to the total business, so that the following equation can be derived easily,
\[TB = \sum_{p=1}^{P} w_{BPp} \tag{4}\] where TB denotes the total business of the organization, \(w_{BPp}\) denotes the weight of the \(p^{th}\) business process, P denotes the total number of business processes involved in the organization. The weight of a business process is the measurement of its contribution to the total business. The business process parameter \(w_{BPp}\) in block D is obtained from the probability relationship of the business process [10], where an evaluator gives the value of each business process subjectively through the following equation,
\[W^{BPp} = \sum_{e=1}^{E} W^{BEe} \times W^{BPep}\] (5)
where the parameter \(w_{BPep}\) is the probabilistic assessment of the \(e^{th}\) business evaluator for the \(p^{th}\) business process. This is a probabilistic value with \(w_{Bpep}\) (a real number), \(w_{BPep} \in \mathbb{R}\), and satisfies \(0 \le w_{BPep} \le 1\). The parameter \(w_{BEe}\) is the weight of the \(e^{th}\) business evaluator obtained from Eq. (2). The parameter \(w_{BPp}\) is the total probability value of business process \(BP_p\) from the point of view of the \(e^{th}\) business evaluator and it reflects the contribution of the \(p^{th}\) business process to total business TB. The parameter E is the total number of business evaluators who have given their assessment.
A further characteristic that needs to be considered is the probabilistic nature of the business demands in block E. Using simple theory of probability [10], the value of the business demands assessed by each evaluator is given in Eq. (6),
\[W_{BDpm} = \sum_{e=1}^{E} W_{BEe} \times W_{BDepm}\] (6)
where the parameter \(w_{BDepm}\) is the probabilistic assessment of the \(p^{th}\) business evaluator for the \(m^{th}\) business demand to support the \(p^{th}\) business process. It is a probabilistic value with \(w_{Bdepm}\) (a real number), \(w_{BDepm} \in \mathbb{R}\), and satisfies \(0 \le w_{BDepm} \le I\). As before, the parameter \(w_{BEe}\) is the weight of the \(e^{th}\) business evaluator obtained from Eq. (2). The parameter E is the total number of business evaluators who have given their assessment. The parameter \(w_{BDpm}\) is the total probability value of the \(m^{th}\) business demand \(BD_{pm}\) to support the \(p^{th}\) business process \(BP_p\), where the value is an aggregation of each business evaluator's assessment to each business process \(w_{BDepm}\). Now, using the property of disjunctive probability [10], one can relate the \(m^{th}\) business demand in block E to support all business processes in block D through the following equation,
\[W_{BDm} = \sum_{p=1}^{P} W_{BDpm} \times W_{BPp} \tag{7}\]
One business process may have many business demands, where not all of them are related to IT. In order to keep the model valid in determining the business value, the index m=0 is introduced to accommodate all business demands that are not related to IT. The parameter P denotes the total number of business processes involved in the organization.
3.5 Translation Function
The next entity needed is the quality standard for each business process. This function is included in the assessment by the business evaluators of each business process in block C. This standard is needed to translate the quality of the business IT service in relation to the business value and vice versa. Each business evaluator is required to provide two quality values, namely \(QS_1\) and \(QS_2\) for each business process. If the quality of the business IT service is perfect then the value of quality will be 100%, and reciprocally if the value of quality is perfect then the business value of IT services will be 100%. (Both conditions rarely occur in real life.) This translation function also accommodates low values of quality, resulting in a negative percentage of the business value. This is a logical assumption since a poor quality IT service could have a detrimental effect on the business processes of the organization. At first, three percentage points of the business value are needed as reference points, i.e. 0\%, 50\% and 100%. It is assumed that if the business value is 100% then \(QS_3\) is 100%, so that the business evaluators should provide the remaining values of \(QS_1\) and \(QS_2\). In other words, both values are the quality standard from the perspective of the managers, who could assess that the business value is only 50% of the full value and 0% if the business is perceived as having no value. The standard quality in each business process can be calculated as follows,
\[QS_{lp} = \sum_{e=1}^{E} w_{BEe} \times QS_{lep}\] (8)
\[QS_{2p} = \sum_{e=1}^{E} w_{BEe} \times QS_{2ep}\] (9)
where \(QS_{1p}\) and \(QS_{2p}\) denote the quality standard for the \(p^{th}\) business process, \(QS_{1ep}\) and \(QS_{2ep}\) denote the quality standard provided by each business evaluator for the \(p^{th}\) business process, \(w_{BEe}\) is the weighing function for the \(e^{th}\) business evaluator from Eq. (2). As before, the parameter E is the total number of business evaluators who have given their assessment. The assumption for the assessment value is \(0\% \le QS_{1ep} \le QS_{2ep} < 100\%\), as mentioned before.
Using the three available points, the translation function can be found easily by a simple linear function. The function takes the form of two linear functions, each of which is expressed in the form y = f(x) = mx + c. As shown in Figure 3, the translation function involves three points, \(T_a\), \(T_b\) and \(T_c\) with \(T_a = (QS_1, 0\%)\), \(T_b = (QS_2, 50\%)\) and \(T_c = (100\%, 100\%)\).
Using a simple manipulation of the linear function, one has the following equation:
\[FBP_{p}(x) = \begin{cases} (x - QS_{1p})(2QS_{2p} - 2QS_{1p})^{-1} & for \quad x \leq QS_{2} \\ (x - 1)(2 - 2QS_{2p})^{-1} + 1 & for \quad x > QS_{2} \end{cases}\](10)
where \(FBP_p(x)\) denotes the translation function from quality to business value expressed as a percentage at the corresponding \(p^{th}\) business process and consists of two functions that depend on the requirement of x as the input parameter. The x is a real number satisfying \(0 \le x \le 100\%\).
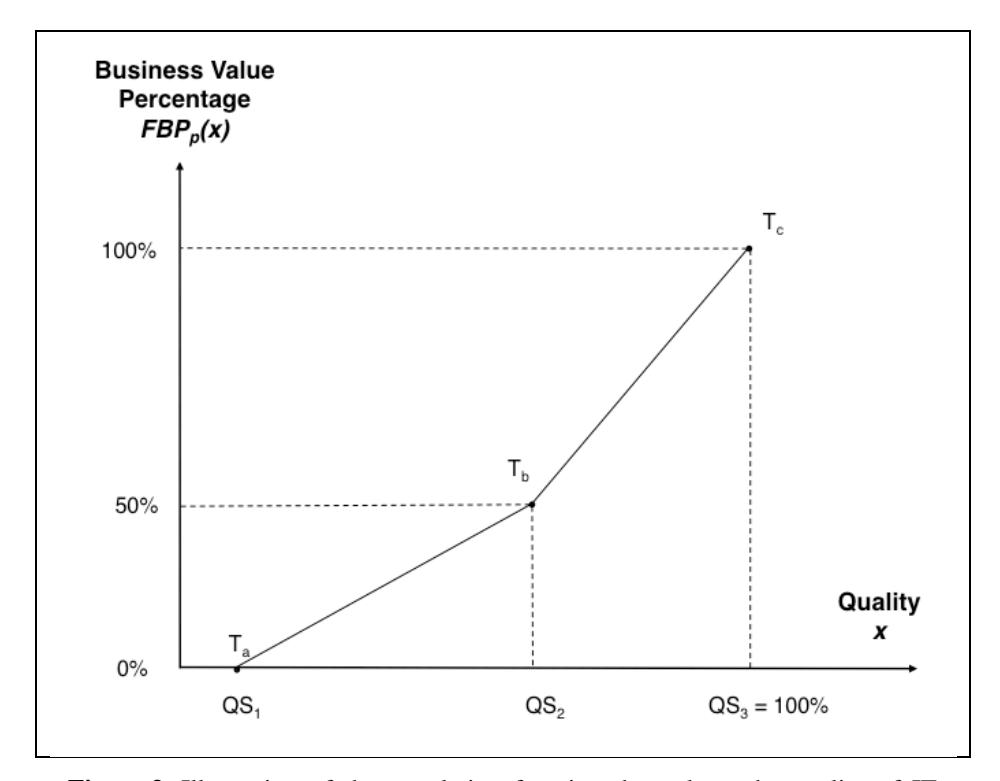
Figure 3 Illustration of the translation function that relates the quality of IT service to the business value. This function is a simple linear function, where \(QS_1\) and \(QS_2\) are provided by business evaluators.
3.6 Technical Perspective Assessment
Technical perspective assessment captures the characteristic probabilistic value of each entity in the technical domain shown as block F, G and H in Figure 2. There are five entities included in this domain. Different from the characteristics of the entities in the business domain, where every entity is subjective probabilistic, in the technical domain two of them can be based on statistical or technical data.
The first entity is the probabilistic value of the business IT service in block F, where the technical evaluators assess its value. The technical evaluators are those who understand the technical ins and outs of the business IT service, such as what features support a particular business demand, or the complicated nature of the relationship between business IT services them selves. A weighing function is used as the measure of relative influence of each technical evaluator. The equation to calculate the value of the assessment is as follows,
\[W_{ITSml} = \sum_{t=1}^{T} W_{TEt} \times W_{ITStml}\] (11)
where \(w_{ITStml}\) denotes the probabilistic value given by \(t^{th}\) technical evaluator to the \(l^{th}\) business IT service in meeting the \(m^{th}\) business demand. This is a probabilistic value with \(w_{ITStml}\) (a real number), \(w_{ITStml} \in \mathbb{R}\), and satisfies \(0 \le w_{ITStml} \le l\). In the technical domain, the parameter \(w_{TEt}\) is the weight of the \(t^{th}\) technical evaluator obtained from Eq. (3). The parameter T is the total number of technical evaluators who have given their assessment. The assessment result is aggregated to \(w_{ITSml}\), which corresponds to the weight of the \(l^{th}\) business IT service in meeting the \(m^{th}\) business demand. Using disjunctive probability, one can relate the \(l^{th}\) business IT service in block F to all the business demands it is serving in block E through the following equation,
\[W_{ITSI} = \sum_{m=1}^{M} W_{ITSml} \times_{WBDm}\] (12)
where M denotes the total number of business demands supported by the business IT services. As discussed in the previous section, there is a possibility that a business demand is served manually by the business IT service, where such condition is denoted with index m = 0.
The second entity consists of the quality metric details in the business IT service. The quality metric details involve the technical data of the quality metric. Metric values are obtained from the analysis of available data, including statistical data. As previously discussed, there are two quality metrics: (i) availability and (ii) supply-ability. To calculate the availability, one needs two parameters: downtime and agreed service time. To calculate the supply-ability three quality metrics are used, namely business IT service capacity, average volume of business, and standard deviation of business demand requests. The average volume of business is assumed to be normally distributed. By adopting the ITIL® availability formula [3], in which downtime and agreed service time are used, one can derive the availability as shown in Eq. (13),
\[A_{Vl} = \frac{t_{Sl} - t_{TOTl}}{t_{Sl}} \tag{13}\] where \(A_{VI}\) denotes availability, \(t_{SI}\) denotes agreed service time and \(t_{TOTI}\) denotes total downtime for the \(l^{th}\) business IT service. Furthermore, supply-ability is calculated, with the assumption that the demand is normally distributed, through the following equation,
\[S_{Al} = LA \left( VS_l, VM_l, \sigma M_l \right) \tag{14}\] where \(S_{Al}\) denotes supply-ability, \(VS_l\) denotes supply volume, \(VM_l\) denotes average demand volume and \(\sigma M_l\) denotes the standard deviation of the business demand for the \(l^{th}\) business IT service. LA(f) is a function to calculate the probability of demand volume on the precondition that the demand is lower than the supply. With the assumption that the demand is normally distributed, the supply probability can be determined using a cumulative normal distribution table. Once \(A_{Vl}\) and \(S_{Al}\) have been obtained, the quality of each business IT service can be obtained using Eq. (1):
\[Q_{IISI} = A_{VI} \times S_{AI} \tag{15}\] where subscript l in \(Q_{ITSI}\), \(A_{Vl}\) and \(S_{Al}\) corresponds to the l<sup>th</sup> business IT service; \(Q_{ITSI}\) denotes service quality; \(A_{Vl}\) denotes availability and \(S_{Al}\) denotes supplyability. This quality will be aggregated to the business demands in block E through the following relation,
\[Q_{BDm} = \sum_{l=1}^{L} w_{ITSml} \times (1 - w_{ITSm0})^{-1} \times Q_{ITSl}\] \[\tag{16}\] and further to the business processes in block C through Eq. (17),
\[Q_{BPp} = \sum_{m=1}^{M} w_{BDpm} \times (1 - w_{BDp0})^{-1} \times Q_{BDm}\] (17)
The parameter L denotes the total business IT services involved and M denotes the total business demands within the organization.
The third entity to be considered is the probabilistic characteristic of the threats in block G. The assumption is that every threat could have an impact on the business IT service. To simplify the model, it is assumed that threats are uncorrelated to each other. As with the other subjective evaluations described in this paper, the probabilistic value of Threat is assessed by the technical evaluators through the following equation:
\[W_{THIa} = \sum_{t=1}^{T} W_{TEt} \times_{W_{THtIa}}\] (18)
where \(w_{THtla}\) denotes the probabilistic value given by the \(t^{th}\) technical evaluator to assess the effect of the \(a^{th}\) threat on the \(l^{th}\) business IT service. This is a probabilistic value with \(w_{Thtla}\) (a real number), \(w_{THtla} \in \mathbb{R}\), and satisfies \(0 \le w_{THtla} \le I\). The parameter T is the total number of technical evaluators who have given their assessment. The parameter \(w_{TEt}\) is the weight of the \(t^{th}\) technical evaluator obtained from Eq. (3). The total assessment value of \(w_{THla}\) is the effect of the \(a^{th}\) threat on the \(l^{th}\) business IT service. Using disjunctive probability, one can relate the \(a^{th}\) threat in block G with all affected business IT services in block F through the following equation,
\[W_{THa} = \sum_{l=1}^{L} W_{THla} \times W_{ITSl}\] (19)
As in the probabilistic relationship before, the parameter L denotes the total business IT services where in this case they are vulnerable to threat TH.
The fourth important entity in the technical domain is the characteristic of Threat including its effect on quality. As mentioned in the previous section, this entity is not covered by the original BDM model. One can get the value for this entity through threat attributes, which in this paper include frequency of audit, audit probability, probability of threat exploitation, and downtime impact. In case these data are not directly available, it becomes the responsibility of the technical evaluator to provide the values. Considering the risk factor and total business IT services, using the ITIL® framework one can obtain the following equation [3],
\[t_{NSI} = \sum_{a=1}^{A} WTHIa \times (FA_a \div PA_a) \times PJ_a \times EM_a\] (20)
where \(t_{NSI}\) denotes the total effect of all threats on the \(l^{th}\) business IT service measured in time units if there is no security implemented with the probability of threat exploitation \(PJ_a\). The parameter A denotes the total Threat to a specific business IT service. The parameter \(FA_a\) denotes audit frequency, \(PA_a\) denotes audit probability, \(PJ_a\) denotes threat exploitation, and \(EM_a\) denotes downtime impact. The index a refers to the a<sup>th</sup> threat. \(FA_a\) is a real number satisfying \(FA_a > 0\). If the value of \(FA_a < I\), it means that the threat did not occur within the specified time range. \(PA_a\) and \(PJ_a\) are probability values, so that they are real numbers between 0 and 1. \(EM_a\) is a real number greater than 0 with a time unit such as hour, minute and second. \(t_{NSI}\) should be lower than or equal to the real downtime of the IT services.
The same method is used to calculate the total threat to business IT services if security IT services are not available. One can easily obtain the following equation,
\[t_{SI} = \sum_{a=1}^{A} w_{THIa} \times (FA_a \div PA_a) \times \overline{PJ}_a \times EM_a\] (21)
Eq. (21) is the equivalent of Eq. (20), except for the introduction of the parameter \(\overline{PJ}_a\) instead of \(PJ_a\). The parameter \(\overline{PJ}_a\) is complement of \(PJ_a\), or the probability of the \(a^{th}\) threat that can be mitigated by certain security IT services. \(t_{SI}\) denotes the aggregate threat effect to the \(l^{th}\) business IT service that was successfully mitigated by a certain IT security service. The unit for \(t_{SI}\) is time and its value is a real number greater than 0.
The fifth attribute is the probabilistic characteristic of the security IT services in block H. A security IT service is implemented to prevent a particular threat from occurring, so that the risk can be mitigated. The weight of the impact of the security IT service is assessed by the technical evaluators as in the following equation,
\[W_{ITCak} = \sum_{t=1}^{T} W_{TEt} \times W_{ITCtak}\] (22)
where \(w_{ITCtak}\) denotes the probabilistic value given by the \(t^{th}\) technical evaluator as an assessment of the role of the \(k^{th}\) security IT service in mitigating the \(a^{th}\) threat. It is a probabilistic value with \(w_{ITCtak}\) (a real number), \(w_{ITCtak} \in \mathbb{R}\), and satisfies \(0 \le w_{ITCtak} \le 1\). The parameter T is the total number of technical evaluators who have given their assessment. The parameter \(w_{TEt}\) is the weight of the \(t^{th}\) technical evaluator obtained from Eq. (3). The aggregate value of \(w_{ITCak}\) denotes the role of the \(t^{th}\) security IT service in mitigating the \(t^{th}\) threat. Using disjunctive probability, one can relate the \(t^{th}\) security IT service in block \(t^{th}\) to all threats it tries to control in block \(t^{th}\) through the following equation,
\[W_{ITCk} = \sum_{a=1}^{A} W_{ITCak} \times_{WTHa}\] (23)
where A denotes the total Threat controlled by a specific security IT service.
4 Business Value of IT Services
Following the first contribution of the new proposed model based on a probabilistic approach, this section describes the second contribution, which regards the application of the model for calculating the numerical value of the business IT services, which is denoted with parameter \(v_{ITS}\). The calculation is performed based on the model described in Figure 2 and its subsequent probabilistic characteristics. The business IT service value is expressed in a percentage of the total business value, where if the quality of the whole business is assumed to be perfect it's value will be 100%. Then the value of business IT services can be calculated relative to this ideal value.
Referring to the model construction and its probabilistic characteristics, from Eq. (4), the total business value is the aggregation of all business processes, so that the business value of each business process can be calculated through Eq. (24),
\[v_{BPp} = w_{BPp} \times 100\%\] \[v_{BPp} = w_{BPp} \tag{24}\]
The parameter \(v_{BPp}\) denotes the business value of the \(p^{th}\) business process, which is basically equal to \(w_{BPp}\) presented in percentage form. From the probabilistic properties it is clear that the value of \(v_{BPp}\) satisfies \(0 \le v_{BPp} \le 100\%\) and \(\sum_p v_{BPp} = 100\%\). The parameter \(w_{BPp}\) is the probabilistic value of the \(p^{th}\) business process derived from Eq. (5) in the previous section.
One can proceed with calculating the business value of the business demands after finding the value \(v_{BPp}\) above. Again using the model's construction and probabilistic characteristics, using Eq. (7) it is possible to find the following relation.
\[V_{BDm} = \sum_{p=1}^{P} W_{BDpm} \times V_{BPp}\] (25)
Where \(v_{BDm}\) denotes the value of the \(m^{th}\) business demand, \(w_{BDpm}\) is the probabilistic value of the \(m^{th}\) business demand for the \(p^{th}\) business process, derived from Eq. (6) in the previous section. The parameter P denotes the total number of business processes in the organization. The parameter \(v_{BDm}\) is a real number satisfying \(0 \le v_{BDm} \le 100\%\) and \(\sum_m v_{BDm} = 100\%\).
Continuing the process further, one can calculate the business value of the business IT services. The calculation method is similar to the calculation of \(v_{BDm}\), since every business demand can be served by a combination of several business IT services using Eq. (12). This is shown in the following equation:
\[v_{ITSI} = \sum_{m=1}^{M} w_{ITSml} \times v_{BDm}\] (26)
where \(v_{ITSI}\) denotes the business value of the \(l^{th}\) business IT service. It takes a real number satisfying \(0 \le v_{ITSI} \le 100\%\) and \(\sum_l v_{ITSI} = 100\%\). The parameter M denotes the total number of business demands supported by the business IT services. The parameter \(v_{BD0}\) with index m=0 is the notation for all non-IT or manual business demands, as discussed previously. The \(w_{ITSml}\) is the probabilistic value of the \(l^{th}\) business IT service serving the \(m^{th}\) business demand derived from Eq. (11) in the previous section.
The obtained parameter \(v_{ITSI}\) represents all of the business values of the business IT services.
5 Business Value of IT Security Services
The second numerical result presented in this paper is the value of the security IT services, denoted by parameter \(v_{ITC}\). The function of security IT services is to protect the vulnerability of the business IT services from threat exploitation, since threats have the potential to degrade the quality of the business IT services. Obviously the quality of the business does not directly reflect the business value, so that in this paper the translation function to relate the quality to the business value described in the previous section will be used. The steps to obtain the business value of the security IT services can be broken down as follows: (i) calculate the actual quality of the business process, (ii) calculate the quality of the business process in case no security is implemented, (iii) calculate the difference between both qualities, (iv) translate the quality difference into the business value, and finally (v) calculate the business value of the security IT services by propagating the business value.
The first step is to calculate the actual business process. The process begins with the calculation of the quality of the business IT services in block F, where two parameters will be used, namely Availability and Supply-ability, as discussed in the previous sections. Eq. (13) is employed to calculate availability, and Eq. (14) for supply-ability. Once availability and supply-ability have been calculated, the actual quality can be found with Eq. (15). Then this business IT service quality is aggregated to the quality of the business demand in block E using Eq. (16), as in Eq. (27) below,
\[Q_{BDm} = \sum_{l=1}^{L} w_{ITSml} \times (1 - w_{ITSm0})^{-1} \times Q_{ITSl}\] (27)
where the parameter \(w_{ITSml}\) is calculated through Eq. (11). Note that in Eq. (27), the \((1 - w_{ITSm0})^{-1}\) part is presented to emphasize that manual processing of \(w_{ITSm0}\) is excluded, as discussed in the previous section. \(Q_{BDm}\) denotes the quality value of the \(m^{th}\) business demand. Now this \(Q_{BDm}\) can be propagated into the quality of the business processes in block D using Eq. (17), as in Eq. (28),
\[Q_{BPp} = \sum_{m=1}^{M} {_{WBDpm}} \times (1 - {_{WBDp0}})^{-1} \times Q_{BDm}\] (28)
where the parameter \(w_{BDpm}\) is calculated using Eq. (6). As in Eq. (27), a manual process is likewise excluded. \(w_{BDp0}\) denotes the manual part of the demand from the \(p^{th}\) business process, and \(Q_{BPp}\) denotes the quality at the \(p^{th}\) business process. This \(Q_{BPp}\) value is the actual value and will be used to calculate the difference in quality after IT security is implemented.
The second step is to calculate the quality of the business process in case no security is implemented. In this case Eq. (20) will be used to obtain the Total Threat to the IT service as \(t_{NSl}\). Then, using Eq. (21), the threat if security is implemented is obtained as \(t_{Sl}\). The parameter \(t_{Sl}\) is used as the basis of total time where no security is implemented, as in Eq. (31),
\[t_{TOTI} = t_{NSl} + t_{Sl} \tag{29}\]
Now using this total time, availability can be calculated using Eq. (13), as follows,
\[A_{VTOTI} = \frac{t_{SI} - t_{TOTI}}{t_{SI}} \tag{30}\]
Then with the assumption that there is no change in supply-ability, one can find the quality with no security implemented using Eq. (15), as follows,
\[Q_{ITSI\_NS} = A_{VTOTI} \times S_{AI} \tag{31}\]
This quality without security for the \(l^{th}\) business IT service \(Q_{ITSl}\) will be propagated to the business process level using Eqs. (27) and (28):
\[Q_{BDm_{-}NS} = \sum_{l=1}^{L} w_{lTSml} \times (1 - w_{lTSm0})^{-1} \times Q_{lTSl_{-}NS}\] (32)
\[Q_{BP_{p}_{NS}} = \sum_{m=1}^{M} W_{BDpm} \times (1 - W_{BDp0})^{-1} \times Q_{BDm_{NS}}\] (33)
where \(w_{ITSml}\) is calculated through Eq. (11) and \(w_{BDpm}\) through Eq. (6). The parameter \(Q_{BDm\_NS}\) denotes the quality without any security measure at the \(m^{th}\) business demand. The parameter \(Q_{BPp\_NS}\) denotes the quality without any security measure at the \(p^{th}\) business process. Note that \(w_{ITSm0}\) and \(w_{BDp0}\) are used to exclude the manual part from the calculation. Now the \(Q_{BPp\_NS}\) is used to calculate the difference between the actual business value in Eq. (24) and the value without any security measure.
Both the actual quality Eq. (24) and the quality without security Eq. (33) are translated into the business value using translation function Eq. (10), so that one can find the difference in business value as in Eq. (36):
\[\Delta v_{BPp} = v_{BPp} - FT_p(Q_{BPp-NS}) \tag{34}\]
The parameter \(v_{BPp}\) denotes the actual business value of the business process from Eq. (24) and \(Q_{BPp\_NS}\) denotes the quality without security implemented as in Eq. (33). The business value difference denoted by \(\Delta v_{BPp}\) is propagated to the business demand in block E and the business IT service in block F using Eqs. (7) and (12) as follows,
\[\Delta V_{BDm} = \sum_{p=1}^{P} W_{BDm} \sum (1 - W_{BDp0})^{-1} \sum \Delta V_{BPp}\] (35)
\[\Delta_{VITSI} = \sum_{m=1}^{M} W_{ITSml} \sum (1 - W_{ITSm0})^{-1} \sum \Delta_{VBDm}\] (36)
The parameter \(\Delta v_{BDm}\) denotes the business value difference at the \(m^{th}\) business demand, while \(\Delta v_{ITSI}\) denotes the business value difference in business IT service. As in the previous propagation, the manual part is excluded, which is shown in \(w_{BDp0}\) and \(w_{ITSm0}\). Continuing the procedure, the business value difference of a threat in block G is calculated using Eq. (19), as follows,
\[\Delta_{VTHa} = \sum_{l=1}^{L} {}_{WTHla} \sum_{\Delta_{VITSl}}\] (37)
Eq. (37) is the propagation of the business value difference at the business IT service in case a threat appears. The \(\Delta v_{THa}\) denotes the business value difference at the \(a^{th}\) threat, whereas \(w_{THla}\) denotes the weight of the \(a^{th}\) threat that affects the business IT service.
Finally, the parameter \(\Delta v_{THa}\) is further propagated to the security IT service in block H to obtain the business value of the security IT service using Eq. (23) as shown in Eq. (40),
\[\Delta v_{ITCk} = \sum_{a=1}^{A} \sum_{WIICak} \sum_{\Delta VTHa}\] (38)
The parameter \(\Delta v_{ITCk}\) in Eq. (38) is the business value of the security IT Service when the threat has been successfully mitigated.
6 Impact of Quality Changes on Business Value
In this section we will discuss the third numerical result with regards to calculating the impact on the business value of quality changes in the business IT services. This task is easy, as the procedure is the same as the one discussed in the previous section. The equations and methods derived in the previous section can also be applied here.
To calculate the impact on the business value, first the changes in availability and supply-ability are calculated using Eqs. (13), (14) and (15),
\[A'_{VTOTI} = \frac{t'_{Sl} - t'_{TOTI}}{t'_{Sl}}\] (39)
\[S'_{Al} = LA(VS'_{l}, VM'_{l}, \sigma M'_{l})\] \[\tag{40}\]
\[Q'_{TSI} = A'_{VTOTI} \times S'_{AI} \tag{41}\]
The parameter \(A_{VTOTI}\) now denotes the change in availability, \(t_{Sl}\) denotes the change in agreed time, and \(t_{TOTI}\) denotes the change in downtime. The parameter \(S_{Al}\) denotes the change in supply-ability, \(VS_{l}\) denotes the change in supply volume, \(VM_{l}\) denotes the change in average demand and \(\sigma M_{l}\) denotes the change in standard deviation. The parameter \(Q_{ITSl}\) denotes the change in quality. The index l indicates the \(l^{th}\) business IT service. With the same procedure as used in the previous section, one can proceed using Eq. (27) to obtain the aggregate value of changed quality at the \(m^{th}\) business demand \(Q_{BDm}\) as in Eq. (42):
\[Q_{BDm} = \sum_{l=1}^{L} w_{ITSml} \times (1 - w_{ITSm0})^{-1} \times Q_{ITSl}\] (42)
The next step is using Eq. (28) to calculate the changes of quality aggregated at the \(p^{th}\) business process as \(Q_{BPp}\) using Eq. (43)
\[Q'_{BPm} = \sum_{m=1}^{M} W_{BDpm} \times (1 - W_{BDp0})^{-1} \times Q'_{BDm}\] (43)
Finally, one can obtain the changes in the \(p^{th}\) business value denoted by parameter \(v_{BPm}\) using the translation function in Eq. (10), as follows,
\[V_{BPp} = FT_p(Q_{BPp}) \tag{44}\]
7 Case Illustration
Before presenting a case illustration for a real enterprise or business entity, simulation is performed to demonstrate the benefits of the model. The simulation is constructed through the relationships shown in Figure 4.It is assumed that there are four business evaluators, \(BE_1\), \(BE_2\), \(BE_3\), \(BE_4\), and four technical evaluators, \(TE_1\), \(TE_2\), \(TE_3\), \(TE_4\). The organization has five business processes, \(BP_1\), \(BP_2\), \(BP_3\), \(BP_4\), \(BP_5\), where each business process is supported by five business IT services, \(ITS_1\), \(ITS_2\), \(ITS_3\), \(ITS_4\), \(ITS_5\) through six defined business demands, \(BD_1\), \(BD_2\), \(BD_3\), \(BD_4\), \(BD_5\), \(BD_6\). The relationships between BP, BD and ITS are shown with a solid arrow line in Figure 4.
The relation between business processes and business demands is assumed to be specific and simple, i.e. a business process has few businesses demands, for example one to three demands. Each ITS has a vulnerability that can be exploited by five possible threats, \(TH_1\), \(TH_2\), \(TH_3\), \(TH_4\), \(TH_5\). It is assumed that three security IT services, \(ITC_1\), \(ITC_2\), \(ITC_3\), are implemented to control each threat.
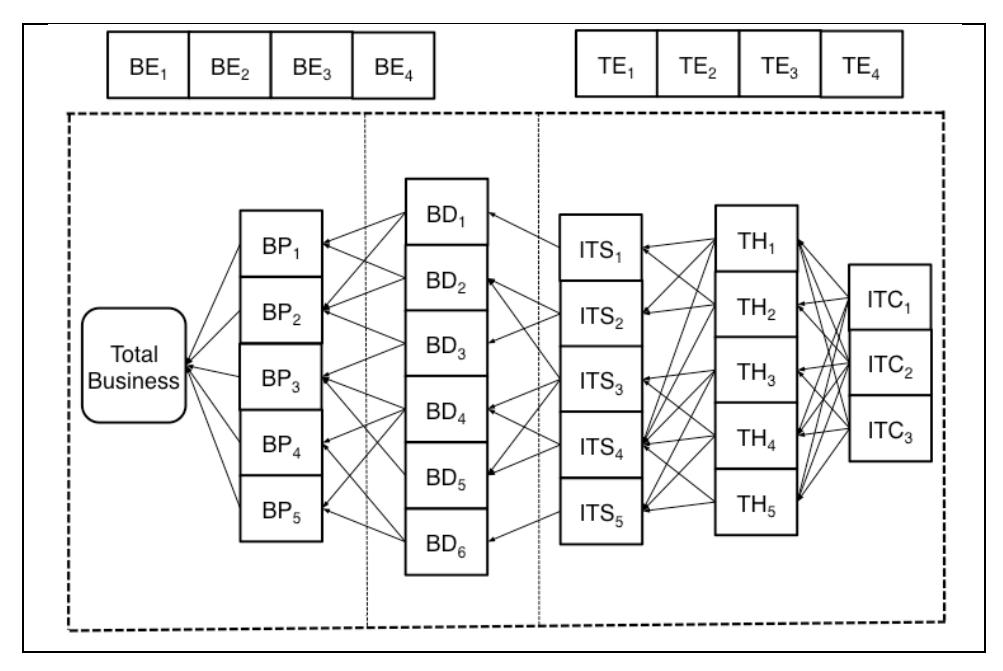
Figure 4 Visualization of the relationships used in the simulation. It is assumed that there are five business processes related to six business demands, and these business demands are related to four business IT services with relationship indicated with pointed arrows. Notice that the security IT services control every threat and each threat affects some business IT services.
Initially, one needs to distribute a questionnaire to the business evaluators and the technical evaluators in order to weigh their impact on assessment. The weight of each evaluator is captured with Eqs. (2) and (3). Each business and technical evaluator will assess the probability value of each entity under his/her responsibility as described in a previous section. The business evaluators will assess parameter wBPep with Eq. (5), and parameter wBDepm with Eq. (6). The technical evaluators will assess parameter wITStml with Eq. (11), parameter wTHtla with Eq. (18), and parameter wITCtak with Eq. (22). Assuming the weight of the evaluators, the business process as a result of the assessment by the evaluators and the quality standards is shown in Table 2.
Table 2 Business process, evaluator weight and quality standards.
| p | Business Process | wBP | QS2 | QS1 |
|---|---|---|---|---|
| 1 | BP1 | 0.352 | 93.9% | 66.5% |
| 2 | BP2 | 0.274 | 94.9% | 68.5% |
| 3 | BP3 | 0.120 | 92.8% | 63.6% |
| 4 | BP4 | 0.102 | 89.8% | 63.0% |
| 5 | BP5 | 0.152 | 86.2% | 59.3% |
| Total | 1.000 |
Based on the assumed value presented in Table 2, using the method proposed in this paper one can calculate the business value of the business IT services, where the final result can be seen in Table 3. The value is dominated by ITS1 and ITS2, which cover 41.7% of the overall value. The total business IT service value is up to 67.1% and the manual value is 8.2%.This means that in this particular scenario, the importance of IT services is clearly visible.
Table 3 Business value of business IT service for simulated system in Figure 4, with initial value in Table 2.
| p | Business IT Services | vITS |
|---|---|---|
| 1 | ITS1 | 23.1% |
| 2 | ITS2 | 18.6% |
| 3 | ITS3 | 10.0% |
| 4 | ITS4 | 8.1% |
| 5 | ITS5 | 7.3% |
| Total | 67.1% | |
| Manual | 8.2% |
For calculating the security IT service value, the assumed related parameter values are given in Table 4.
Figure 5 shows a graph of the simulation results for the values of the business IT services based on the model described in Eq. (26) and the values of security IT services in Eq. (38). The graph in Figure 5(a) illustrates the value of each business IT service l with security employed, which is equal to the actual business value. Graph in Figure 5(b) illustrates the value of each security IT service k with security employed.
Table 4 Parameters of threat impact onbusiness IT service.
| l | Business IT Services | tTOT | tNS | tS | AVTOT | QITS_NS | QBP_NS |
|---|---|---|---|---|---|---|---|
| 1 | ITS1 | 5.3 | 2.95 | 25.43 | 89.0% | 89.0% | 97.2% |
| 2 | ITS2 | 4.7 | 2.92 | 25.39 | 89.3% | 89.0% | 98.0% |
| 3 | ITS3 | 5.6 | 3.87 | 26.57 | 88.5% | 88.4% | 97.8% |
| 4 | ITS4 | 9.1 | 3.64 | 27.20 | 87.0% | 86.9% | 96.6% |
| 5 | ITS5 | 11.9 | 3.59 | 24.79 | 83.3% | 83.8% | 91.8% |
| Total | 36.6 | 16.98 | 129.38 | ||||
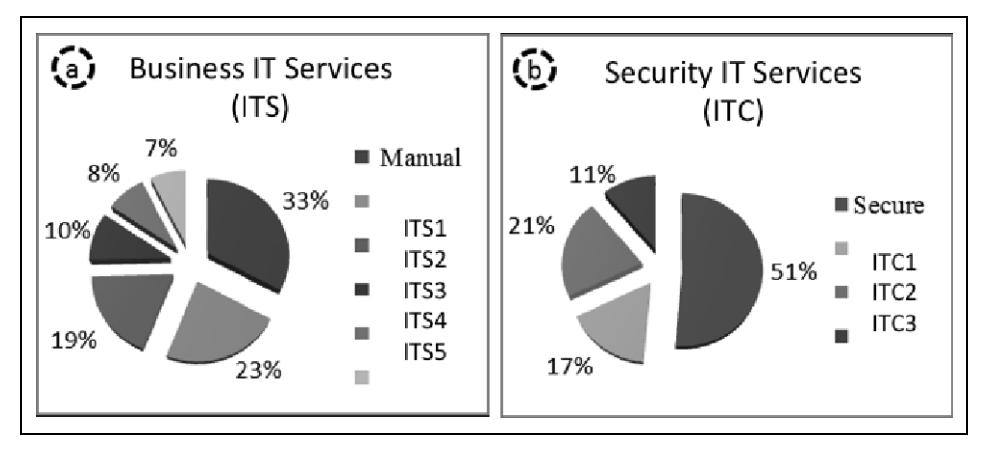
Figure 5 Graph of simulation results for: (a) value of business IT services, (b) value of security IT services.
Table 5 shows the changes in business value due to changes in the quality of IT services as derived in Eq. (44). One can discover that the business processesBP1 and BP2 are influenced by changes in the quality of ITS1, while BP4 and BP5 are affected by ITS5, see Figure 4. It turns out that a decrease of8% in the quality of ITS1results in a decrease of -25.6% of the total business value. Meanwhile, improving ITS5 quality by 6,9% only increases the business value by 3.7 %.
| Table 5 | Changes in business value due to changes in quality of business IT | ||||||
|---|---|---|---|---|---|---|---|
| services. |
| p | Business Process | QBP | Q'BP | vBP | ∆vBP |
|---|---|---|---|---|---|
| 1 | BP1 | 98,0% | 93,2% | 17,1% | -14,7% |
| 2 | BP2 | 98,0% | 94,0% | 13,2% | -10,9% |
| 3 | BP3 | 97,5% | 97,5% | 10,0% | 0,0% |
| 4 | BP4 | 95,3% | 97,8% | 9,1% | 1,6% |
| 5 | BP5 | 94,7% | 97,8% | 14,1% | 2,1% |
Now, for further validation of the model, a real case for a company is presented, albeit a small one. Only the valuations of IT services and IT security are given, since the calculation of the change in quality is straightforward, as illustrated in the simulation above. The model is applied to a company with its head office and production facilities located in Bandung, Indonesia. It was founded in 2004. Its main business is in advanced technology producing IT related products, such as computer telephony integration and IP telephony based on open-source
software. Yearly revenue of the company is around USD 200.000.They have a total number of employees of around 15. This is a small company, so that the number of entities used is limited. Upon assessment of the existing condition, it was found that there were two candidates to act as evaluator. One person was responsible for the business domain in sales and marketing, and the other was responsible for the technical aspect. There are two main business processes in the company: (i) computer telephony integration products and services, and (ii) IP telephony products and services. There are four business IT services that support the main businesses: (i) Accounting Application, (ii) Inventory Application, (iii) CRM Application (SugarCRM), and (iv) Project Development Application (Redmine). On the basis of interviewing the responsible personnel, one business demand of sales and marketing was considered to support the two main business processes. Data about threats were not available, so that based on the proposed method, the technical evaluator was responsible for assessing the values. Most threats are related to common threats in IT application, such as viruses, malware, or configuration vulnerabilities. The company has no specific security IT services employed. Most of the security control is accomplished through regular software backup, patches and upgrades. The technical evaluator had experience in dealing with security issues in all platform applications. No audit data were available, so that the technical evaluator gave their assessed values. The data for the two evaluators and their respective scores and weights can be seen in Table 6.
Table 6 Evaluator data, questionnaire scores and weight.
| No. | Data | Business Evaluator | Technical Evaluator |
|---|---|---|---|
| 1 | Sex | M | M |
| 2 | Age | 38 | 38 |
| 3 | Work Experience | 11 | 15 |
| 4 | Position | Marketing Manager | CTO |
| Scores | 60 | 80 | |
| Weight | 1 | 1 |
Based on the existing condition of the company, its probabilistic model can be seen in Figure 6.
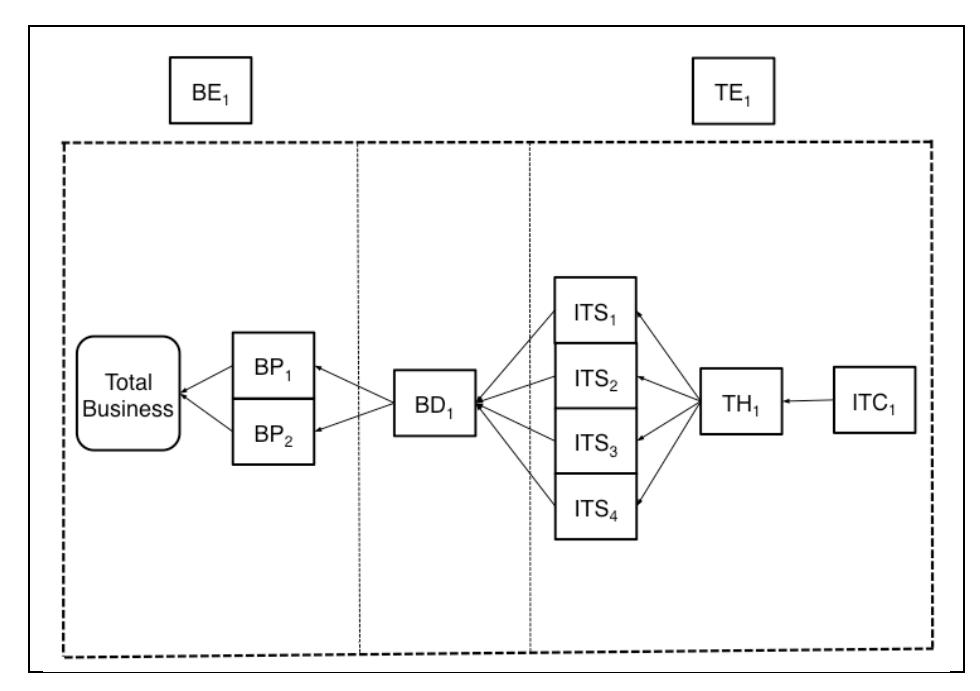
Figure 6 The model of the company in the case study. In this case only one business demand in sales and marketing was considered. No technical data for threats were available, so that the technical evaluator gave his assessment for threat probability. The same condition was applied for security control, since no dedicated security control is in place and the technical evaluator gave his assessment for the role of security IT to mitigate vulnerability.
Using the proposed method's Eqs. (2) and (3) one can find the weight of each evaluator, as shown in Table 6. Then, using the same procedure as described in the simulation above, the assessments from the evaluators and the quality standard for the business processes are shown in Table 7.
Table 7 Assessment from business evaluators for entities in business domain
| p | Business Process | wBP | QS1 | QS2 |
|---|---|---|---|---|
| 1 | BP-1: Computer telephony integration | 0.7 | 80% | 30% |
| products and services | ||||
| 2 | BP-2: IP telephony products and | 0.3 | 75% | 30% |
| services |
| m Business Demand | wBD | Man. |
|---|---|---|
| 1 BD-1: Sales and Marketing | ||
| - For BP-1 | 0.7 | 0.3 |
| - For BP-2 | 0.8 | 0.2 |
Now, using the proposed procedures, one can find the business value for the IT services vITS and IT security vITC for this company, as shown in Table 8.
Table 8 Assessments from technical evaluators for entities in technical domain and valuation result vITS and vITC using the proposed method.
| l | Business IT Services | wITS | vITS | |
|---|---|---|---|---|
| 0 | Manual | 0.20 | 15.3% | |
| 1 | ITS-1: Accounting application | 0.40 | 30.6% | |
| 2 | ITS-2: Inventory Application | 0.05 | 3.8% | |
| 3 | ITS-3: CRM Application (SugarCRM) | 0.10 | 7.7% | |
| 4 | ITS-4: Project Development Application (Redmine) | 0.25 | 19.1% | |
| a | Threat | wTH | vTH | |
| 1 | TH-1: Manual, TE assessment based on experience | 0.25 | 27.6% | |
| k | Security IT Services | wITC | vITC | |
| 1 | ITC-1: Manual, TE assessment based on experience | 0.28 | 37.3% |
It was the first time for the company to have a business valuation of their IT services, so that they could not compare the results to those of other valuation methods. From the discussion and interview with the responsible personnel it can be concluded that the calculation results of the IT services (vITS) and IT security (vITC) proposed in this paper were sufficient to represent the companies' condition and easy enough to be understood and implemented.
With the simulation and the case study it has been shown that the probabilistic approach of the proposed model achieved its objective in obtaining the business value of IT services. In addition, it is relatively easy for managers to make a value assessment rather than having to deal with all kinds of fuzzy parameters or detailed technical parameters as in previously published models. The addition of IT security is confirmed to be an important aspect for IT valuation and more realistic in representing the actual condition of a company. Nevertheless, there are several points to be addressed and discussed in future research. The questionnaire for the evaluators should be designed carefully to reflect their influence since some of the values are assessed subjectively. The quality of IT services could be extended beyond availability and supply-ability, such as IT
capability. In the proposed model, threats are uncorrelated and their relationship to the IT services is a simple one-to-many connection, while in real life threats are mostly correlated with each other and their connection could be many-tomany. Finally, even though they are not required to have Business Performance Management implemented, an enterprise still has to make sure that the interconnection of all entities should represent the actual condition of the organization in order to be able to apply the proposed model.
8 Conclusion
In this paper a new method for valuation of IT services was proposed based on a probabilistic approach. It is widely understood that non-IT managers' low understanding of the benefits of IT services may result in an inconsistency of the valuation of IT business and service. The proposed model was designed to clarify the roles of business evaluators and technical evaluators by introducing the supply and demand relationship between business processes and IT services in order to prevent non-IT manager's evaluation errors, so that the business manager only evaluates the business domain and the technical manager only evaluates the technical domain. Furthermore, it has been shown that simplifying the quality metric of IT services into availability and supply-ability can reduce the complexities of technical assessment in the BDM and VDT method. The proposed model also includes the factors security and risk, which are not covered by previously published models. This inclusion is intended to provide a more comprehensive business valuation of IT services and better applicability to organizations, since they are both calculated directly from their effect on quality metrics and business value. This paper also discussed the impact of changes in quality of IT services on business value. A simulation and a case illustration for a real enterprise have shown the benefits of application of the proposed model, albeit in a simple situation. It has been shown that the model achieved its design objectives.